Book TOC · Previous · Chapter 6 of 7 · Next
Chapter 6: SOC Observability: Native Dashboards, MTTD/MTTR Reporting & Silent Source Health Alerting
Chapter Focus: Native SecOps Dashboards, SOC KPIs (MTTD, MTTR, alert volume, ROI), executive posture reporting, Data Ingestion & Health Dashboard, parser drop monitoring, and Cloud Monitoring silent-log-source alerting.
Subsection 6.1: Developing and Maintaining Dashboards and Reports to Provide Insights
The Big Picture
Section 6 (Observability, ~10% in Google Cloud architectures) covers two complementary lenses: Security Analytics Dashboards & Reporting (6.1) and Pipeline Health Monitoring & Silent Source Alerting (6.2). In Subsection 6.1, the most common mistake security engineers make is building one single crowded dashboard that mixes raw technical logs with executive metrics, or choosing the wrong visualization platform for the retention horizon:
- Confusing Core SOC Operational KPIs (
MTTDvs.MTTAvs.MTTR/MTTC) (6.1a): - If a board member asks "How fast is our detection engineering improving?" and you show them Mean Time to Remediate (
MTTR), you are measuring the wrong phase! Detection speed from intrusion to alert is Mean Time to Detect (MTTD); triage queue pickup speed is Mean Time to Acknowledge (MTTA); active response and isolation speed is Mean Time to Contain / Respond (MTTC/MTTR). - Choosing the Wrong Dashboard Engine (
Native SecOps SIEM/SOAR Dashboardsvs.BigQuery + Looker Studio) (6.1b,6.1c): - Native Google SecOps Dashboards (Built-in Looker-powered SIEM & SOAR dashboards): Ideal for operational SOC visibility inside the SecOps console—tracking real-time ingestion throughput (
EPS), active rule detections, IOC match trends, SOAR playbook execution status, and analyst shift workloads. - BigQuery + Looker Studio: Mandatory when leadership requires multi-year year-over-year historical comparisons (beyond SIEM hot retention), blending Google SecOps data with external enterprise datasets (such as HR headcount, ServiceNow financial risk, or multi-org SCC posture exports), or sharing scheduled executive PDF/slide reports with stakeholders who do not have IAM access to the Google SecOps console!
Consideration 6.1a: Identifying key security analytics (e.g., metrics, KPIs, trends)
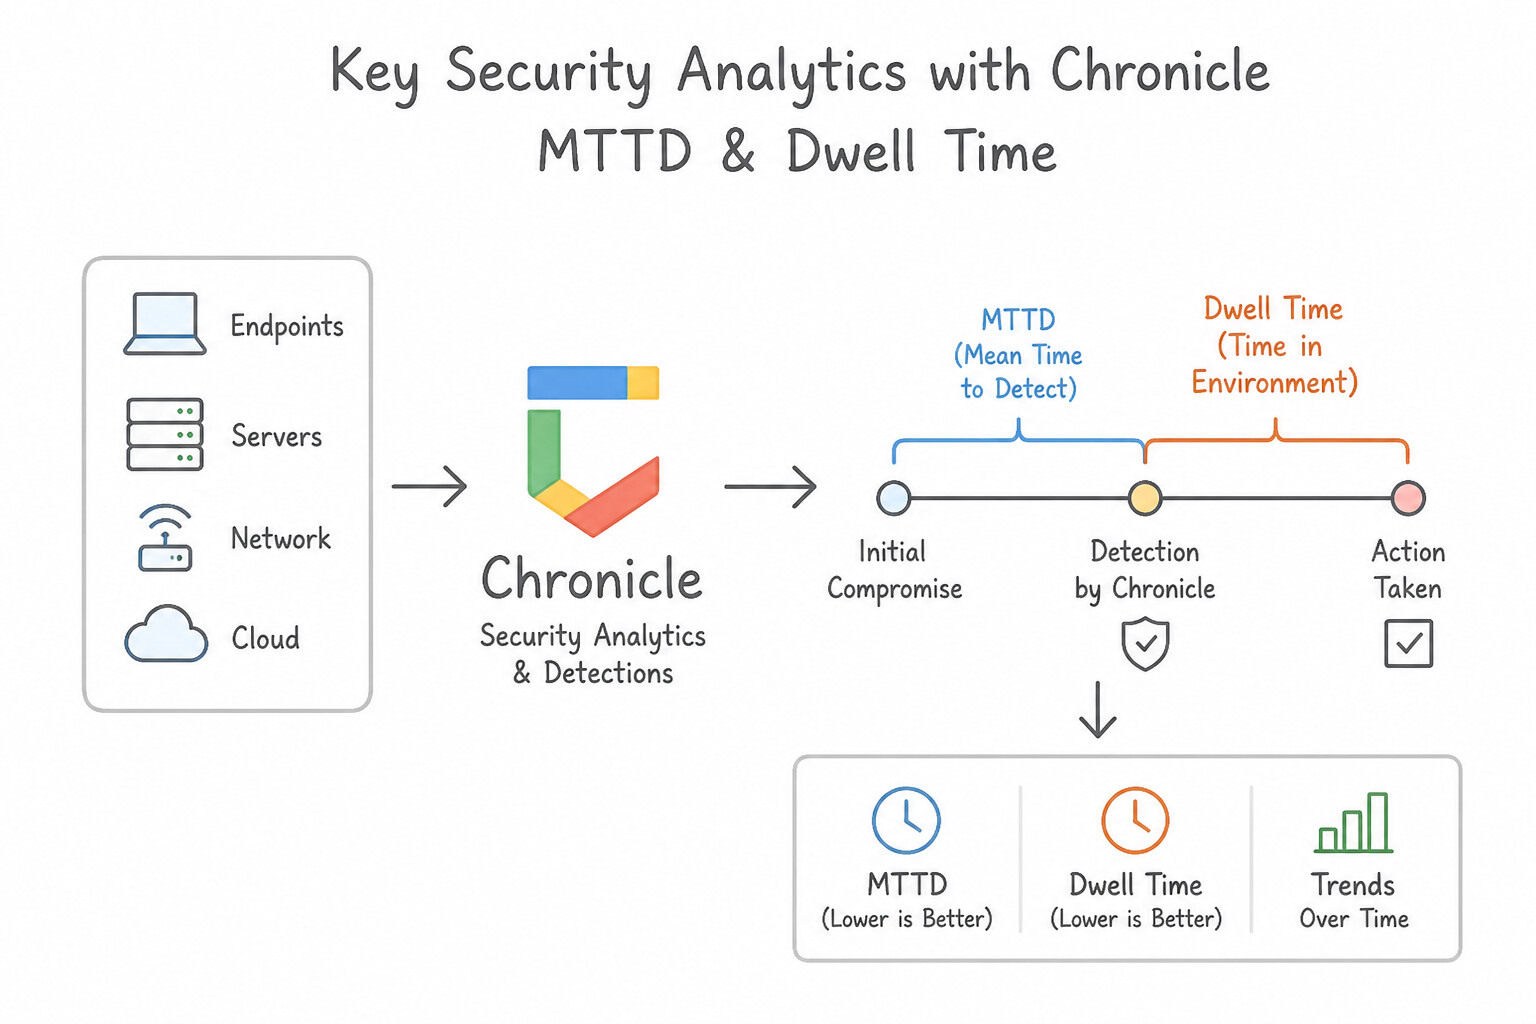
Memorize the exact definitions and formulas of the core SOC KPIs tested in production:
- 1.
MTTD(Mean Time to Detect / Dwell Time): - $\text{MTTD} = \text{Average}(\text{Timestamp}_{\text{Alert Detected}} - \text{Timestamp}_{\text{Initial Compromised Activity}})$.
- Measures the effectiveness of your Detection Engineering and Threat Hunting (how long an adversary operates in the environment before an alert fires).
- 2.
MTTA(Mean Time to Acknowledge): - $\text{MTTA} = \text{Average}(\text{Timestamp}_{\text{Analyst Acknowledges Case}} - \text{Timestamp}_{\text{Alert Created}})$.
- Measures Tier 1 queue responsiveness, shift handoff efficiency, and alert notification routing.
- 3.
MTTC/MTTR(Mean Time to Contain / Respond / Remediate): - $\text{MTTR} = \text{Average}(\text{Timestamp}_{\text{Incident Contained/Resolved}} - \text{Timestamp}_{\text{Alert Created}})$.
- Measures the effectiveness of SOAR Playbook Automation and Incident Response workflows.
- 4. Rule Precision & Signal Quality Metrics:
- False Positive Rate (
FPR): Percentage of closed alerts marked asFalse Positive / Benignper YARA-L rule—identifies rules requiring immediate tuning. - Alert-to-Case Grouping Ratio: Measures how effectively SOAR Alert Grouping consolidates noisy related alerts into unified cases.
- Events Per Second (
EPS) & Gigabytes Per Day (GB/day): Measures log ingestion throughput and capacity trends across log types.
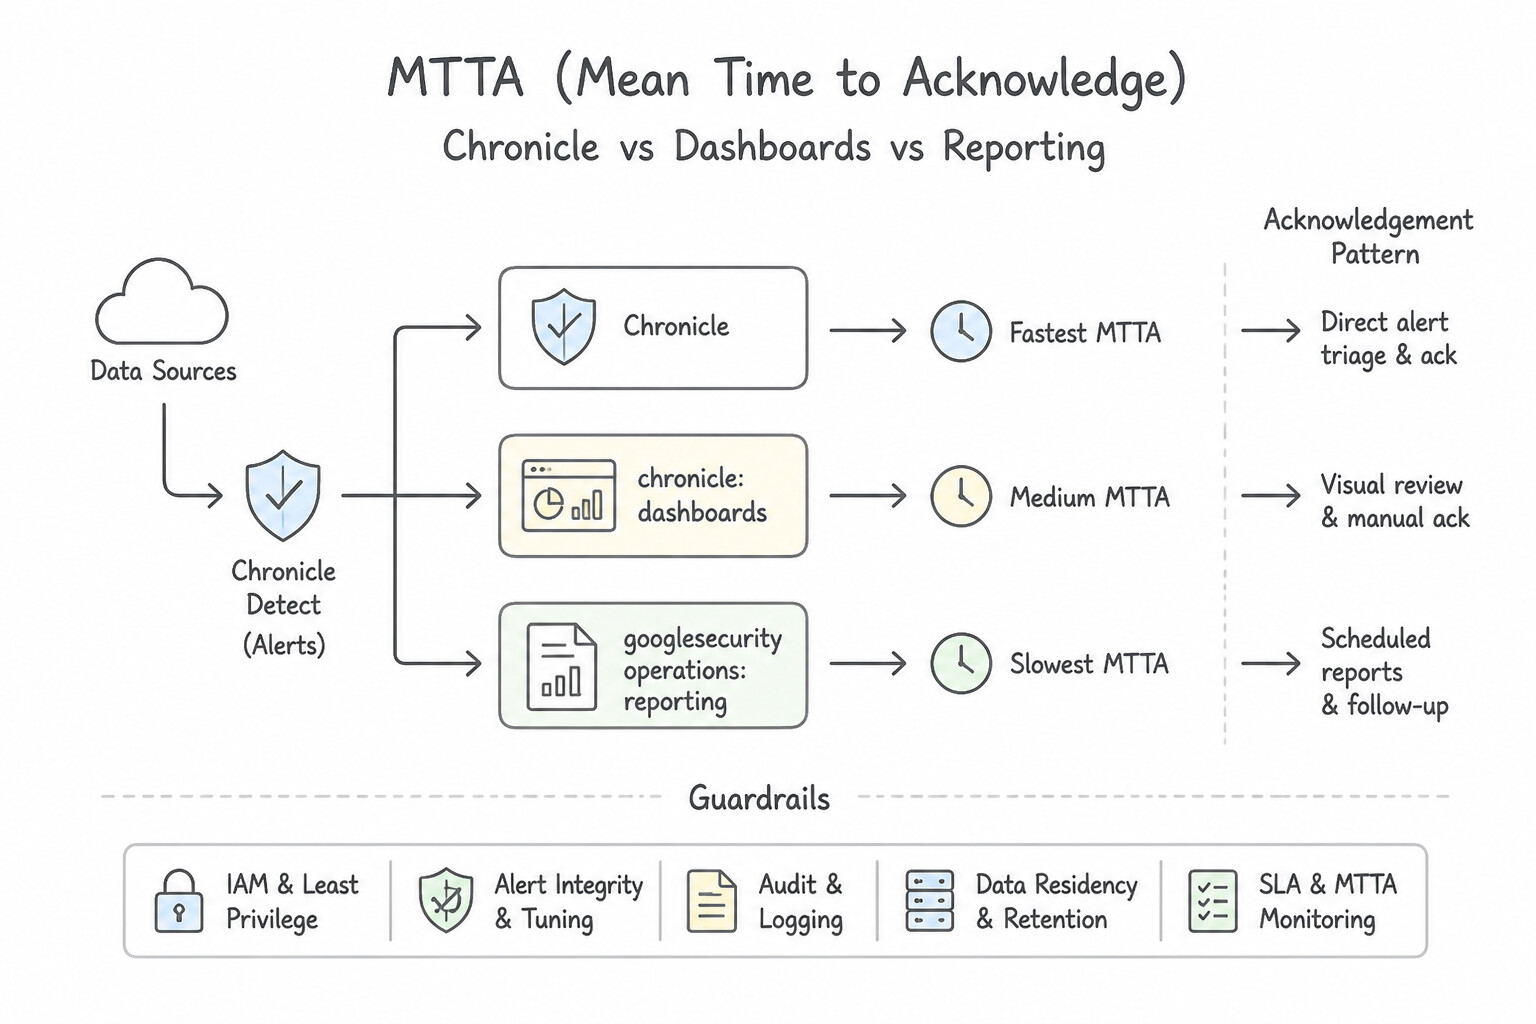
Key Implementation Patterns
- SOC Efficiency: MTTD and MTTR Tracking: Use Configure the dashboard to display Mean Time to Detect (MTTD) and Mean Time to Respond (MTTR). MTTD and MTTR are the standard metrics for measuring the speed of threat identification and neutralization. (Avoid alternative: Log volume and rule counts measure system scale, not team response efficiency.)
- Detection Rule Tuning and Noise Reduction: Use Create a bar chart that displays the top 10 detection rules sorted by the number of detections generated. Ranking rules by volume identifies the specific 'noisy' rules that require immediate tuning. (Avoid alternative: A total count line chart shows trends but does not identify specific noisy rules.)
- Data Ingestion Health and Capacity Planning: Use Visualize Events Per Second (EPS) and ingestion bandwidth trends compared to your quota. Comparing current EPS and bandwidth against your quota immediately reveals if data is being dropped due to capacity limits. (Avoid alternative: Counting detection rules tracks configuration changes, not the health or capacity of the data ingestion pipeline.)
Key Takeaways (6.1a)
- MTTD (Mean Time to Detect) measures how long a threat remains undiscovered.
- MTTR (Mean Time to Respond) measures how quickly a team neutralizes a known threat.
- Volume metrics (like EPS or log count) measure scale, not efficiency.
- Infrastructure metrics (like CPU/RAM) measure health, not operational success.
Consideration 6.1b: Implementing dashboards to visualize security telemetry, ingestion metrics, detections, alerts, and IOCs (e.g., Google SecOps SOAR, SIEM, Looker Studio)
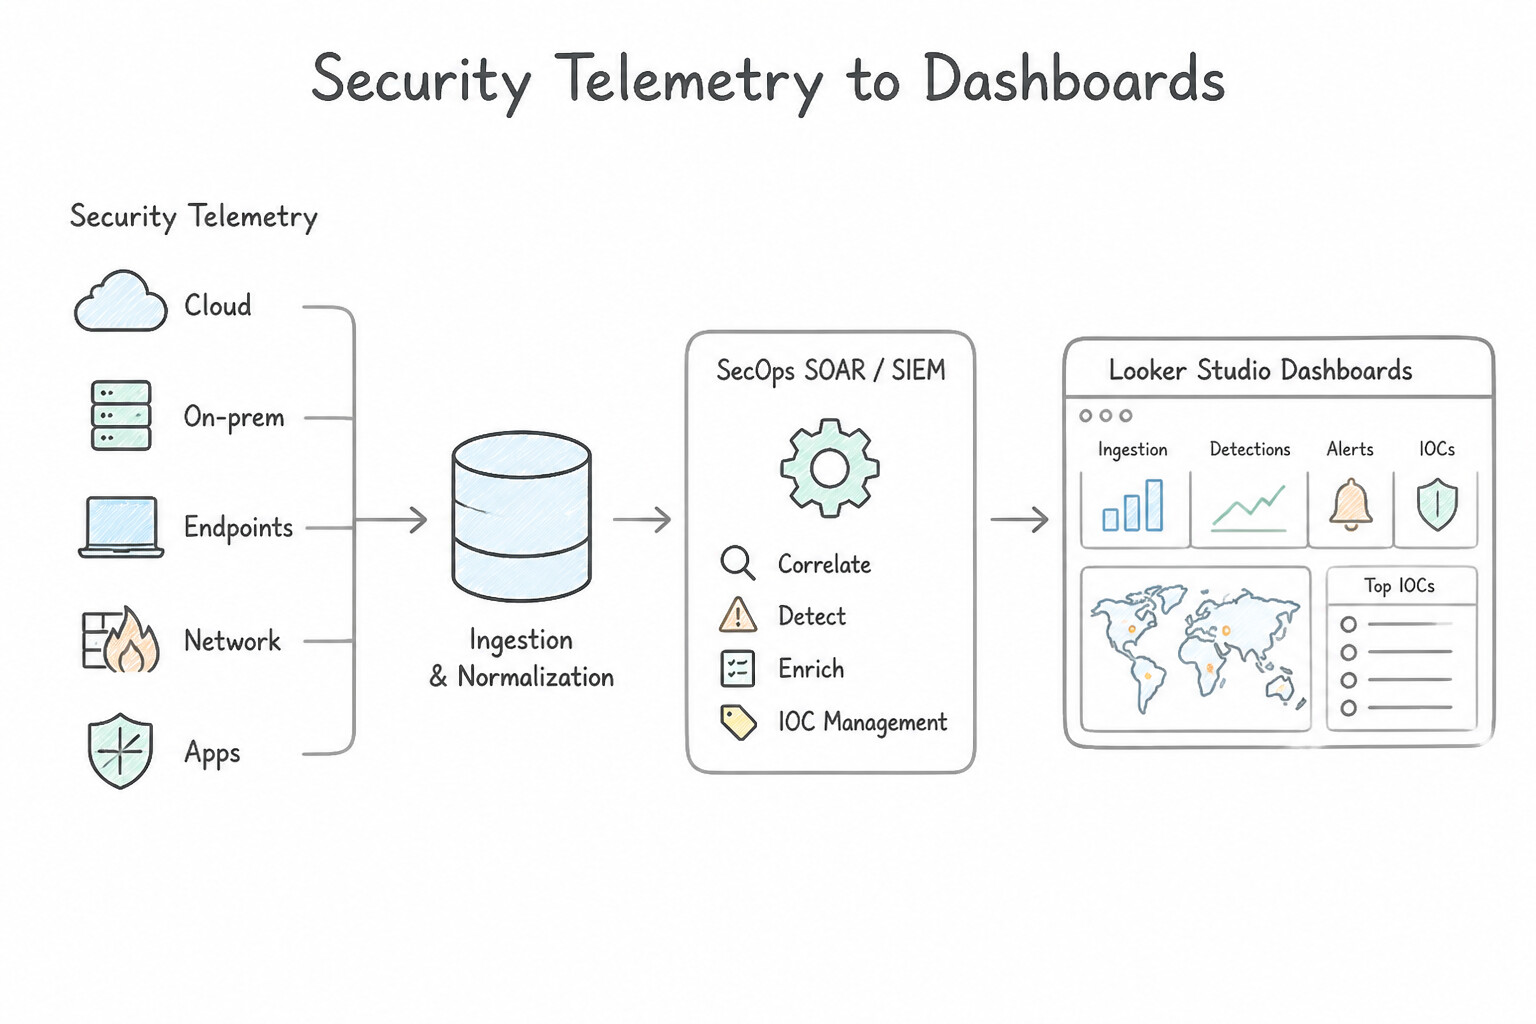
Know when to use Native Google SecOps Dashboards versus BigQuery + Looker Studio, and which chart type fits each analytical goal:
- 1. Native Google SecOps Dashboards (SIEM & SOAR):
- Built directly into the Google SecOps UI (powered by embedded Looker technology).
- Out-of-the-Box & Custom Native Dashboards query live UDM events,
IOC Matches,Rule Detections,Data Ingestion & Health, andSOAR Case / Playbook Metricswithout exporting data outside SecOps. - 2.
BigQuery+Looker StudioArchitecture: - Choose BigQuery + Looker Studio when the production scenarios requires:
- Multi-Year Historical Trends (e.g., comparing resolved vs. open incidents year-over-year across 24–36 months, exceeding standard SIEM console dashboard windows).
- Cross-Platform Data Blending (joining Google SecOps detection tables with SCC Continuous Export findings, Cloud Billing data, or external BigQuery HR/CMDB tables).
- Executive / External Stakeholder Access for users who should not be provisioned inside the operational Google SecOps console.
- 3. Selecting the Right Visualization Chart Type:
- Trends Over Time (e.g., 30-day alert volume, EPS spikes, MTTR trend): Time-Series Line Chart or Area Chart.
- Categorical Ranking (e.g., Top 10 Noisiest YARA-L Rules, Top 10 Targeted Hosts): Horizontal Bar Chart.
- Multi-Dimensional Matrix (e.g., Severity × Case Stage or MITRE Tactic × Rule Count): Heatmap / Pivot Table.
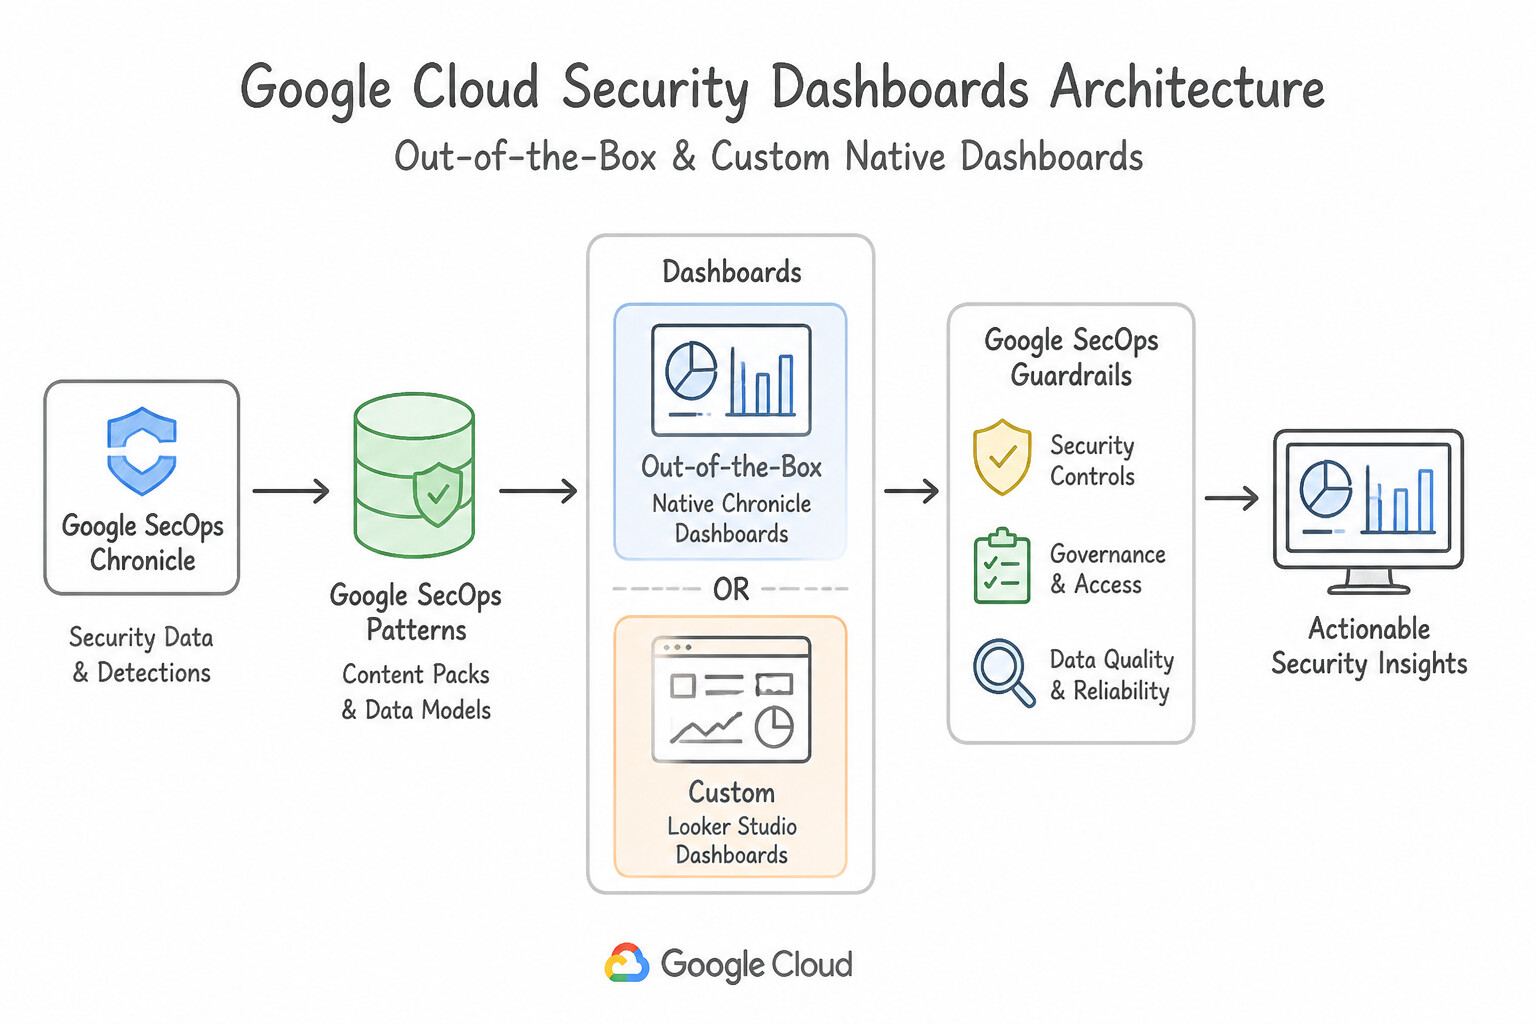
Key Implementation Patterns
- Visualizing Ingestion Health Drops: Use Configure a line chart in Google SecOps or Looker Studio to display the Events Per Second (EPS) trend for each log type. Tracking Events Per Second (EPS) directly measures data volume, making it the best metric to visualize ingestion health and drops.
- Executive Reporting with Looker Studio: Use Configure Google SecOps to export alert and case data to BigQuery, then connect Looker Studio to BigQuery to build a custom visualization. Exporting data to BigQuery allows Looker Studio to generate the required external executive dashboard.
Key Takeaways (6.1b)
- Events Per Second (EPS) is the standard metric for monitoring log ingestion health.
- A drop in EPS often indicates infrastructure issues, such as a disconnected log forwarder.
- Do not confuse security outcomes (alerts/IOCs) with operational health (volume/uptime).
- Dashboards should include a section for 'System Health' to ensure analysts trust the data they are viewing.
Consideration 6.1c: Generating and customizing reports (e.g., Google SecOps SOAR, SIEM)
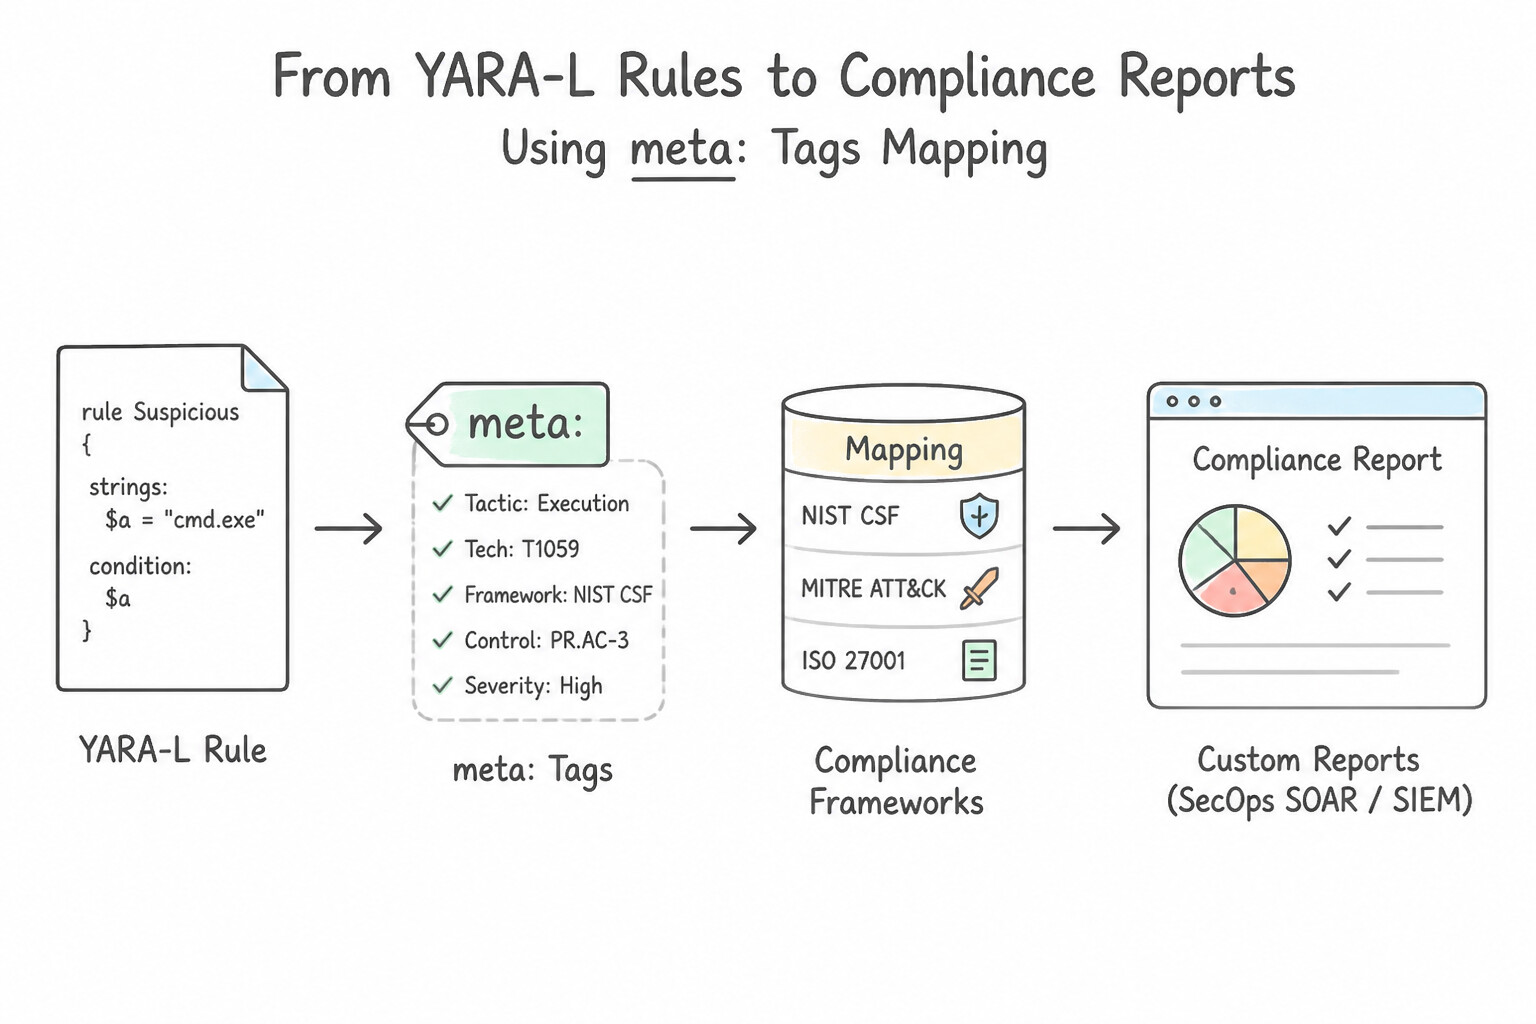
Security operations teams must regularly prove compliance (PCI-DSS, HIPAA, GDPR, SOC 2, ISO 27001) and report ROI to leadership:
- Mapping YARA-L Rules to Compliance Frameworks via
meta:Tags: - To generate automated compliance reports showing which detection rules satisfy specific regulatory controls (e.g.,
HIPAAorGDPR), add standardized custom key-value tags in themeta:section of your YARA-L rules (e.g.,compliance_framework = "HIPAA",mitre_attack_technique = "T1078"). - Native SecOps dashboards and BigQuery reports can then filter and group
rule_detectionsand active rules directly by thosemetatags! - Customizing & Scheduling Reports in Google SecOps SOAR & SIEM:
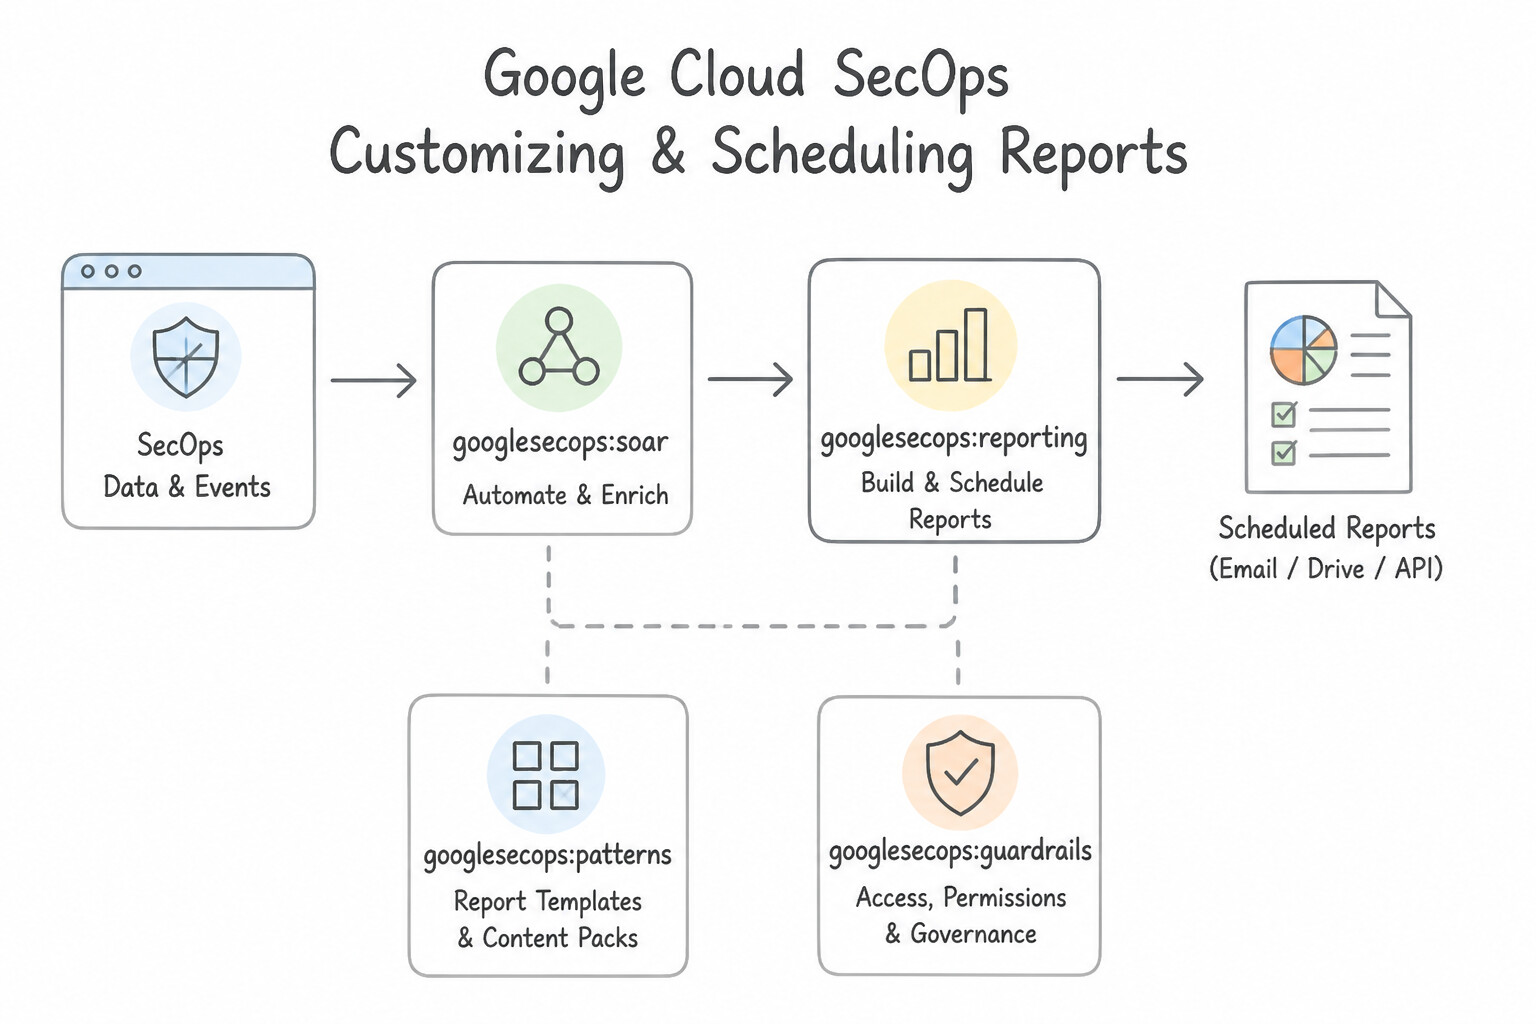
- Use SOAR Reports and SIEM Dashboard Scheduled Delivery to export customized PDF/CSV summaries on a recurring cron schedule (daily shift summary, weekly detection tuning report, monthly CISO executive brief) filtered by SOAR Environment, Case Stage, or Time Range.
Key Implementation Patterns
- Monitoring SOC Efficiency with KPI Widgets: Use Add the "Mean Time to Detect (MTTD)" and "Mean Time to Resolve (MTTR)" widgets to the dashboard. MTTD and MTTR are the specific time-based metrics that measure how quickly a SOC detects and resolves incidents. (Avoid alternative: These widgets display current workload status and severity distribution, not time-based efficiency metrics.)
- Automated Report Scheduling and Delivery: Use Navigate to the Reports module, filter for 'Critical' alerts, and configure a scheduled report with weekly recurrence and PDF output to be emailed. The Scheduling feature in the Reports module automates the generation and delivery of reports based on defined intervals and formats.
- Integration with Looker for Advanced Visualization: Use Enable the export of UDM events to BigQuery. Use Looker to join the UDM dataset with the HR table and build the dashboard. Export UDM events to BigQuery to enable SQL joins with other business data and visualize the results using Looker.
Key Takeaways (6.1c)
- MTTD (Mean Time to Detect) measures the average time to discover a threat.
- MTTR (Mean Time to Resolve) measures the average time to fix an incident.
- Efficiency metrics focus on time and speed, whereas volume metrics focus on quantity (total cases).
- Dashboards in Google SecOps SOAR are widget-based and customizable for different stakeholders (e.g., CISO vs. Analyst).
Quick Decision Cheat Sheet (Subsection 6.1)
If the Scenario Requires... | Choose This Google Cloud Pattern | Avoid This Common Mistake |
|---|---|---|
"Multi-year year-over-year security trend visualization or blending SecOps data with external BigQuery tables" | Google SecOps / SCC Export to BigQuery → Looker Studio | Relying solely on default 30-day in-console widgets or manually exporting CSVs to Excel |
"Tag detection rules so compliance auditors can filter alerts by regulatory framework ( PCI-DSS, HIPAA, GDPR)" | Add custom key-value attributes in the YARA-L meta: section | Adding dummy variables in the events: section or creating separate SecOps tenants per regulation |
"Metric that measures elapsed time from initial adversary intrusion to the moment an alert triggers" | Mean Time to Detect ( MTTD) | Mean Time to Respond ( MTTR) or Events Per Second (EPS) |
"Metric that measures elapsed time from alert creation to complete threat containment and resolution" | Mean Time to Respond / Contain ( MTTR / MTTC) | Mean Time to Detect ( MTTD) or False Positive Rate (FPR) |
Further Reading (Subsection 6.1)
- Google Cloud Security Operations — General documentation on Chronicle and security operations concepts. While specific dashboard configurations vary, the concepts of MTTD and MTTR are universal in security operations.
- Use the Health Hub — Discusses how to view detection metrics and identify rules that are generating errors or excessive detections in Google Security Operations.
- Ingestion API — Documentation describing how data is ingested into Chronicle and the metrics relevant to feed management and health monitoring.
- Ingestion metrics schema — Provides details on how to view and interpret ingestion metrics, including EPS, to monitor the health of data feeds.
- Dashboards overview — Documentation describing how to use BigQuery and Looker Studio for reporting on Chronicle data.
- SOAR Dashboards overview — Documentation describing how to create custom dashboards and add widgets in Google SecOps SOAR (formerly Siemplify).
Subsection 6.2: Configuring Health Monitoring and Alerting
The Big Picture
Imagine yourDetection Engineering team has written 200 world-class YARA-L rules covering every MITRE ATT&CK technique. On Friday at 18:00 UTC, a network administrator accidentally updates an on-premises firewall ACL or rotates a service account credential, breaking the Google SecOps Forwarder that ships Active Directory and VPN logs to Google Cloud. For the entire weekend, zero Active Directory alerts fire in Google SecOps. An unmonitored SOC assumes it is having a quiet weekend—while an adversary brute-forces Domain Admin accounts completely unseen because the telemetry pipeline is dead!
Subsection 6.2 teaches you how to monitor the monitors: instrumenting Google SecOps ingestion metrics, Cloud Logging, and Cloud Monitoring to detect pipeline drops, parser failures, forwarder outages, and Silent Log Sources (6.2f) in real time:
Consideration 6.2a: Identifying important metrics for health monitoring and alerts
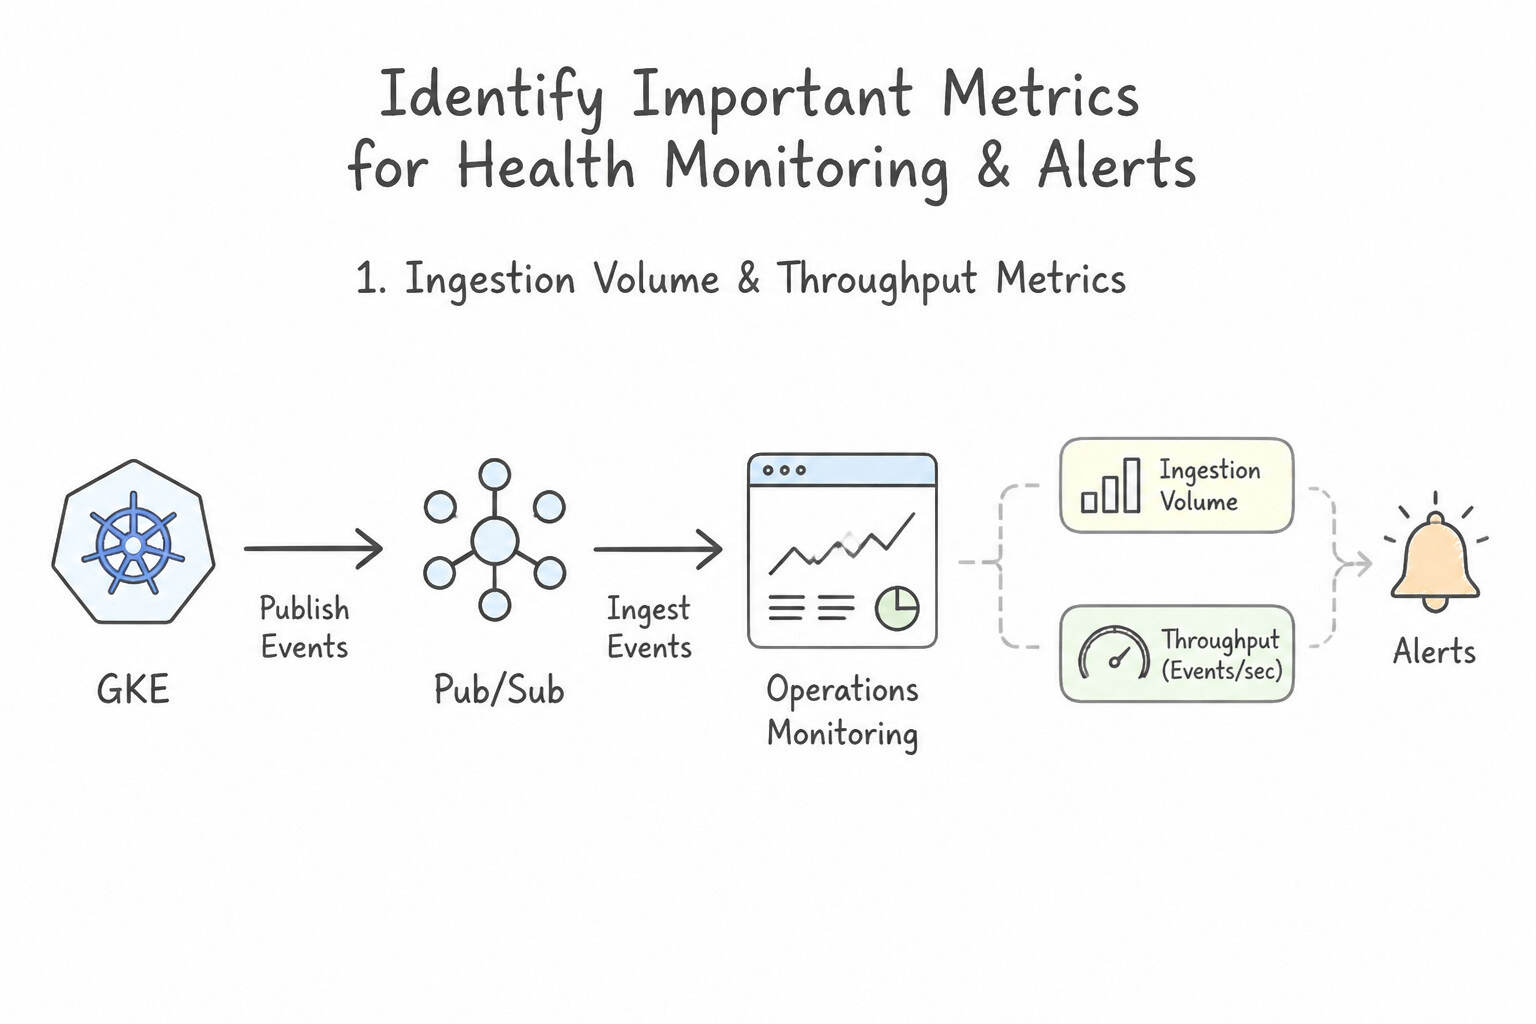
To guarantee end-to-end reliability of your security telemetry pipeline, monitor these four critical metric families in Cloud Monitoring (chronicle.googleapis.com/* and logging.googleapis.com/*):
- 1. Ingestion Volume & Throughput Metrics:
chronicle.googleapis.com/ingestion/input_bytes&input_record_count(broken down bycollector_idandlog_type): Tracks raw telemetry arriving from Forwarders, Feeds, and the Ingestion API.- 2. Normalization & Parser Health Metrics:
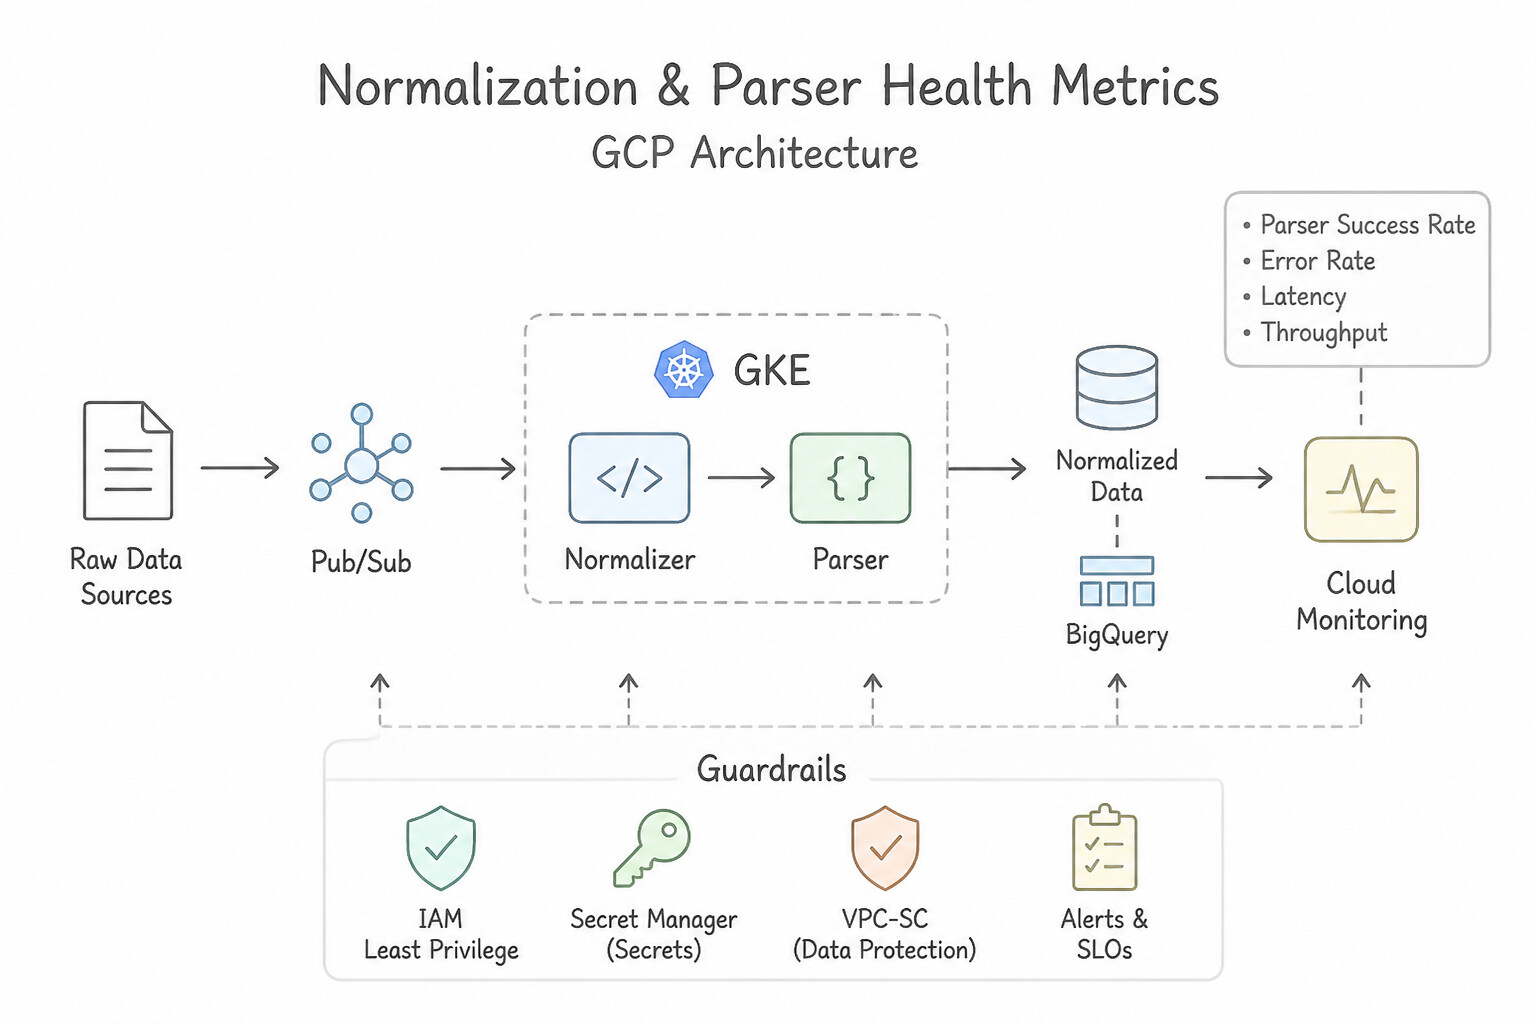
chronicle.googleapis.com/ingestion/parsed_record_countvs.failed_parse_count/validation_error_count: A sudden spike infailed_parse_countfor a specificlog_typeimmediately warns you that a vendor firmware upgrade changed a log format and broke the parser!- 3. SecOps Forwarder / Collector Health Metrics:
- Forwarder heartbeat status, memory/CPU usage, and local disk buffer utilization (warning before the on-premises buffer fills up during a network outage).
- 4. Cloud Logging Export Sink Metrics:
logging.googleapis.com/exports/byte_countandexports/error_count: Detects if an Organization Log Router Sink fails to write to Pub/Sub, BigQuery, or Cloud Storage due to revoked IAM permissions or quota limits.
Key Implementation Patterns
- Golden Signals for User Experience: Use Configure the monitoring dashboard to display the 95th and 99th percentile latency. Averages hide outliers; monitoring the 95th or 99th percentile (p95/p99) reveals the experience of the slowest requests. (Avoid alternative: Averaging over a longer time window further dilutes the data, hiding specific slow requests.)
- GKE App Crash Loops: Use Configure an alert to trigger when
kubernetes.io/container/restart_countincreases significantly. The restart count metric directly measures how often containers fail and restart, indicating instability. (Avoid alternative: CPU usage measures processing load, not application stability or crash frequency.) - Asynchronous Pipeline Backlogs: Use View the
subscription/oldest_unacked_message_agemetric in Cloud Monitoring. Theoldest_unacked_message_agemetric indicates how far behind the subscriber is in processing messages, directly correlating to the data delay. (Avoid alternative: This metric tracks the rate of incoming messages from publishers, not the delay or backlog on the consumer side.)
Key Takeaways (6.2a)
- Averages hide details: Never rely solely on average latency, as it smoothes out the extremes.
- Monitor the tail: Use p95 and p99 percentiles to understand the experience of users with the slowest requests.
- Golden Signals: Latency is one of the four Golden Signals (along with Traffic, Errors, and Saturation).
- Distinguish symptoms from causes: High CPU is a cause or symptom of load; high restart count is a symptom of instability.
Consideration 6.2b: Creating dashboards that centralize metrics
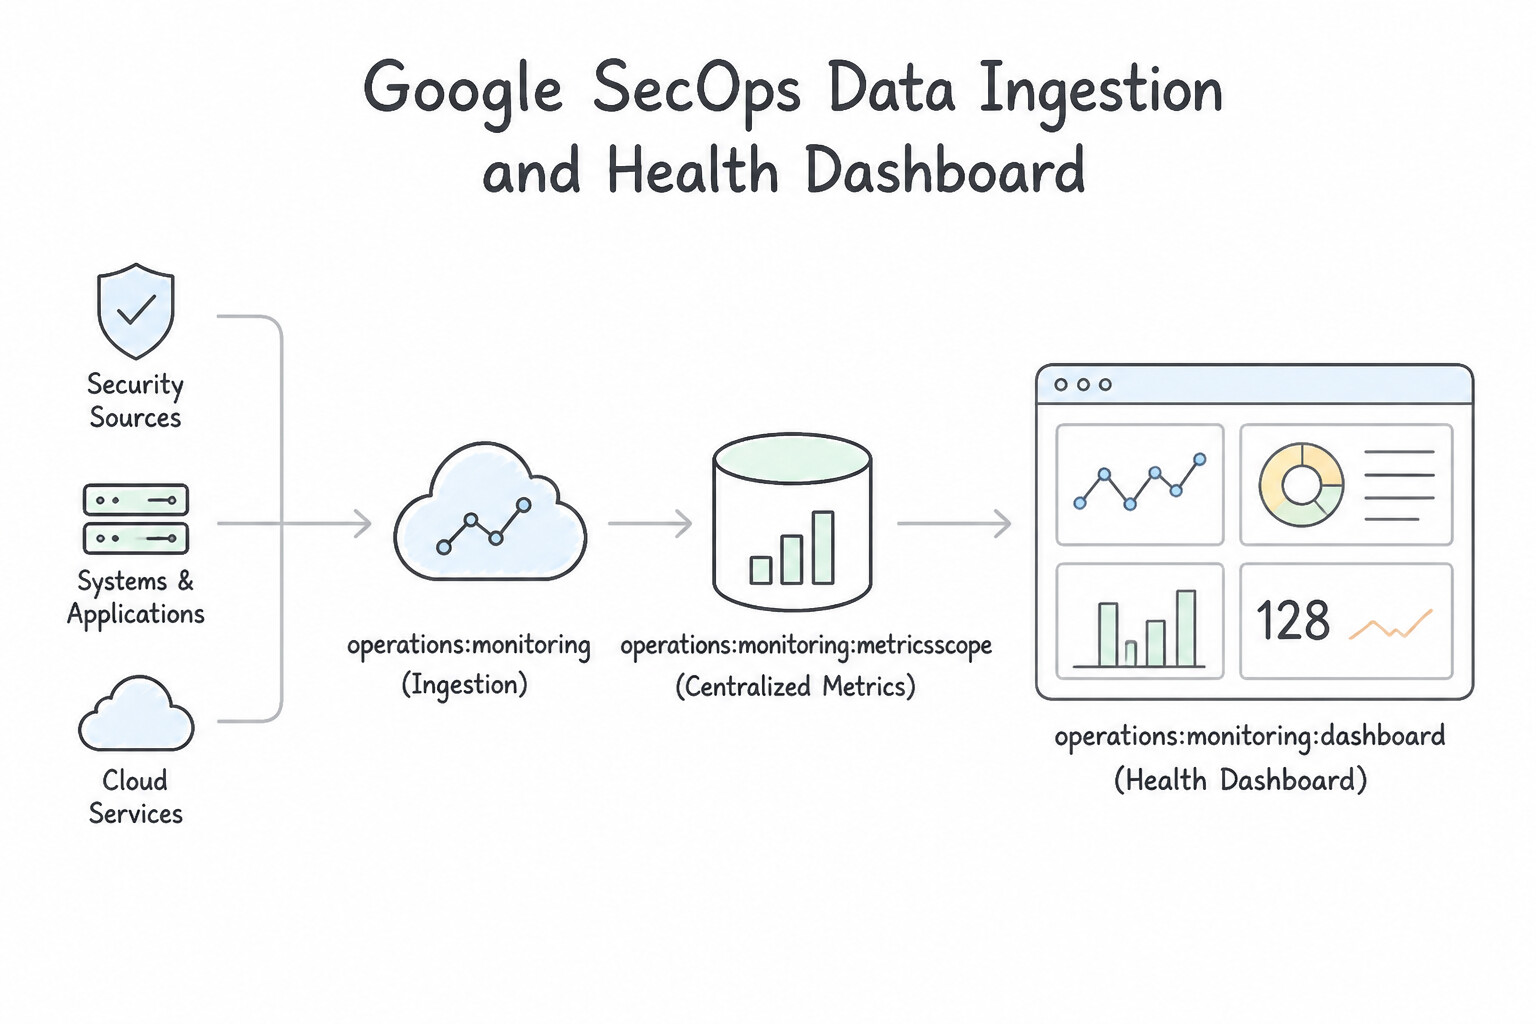
When an ingestion drop or pipeline anomaly occurs, engineers need a single centralized view to isolate the root cause:
- 1. Google SecOps
Data Ingestion and HealthDashboard: - Built directly into the SecOps console; breaks down total ingested volume, event counts, and parser error rates by
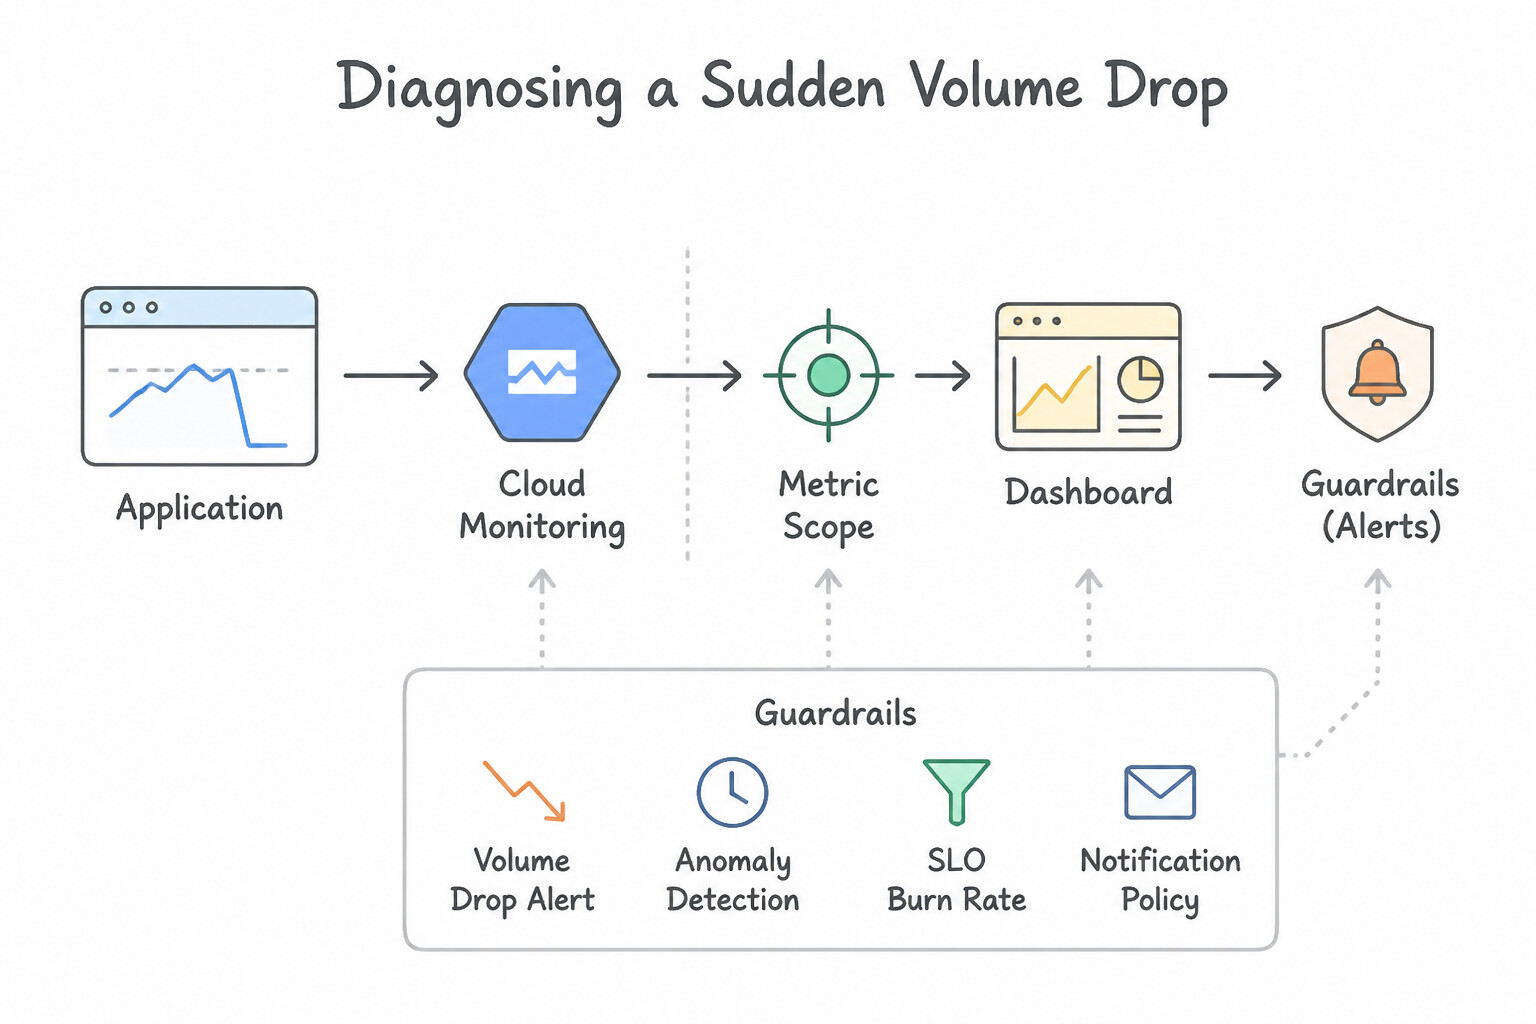
log_type,Feed Name, andForwarder / Collector ID. - Diagnosing a Sudden Volume Drop: If total SIEM log volume drops by 40% compared to last week's baseline, slice the Data Ingestion and Health Dashboard by
log_typeandcollector_idto immediately pinpoint which specific appliance or forwarder stopped sending logs! - 2. Centralized
Cloud MonitoringCustom Dashboards: - Combine
chronicle.googleapis.commetrics,logging.googleapis.comsink metrics,pubsub.googleapis.comunacknowledged message backlog (num_undelivered_messages), and Compute Engine Ops Agent metrics onto a single pane of glass for the SecOps platform engineering team.
Key Implementation Patterns
- Centralizing Multi-Project Monitoring: Use Select a central project and add the other 49 projects to its metrics scope. Create the dashboard in this central project. Configuring a metrics scope allows a single project to view and query metric data from multiple monitored projects.
- Visualizing Distribution with Heatmaps: Use Create a heatmap widget to display the distribution of latency values over time. Heatmaps visualize the distribution of values across many sources, making it easy to spot outliers without the visual noise of overlapping lines.
- Dashboard-as-Code & Versioning: Use Define the dashboard configuration in a JSON file. Use the Google Cloud CLI or Terraform to create the dashboards in each project. Dashboards are defined in JSON, enabling version control and programmatic deployment via CLI or Terraform.
Key Takeaways (6.2b)
- Projects are the boundary for metrics by default.
- Use Metrics Scopes to view data from multiple projects in a single dashboard.
- Designate a specific project (often called a 'monitoring' or 'scoping' project) to centralize observability.
- Avoid exporting data to BigQuery for real-time dashboarding needs; use native Monitoring features instead.
Consideration 6.2c: Creating alerts with thresholds for specific metrics
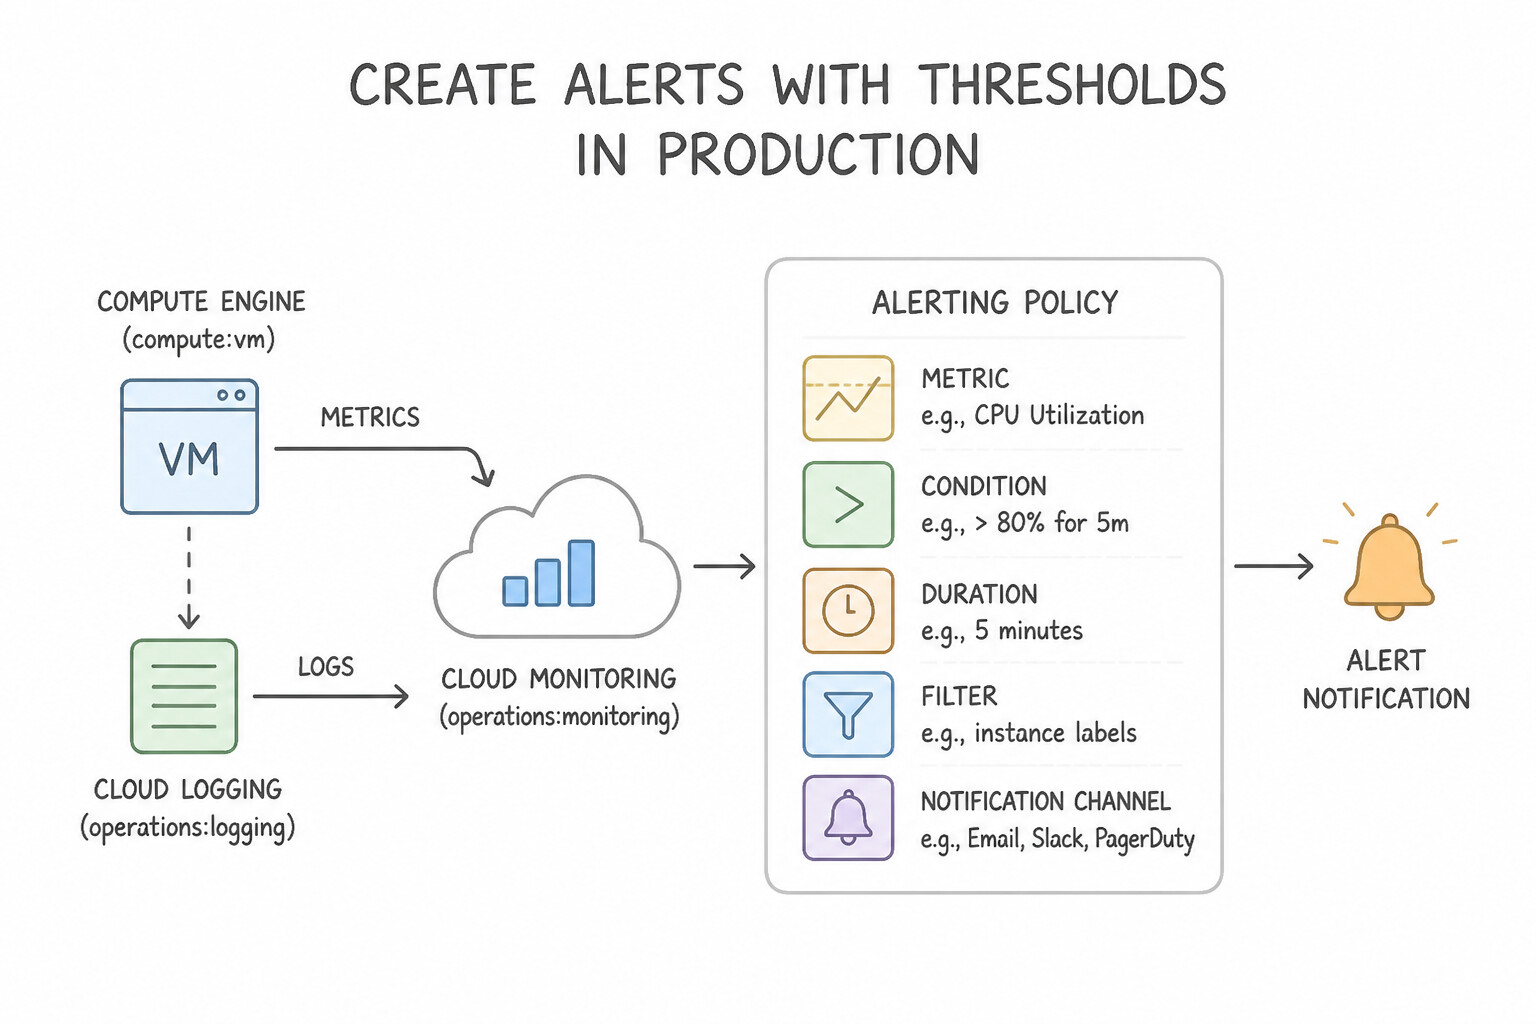
When configuring Cloud Monitoring Alerting Policies on security pipeline metrics:
- Key Alerting Policy Parameters in Production:
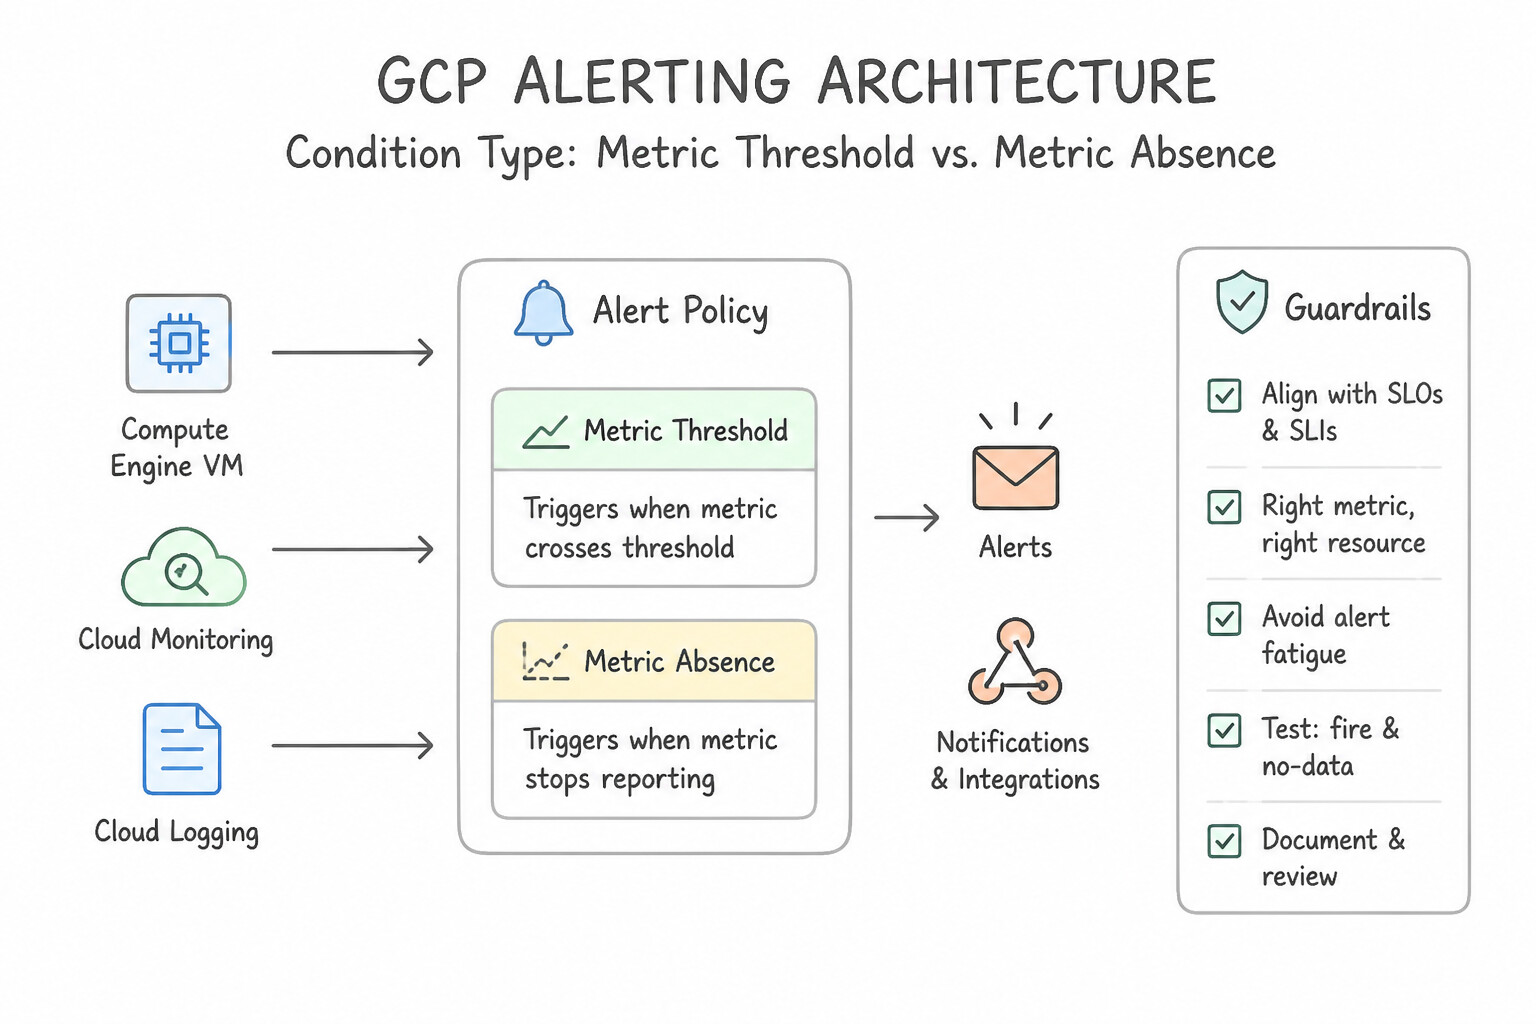
- Condition Type (
Metric Thresholdvs.Metric Absence): - Use Metric Threshold when a value goes too high (e.g.,
failed_parse_count > 100/minorpubsub/num_undelivered_messages > 10,000) or drops below a minimum rate. - Use Metric Absence when a stream stops reporting data points entirely for a specified window.
- Alignment Period & Per-Series Aligner (
rate,delta,mean,sum): Smooths raw data points over a time bucket (e.g., 5 minutes). - Cross-Series Reducer (
GROUP BY log_type/collector_id): Crucial! If you sum ingestion bytes across all log types globally, a dead Active Directory feed (low byte volume) will be masked by noisy VPC Flow Logs (high byte volume). Always group bylog_typeorcollector_idso the threshold is evaluated independently per log source! - Duration (
Retest / Sustained Window, e.g.,for 10 minutes): Specifies how long the metric must continuously violate the threshold before firing an incident—preventing false-positive alert flapping from brief 30-second network blips.
Key Implementation Patterns
- Handling Transient Metric Spikes: Use Create an alerting policy with a threshold of 90%. Set the condition duration to 5 minutes. Setting the condition duration to 5 minutes ensures the alert only fires after the threshold is violated continuously for that period, ignoring short spikes.
- Calculating Error Rates from Logs: Use Create a counter log-based metric that filters for the text "Critical Failure". Create an alert policy based on this metric with a threshold of 10. Counter log-based metrics convert log entries into numeric data points, allowing you to set numeric thresholds for alerting.
- Alerting on Process Termination: Use Create an alert policy using the Metric Absence condition type. Metric Absence conditions trigger when a data stream stops arriving, making them ideal for heartbeat monitoring. (Avoid alternative: Threshold alerts require data points to evaluate; they do not trigger on missing data.)
Key Takeaways (6.2c)
- Alerting policies should be designed to minimize false positives (noise) to prevent alert fatigue.
- The 'Duration' (or retest window) setting in an alert condition ensures that a threshold violation is sustained before notifying humans.
- Transient spikes (like garbage collection) are normal in many systems and should typically be filtered out by duration settings rather than threshold adjustments.
- Logs are text; Alerting Policies usually rely on numeric metrics.
Consideration 6.2d: Configuring notifications using Google Cloud tools (e.g., Cloud Monitoring)
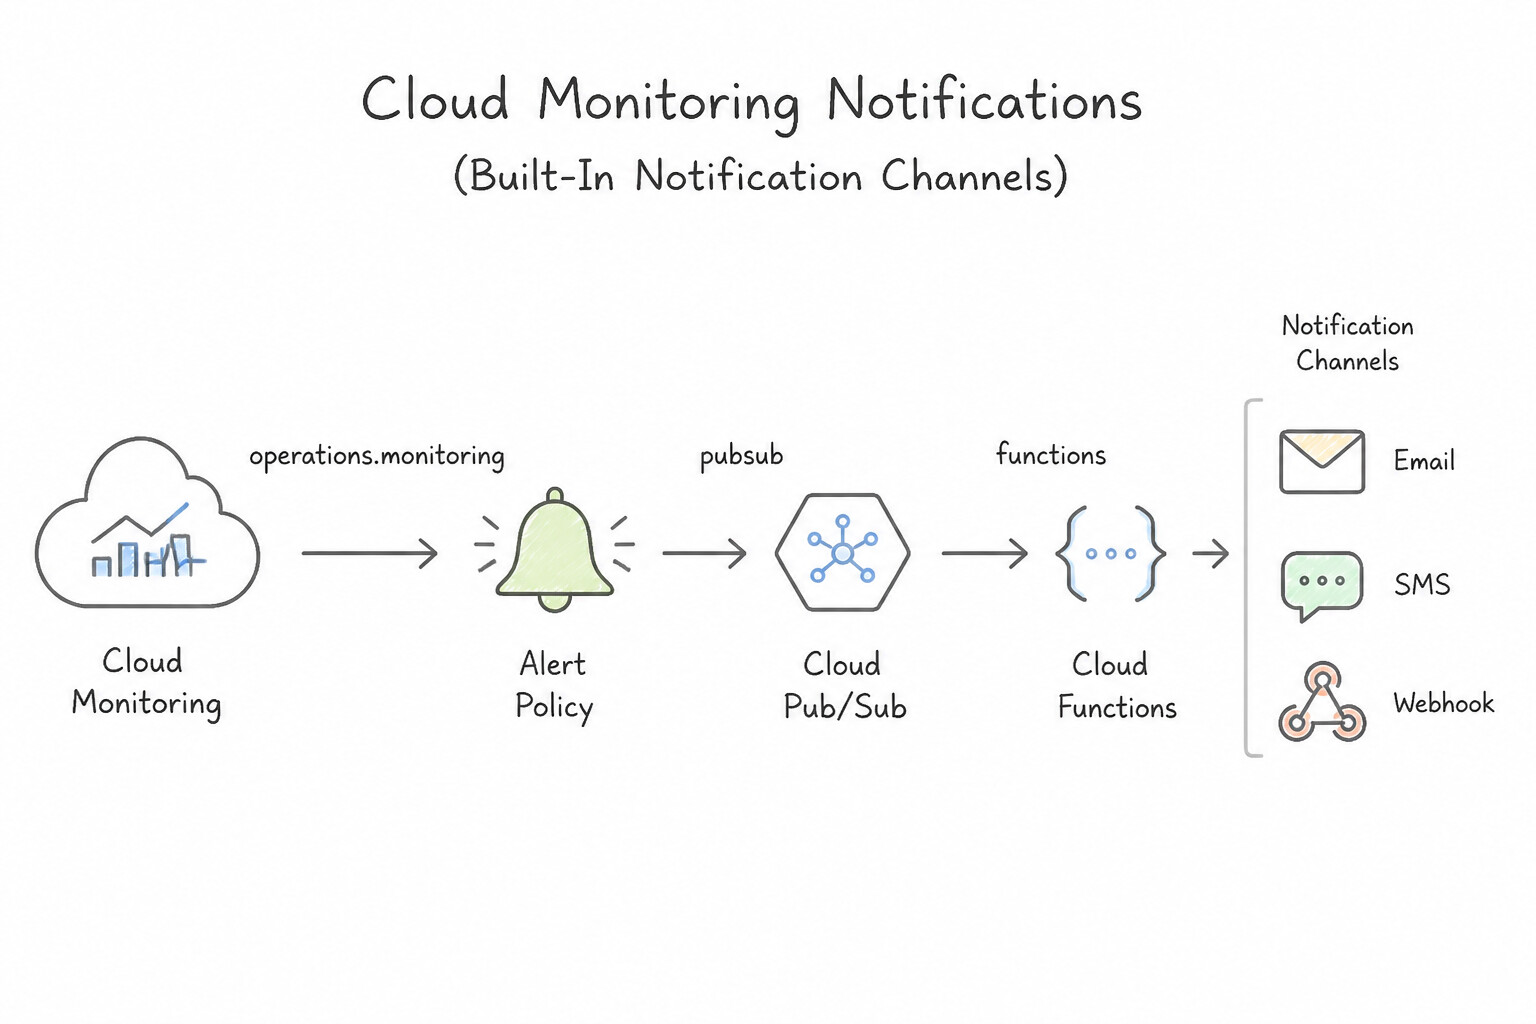
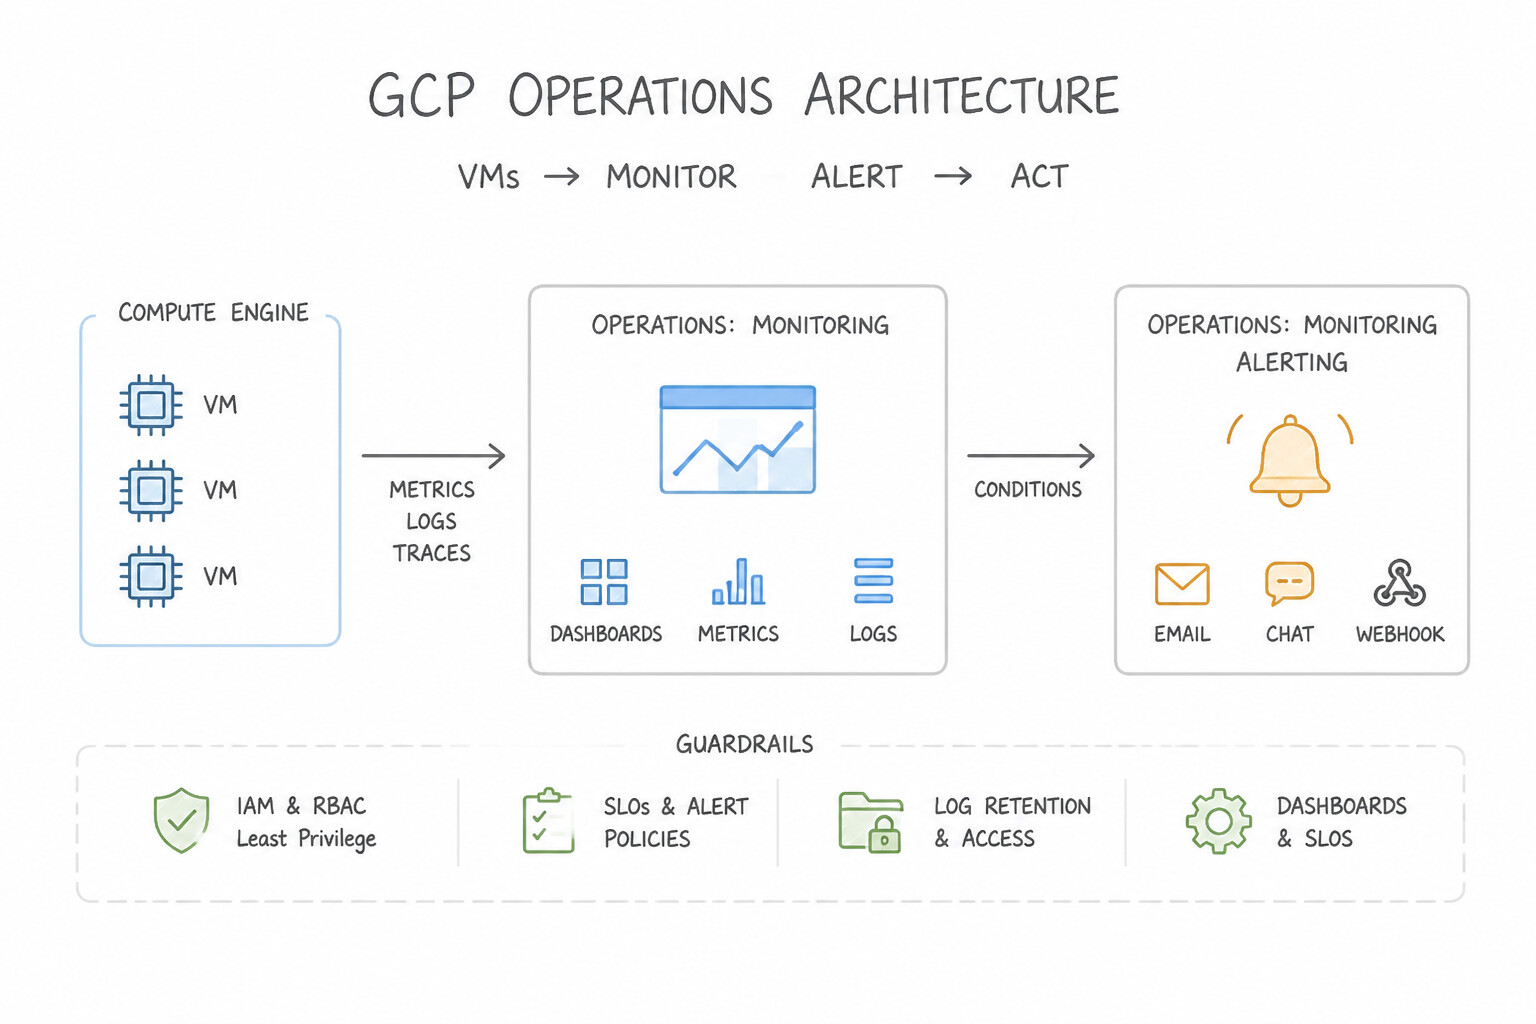
Once a Cloud Monitoring alerting policy fires, Notification Channels deliver the alert to responders:
- Built-In Cloud Monitoring Notification Channels:
Email,SMS,Mobile App,Slack,PagerDuty,Webhooks(HTTPS POST with JSON payload), andCloud Pub/Sub.- Integrating with Legacy / Custom Third-Party Ticketing Systems (
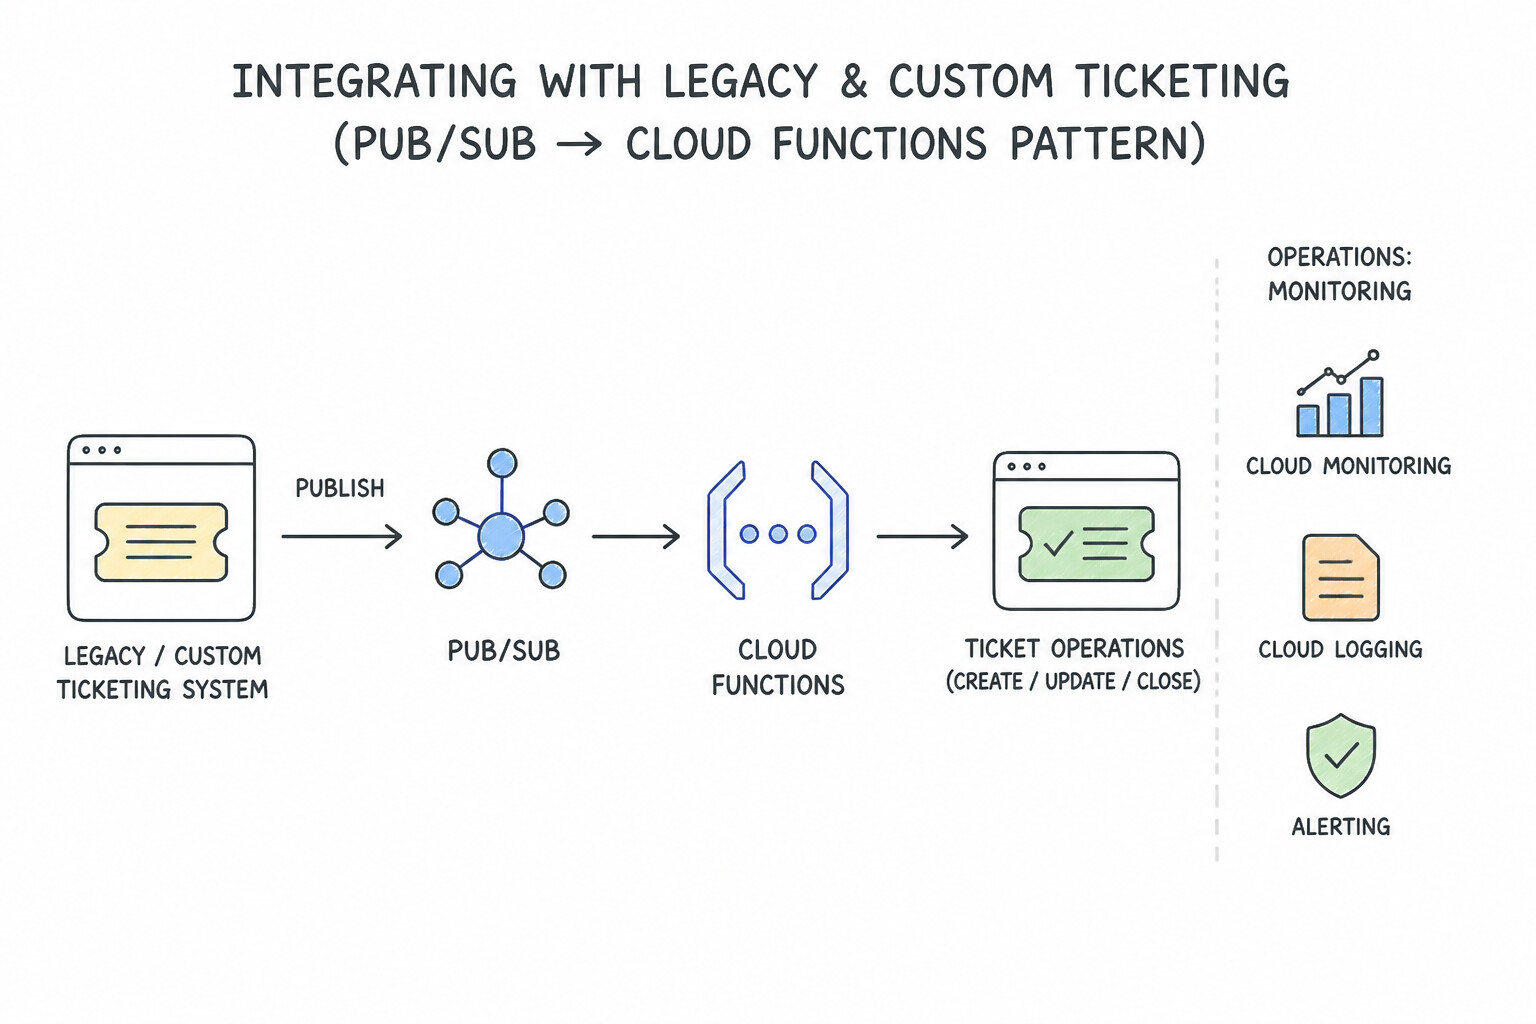
Pub/Sub→Cloud FunctionsPattern): - Production Integration Pattern: What if your enterprise uses an on-premises or legacy ticketing system that requires a custom XML payload, custom SOAP headers, or mTLS authentication that standard Cloud Monitoring Webhooks (which only send fixed JSON schemas) do not support?
- Winning Architecture: Configure the Cloud Monitoring Alerting Policy to publish to a Cloud Pub/Sub Notification Channel, trigger a lightweight Cloud Run function (Cloud Functions) subscribed to that Pub/Sub topic, transform the JSON alert into the required XML/custom schema, and forward it to the legacy ticketing API!
Key Implementation Patterns
- Automating Remediation via Pub/Sub: Use Configure the alert policy to use a Pub/Sub notification channel. Deploy the Cloud Function with a Pub/Sub trigger subscribed to the same topic. The standard pattern for automated remediation is connecting Cloud Monitoring to Cloud Functions via a Pub/Sub notification channel.
- Managing Notification Channels with Terraform: Use Define a
google_monitoring_notification_channelresource withtypeset to "email". Specify the email address within thelabelsblock. Use thegoogle_monitoring_notification_channelresource and provide the email address in thelabelsblock. - Integrating Third-Party Incident Management: Use Create a Notification Channel for PagerDuty. Create separate Alert Policies for Critical and Warning conditions. Assign the PagerDuty channel to the Critical policy and the Email channel to the Warning policy. Notification channels are set at the Alert Policy level. To send alerts to different channels based on severity, you must use separate Alert Policies.
Key Takeaways (6.2d)
- Cloud Monitoring Alert Policies use Notification Channels to communicate incidents.
- Pub/Sub is the primary notification channel for triggering programmatic actions (automation) in Google Cloud.
- Cloud Functions can be triggered directly by Pub/Sub messages.
- Always decouple detection (Monitoring) from remediation (Functions) using a messaging layer like Pub/Sub.
Consideration 6.2e: Identifying health issues using Google Cloud tools (e.g., Cloud Logging)
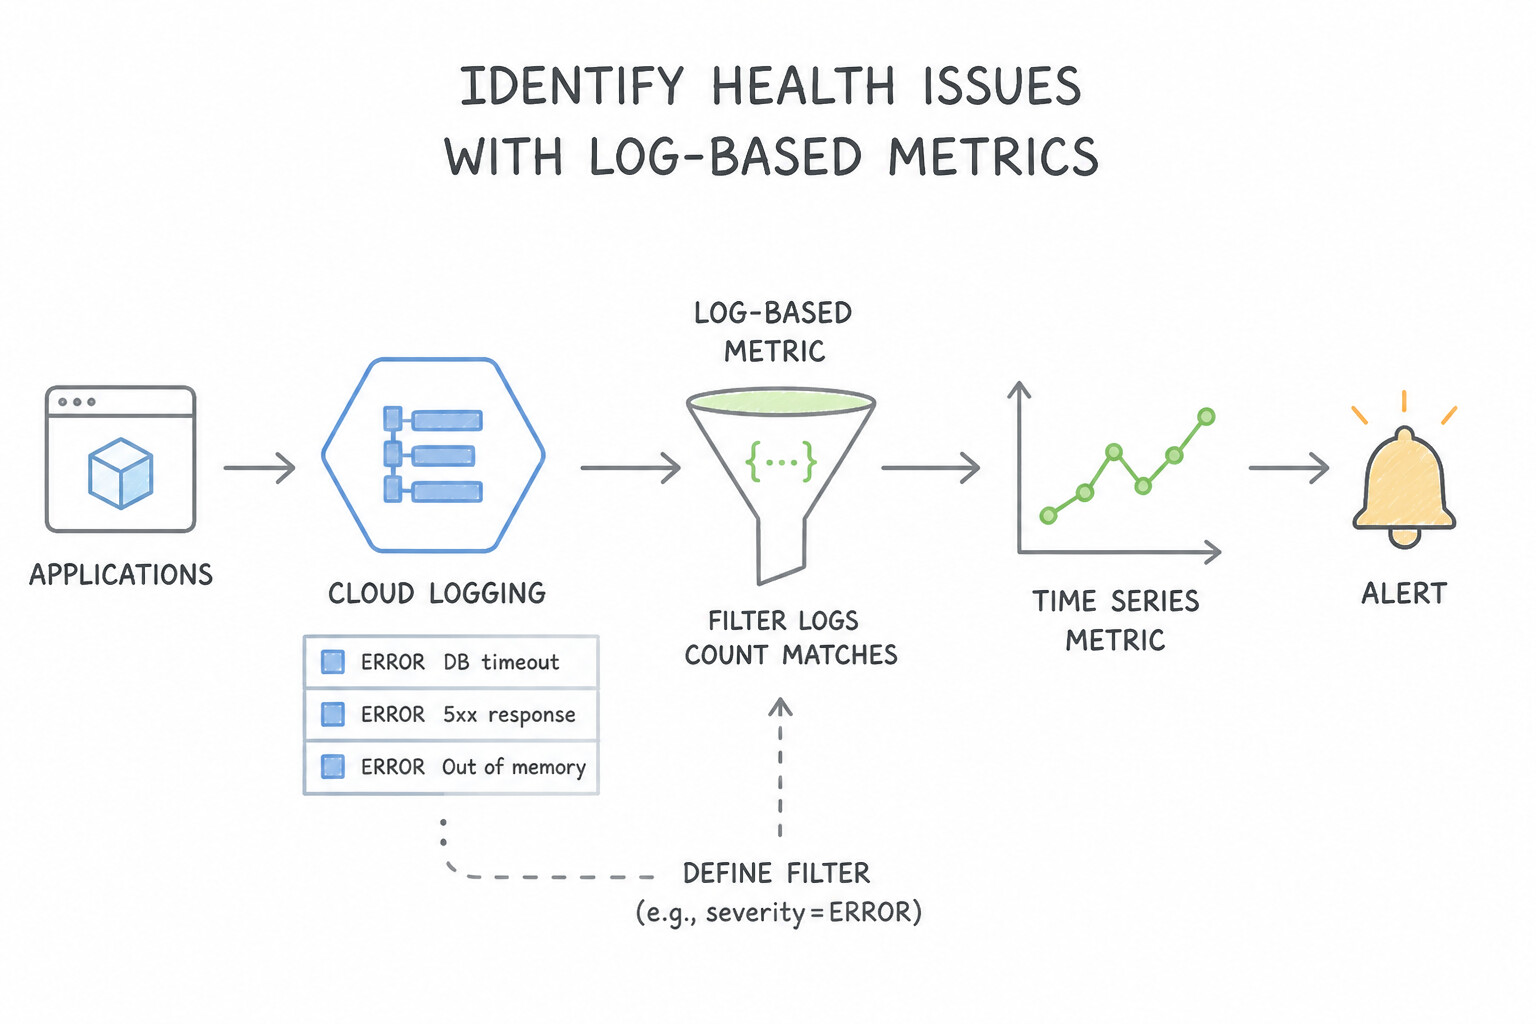
Many pipeline and application health signals exist as text inside logs rather than native numeric time-series metrics:
- Converting Logs into Alertable Metrics (
Log-Based Metrics): - In Cloud Logging, create a Counter Log-Based Metric (counts the number of log entries matching an LQL filter) or a Distribution Log-Based Metric (extracts a numeric latency/size field via regex).
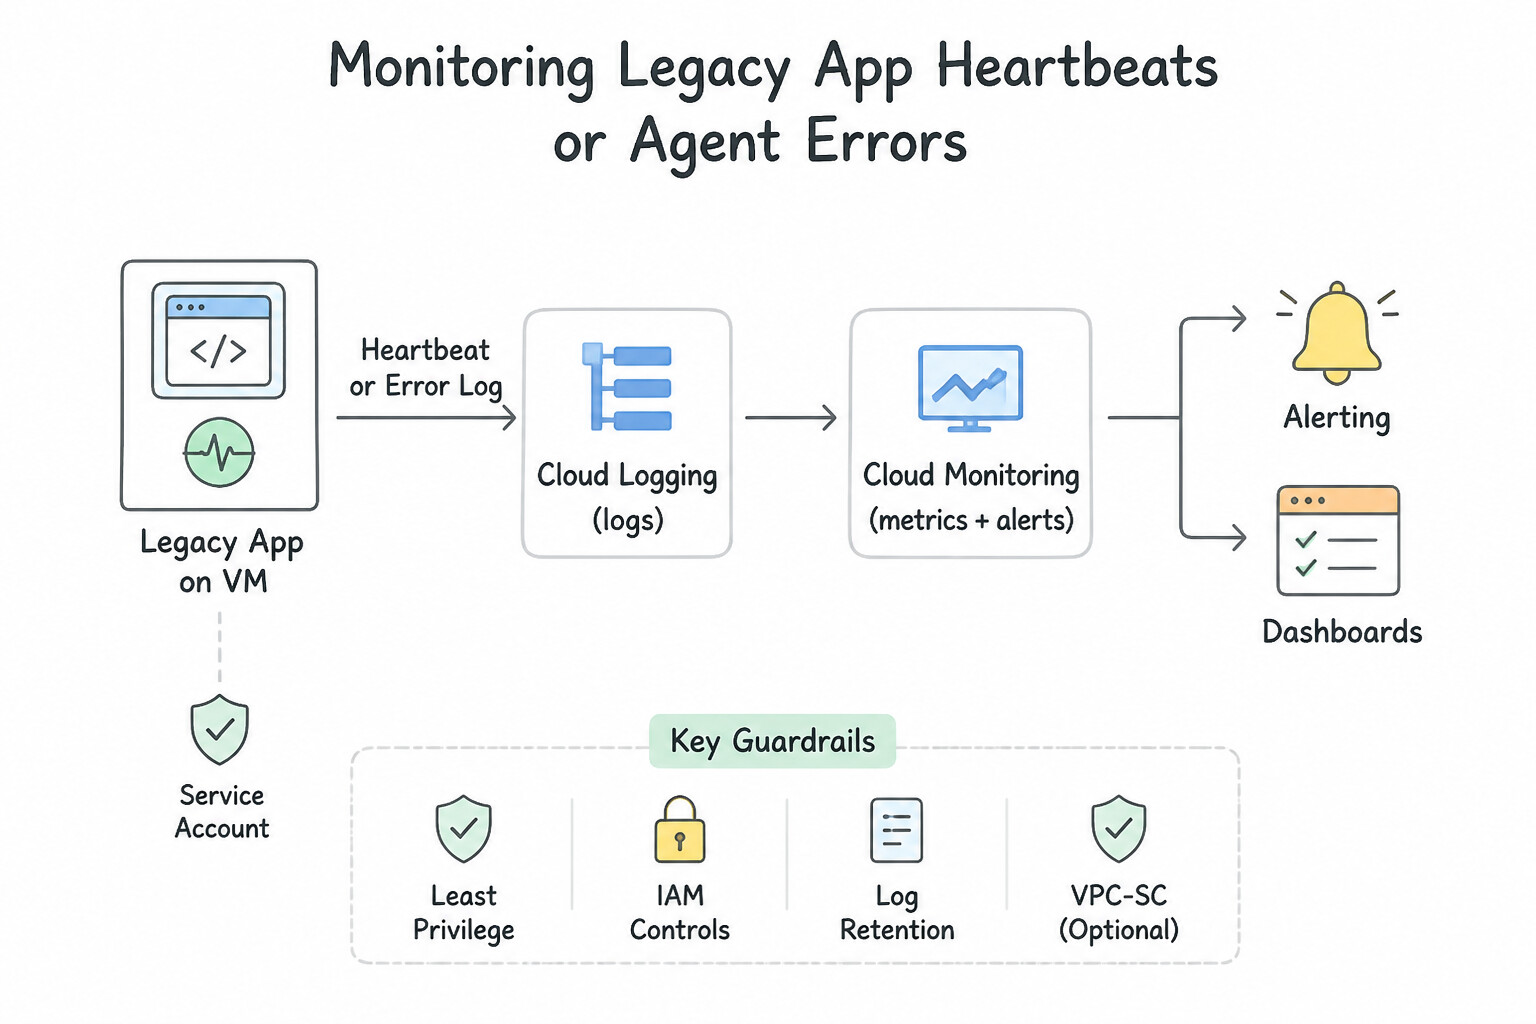
- Example — Monitoring Legacy App Heartbeats or Agent Errors: If a critical legacy security appliance writes a
"HEARTBEAT_OK"entry to Cloud Logging every 60 seconds (or an Ops Agent writes"ERROR: connection refused"), define a Counter Log-Based Metric matching that filter and attach a Cloud Monitoring Alerting Policy to the resultinglogging.googleapis.com/user/<metric_name>time series!
Key Implementation Patterns
- Creating Log-Based Metrics for Legacy Applications: Use Install the Ops Agent on the VM to stream logs to Cloud Logging. Create a user-defined log-based counter metric for the text pattern. Configure an alert policy in Cloud Monitoring. Use the Ops Agent to ingest logs, creating a log-based counter metric to count specific text patterns, and alert on that metric in Cloud Monitoring.
- Debugging Latency in Microservices: Use Use Cloud Trace to analyze the request latency and identify the longest span. Cloud Trace provides distributed tracing and waterfall graphs to identify latency bottlenecks across microservices. (Avoid alternative: Cloud Profiler focuses on resource consumption (CPU/RAM), which is already known to be healthy in this scenario.)
- Filtering Noise to Identify Real Health Issues: Use Create an exclusion filter in the Log Router for the _Default sink to discard the health check logs. Exclusion filters in Log Router prevent specific logs from being stored, reducing noise. (Avoid alternative: Changing application code is inefficient and risky for infrastructure logging needs.)
Key Takeaways (6.2e)
- Log-based Metrics bridge the gap between logs (text) and monitoring (numbers).
- Use the Ops Agent to get application logs from a VM into Cloud Logging.
- Avoid modifying legacy code or writing custom scripts if a managed Google Cloud service can perform the task.
- Cloud Trace is the primary tool for analyzing latency and visualizing request flows (waterfall graphs) in distributed systems.
Consideration 6.2f: Configuring silent source detection
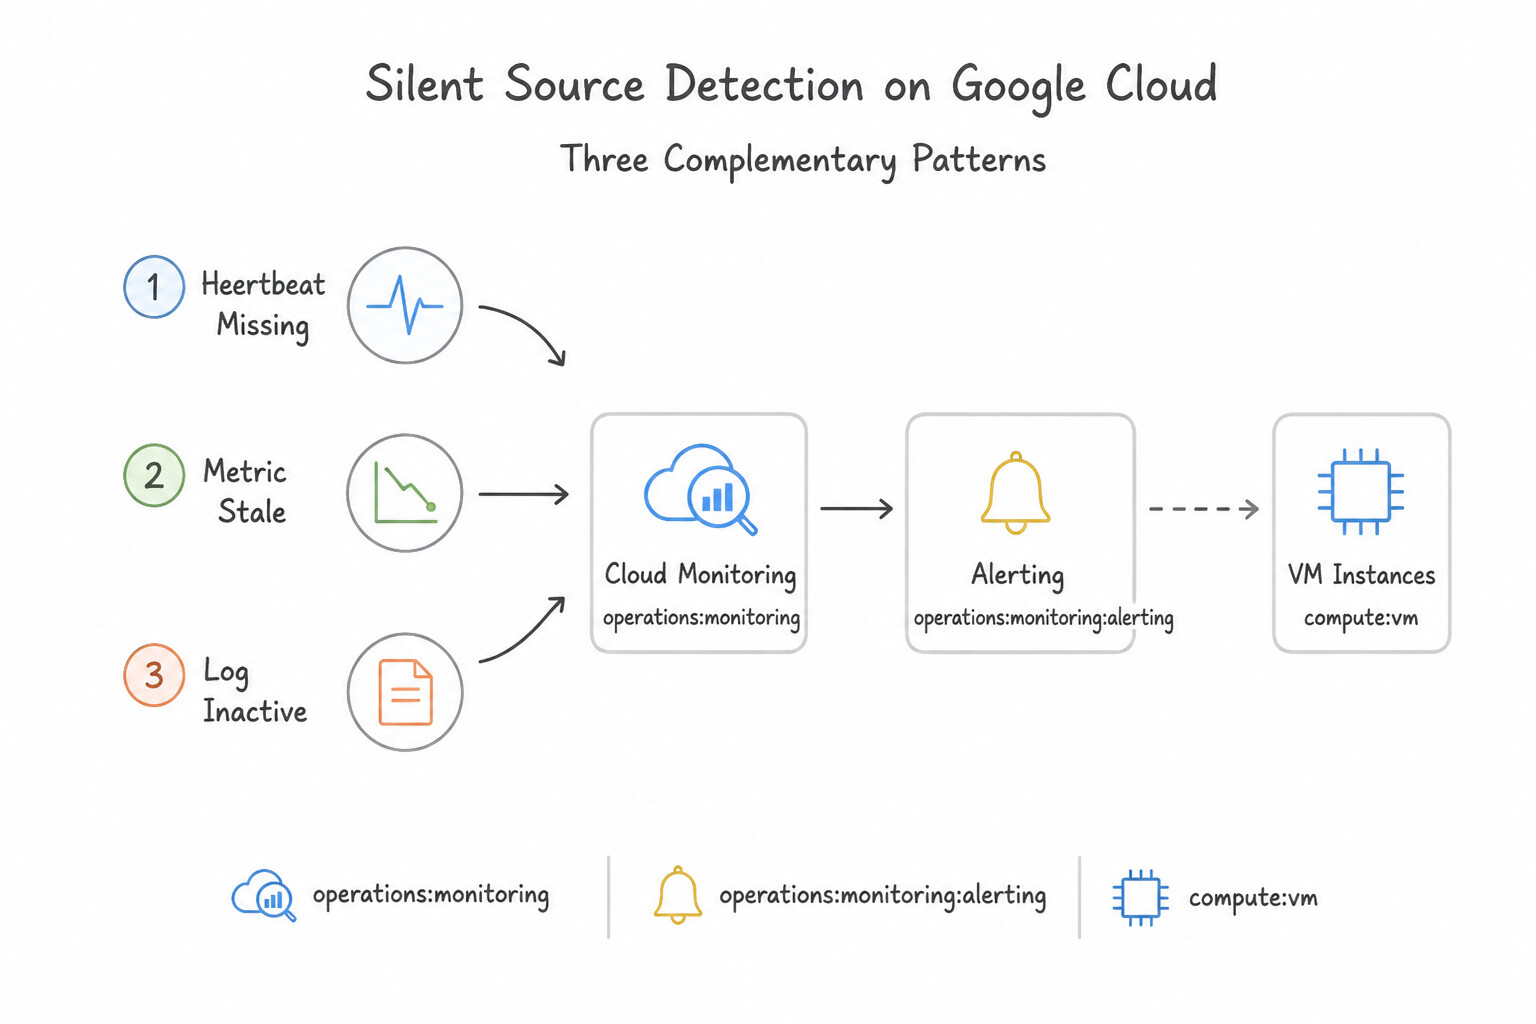
Silent Source Detection ensures you are alerted whenever a log source, forwarder, or agent unexpectedly goes dark:
- Three Complementary Silent Source Detection Patterns on Google Cloud:
- Cloud Monitoring
Metric AbsenceCondition on SecOps Ingestion Metrics: - Create an Alerting Policy on
chronicle.googleapis.com/ingestion/input_record_count(orinput_bytes), grouped bycollector_idandlog_type, using a Metric Absence condition (oris below threshold 1) for a duration of15to30minutes. - Log-Based Metric + Absence Alert for Custom Heartbeats:
- When monitoring a specific VM or application that emits periodic heartbeat logs to Cloud Logging, create a Log-Based Metric filtering for the heartbeat log line, and configure a Cloud Monitoring Alerting Policy with a Metric Absence condition (or threshold
< 1over the expected interval) so an alert fires when the heartbeat stops appearing! - SecOps Native Forwarder / Collector Silence Monitoring:
- Configure collector health alerts in Google SecOps (or trigger a SOAR playbook via Cloud Monitoring webhook) so silent forwarders automatically open an operational case assigned to the SecOps platform engineering team.
Key Implementation Patterns
- Ops Agent Heartbeat Failure: Use Create an alerting policy with a Metric absence condition for the CPU utilization metric. Metric absence conditions trigger when data stops arriving, which indicates the agent or instance is down. (Avoid alternative: Threshold alerts require data to evaluate; they cannot detect when the data stream itself stops.)
- Differentiating Zero vs. Null: Use Create an alert policy with a Metric Absence condition configured for the metric. Metric Absence alerts when data stops arriving, distinguishing a crash from a valid zero value. (Avoid alternative: A threshold of 0 alerts on valid data (zero users), not on the absence of data (application crash).)
- Handling Sparse Data Streams: Use Increase the alert condition duration to 45 minutes. The duration window must be longer than the reporting frequency of the metric. (Avoid alternative: Alignment period adjusts data granularity, not the evaluation window for absence.)
Key Takeaways (6.2f)
- Metric Absence vs. Threshold: Use Thresholds for performance issues (high load). Use Absence conditions for availability issues (system down).
- Agent Reliability: Never rely on a failing component to report its own failure (e.g., log-based alerts for agent crashes).
- Liveness Checks: Monitoring the 'heartbeat' or continuous flow of metrics is crucial for detecting infrastructure outages.
- Zero vs. Null: In monitoring, a value of 0 is data; a lack of data is an absence. They require different alert types.
Quick Decision Cheat Sheet (Subsection 6.2)
If the Scenario Requires... | Choose This Google Cloud Pattern | Avoid This Common Mistake |
|---|---|---|
"Alert the SOC when a critical log source or SecOps Forwarder stops sending logs (Silent Source Detection)" | Use Cloud Monitoring Metric Absence alerting on chronicle.googleapis.com/ingestion/... (grouped by collector_id / log_type) | Writing a YARA-L rule with #e = 0 (YARA-L requires at least one positive event variable in condition:) |
"Alert when a specific text pattern ( HEARTBEAT) stops appearing in Cloud Logging" | Create a Cloud Logging Log-Based Metric + Cloud Monitoring Metric-Absence / low-threshold Alerting Policy | Exporting logs to Coldline Storage or checking VM CPU utilization |
"Bridge Cloud Monitoring JSON alerts to a third-party/legacy system requiring custom XML or payload transformation" | Cloud Monitoring → Pub/Sub Notification Channel → Cloud Functions / Cloud Run → Target API | Pointing a standard Webhook Notification Channel directly at an XML-only endpoint |
"Prevent brief 20-second metric spikes from paging on-call engineers with flapping false alarms" | Increase the Alerting Policy duration (sustained violation window) parameter (e.g., for 5 or 10 minutes) | Deleting the alerting policy or disabling the notification channel |
"Vendor firmware update changed log formatting; detect resulting ingestion parsing failures immediately" | Alert on spikes in chronicle.googleapis.com/ingestion/failed_parse_count / validation_error_count | Waiting until analysts notice zero detections fired over the past month |
Further Reading (Subsection 6.2)
- Google SRE Book - Chapter 6 - Monitoring Distributed Systems — Refer to the section on 'The Four Golden Signals' and the specific discussion on why 'Average' implies a normal distribution which is rarely the case for latency.
- GKE system metrics — Lists available GKE metrics in Cloud Monitoring, including kubernetes.io/container/restart_count.
- Troubleshooting GKE Applications — Explains the CrashLoopBackOff error and how to identify it using logs and status checks.
- Monitoring Pub/Sub — Refer to the section on 'Monitor message backlog' to understand how
oldest_unacked_message_ageis used to detect stuck consumers or insufficient processing capacity. - Metrics scopes overview — This page explains how to configure a metrics scope to view metrics from multiple projects in a single interface.
- Explore charted data — Refer to the section on 'Heatmap' to understand how it displays the distribution of values over time using color intensity.
Book TOC · Previous · Chapter 6 of 7 · Next
AwesomeGCP.com Learning
The approach taken is a question-led learning approach: you explore realistic project scenarios where you need to make decisions or take actions to achieve business goals within specific constraints. Instead of passive learning, you are challenged to think and work through the options to master the Professional Security Operations Engineer (PSOE) certification!