Book TOC · Previous · Chapter 2 of 7 · Next
Chapter 2: Data Management: Log Ingestion, Bindplane, Custom Parsers, UDM & Entity Graph Context
Chapter Focus: Cloud-to-Cloud API feeds vs. Bindplane Agent vs. Forwarders, CBN Grok/Lua custom parser extensions, Unified Data Model (UDM) normalization, log exclusion cost controls, and Entity Graph aliasing (
USER/ASSET).
Subsection 2.1: Ingesting Logs for Security Tooling
The Big Picture
A SIEM is only as smart as the fidelity of its normalized data. In Google Security Operations (SecOps), raw telemetry from hundreds of heterogeneous sources—Google Cloud Audit Logs, AWS CloudTrail, Palo Alto Networks firewalls, CrowdStrike EDR, Windows Event Logs, and custom legacy applications—must be continuously collected, tagged with an Ingestion Label (log_type), parsed into the Unified Data Model (UDM), and stored cost-effectively. Naive data management architectures fail in three classic ways:
- The "Dropped Unmapped Field" & Broken Default Parser Trap (
2.1d,2.1e,2.1f): When an organization configures a firewall or VPN concentrator to emit custom vendor fields (e.g.,x_corp_employee_badge_idor a custom timestamp format), the Google-managed default parser normalizes standard fields (principal.ip,target.ip) but ignores the custom field. Naive engineers either copy-paste the entire 3,000-line Google default parser into a custom parser (immediately losing all future Google parser updates and bug fixes!) or leave the field unparsed so YARA-L rules cannot query it. The production-grade solution is a Parser Extension (using no-code field extraction for JSON/XML/KV logs or a modular Config-Based Normalization [CBN] code snippet withgrok,kv,json,date, andmutate/mergefilters) that runs alongside the managed default parser. - The Ingestion Sprawl & Runaway Billing Trap (
2.1a,2.1c,2.1h): Teams turn onData Accesslogs andVPC Flow Logsat 100% sampling across development sandboxes, load-balancer health-check probes, and internal batch jobs, flooding Cloud Logging and SecOps with terabytes of zero-value noise. Production engineers enforce tiered cost controls: dropping health-check noise at the Cloud Logging Log Router (Exclusion Filters) or SecOps Ingestion Filters, tuning VPC Flow Log sampling, usingexemptedMembersfor noisy trusted service accounts, and routing cold compliance logs to Cloud Storage while streaming high-signal telemetry directly into Google SecOps. - The Misconfigured Ingestion Label & Overlapping IP Collision Trap (
2.1b,2.1g): If an on-premises SecOps Forwarder tags Palo Alto firewall syslogs with the wronglog_typelabel (or omits thenamespacelabel across two acquired subsidiaries that both use10.0.0.0/8), either the wrong parser runs (resulting in 100% unparsed raw logs) or Entity Graph IP aliasing collides between the two networks.
Consideration 2.1a: Determining approaches for data ingestion within security tools (e.g., SCC, Google SecOps)
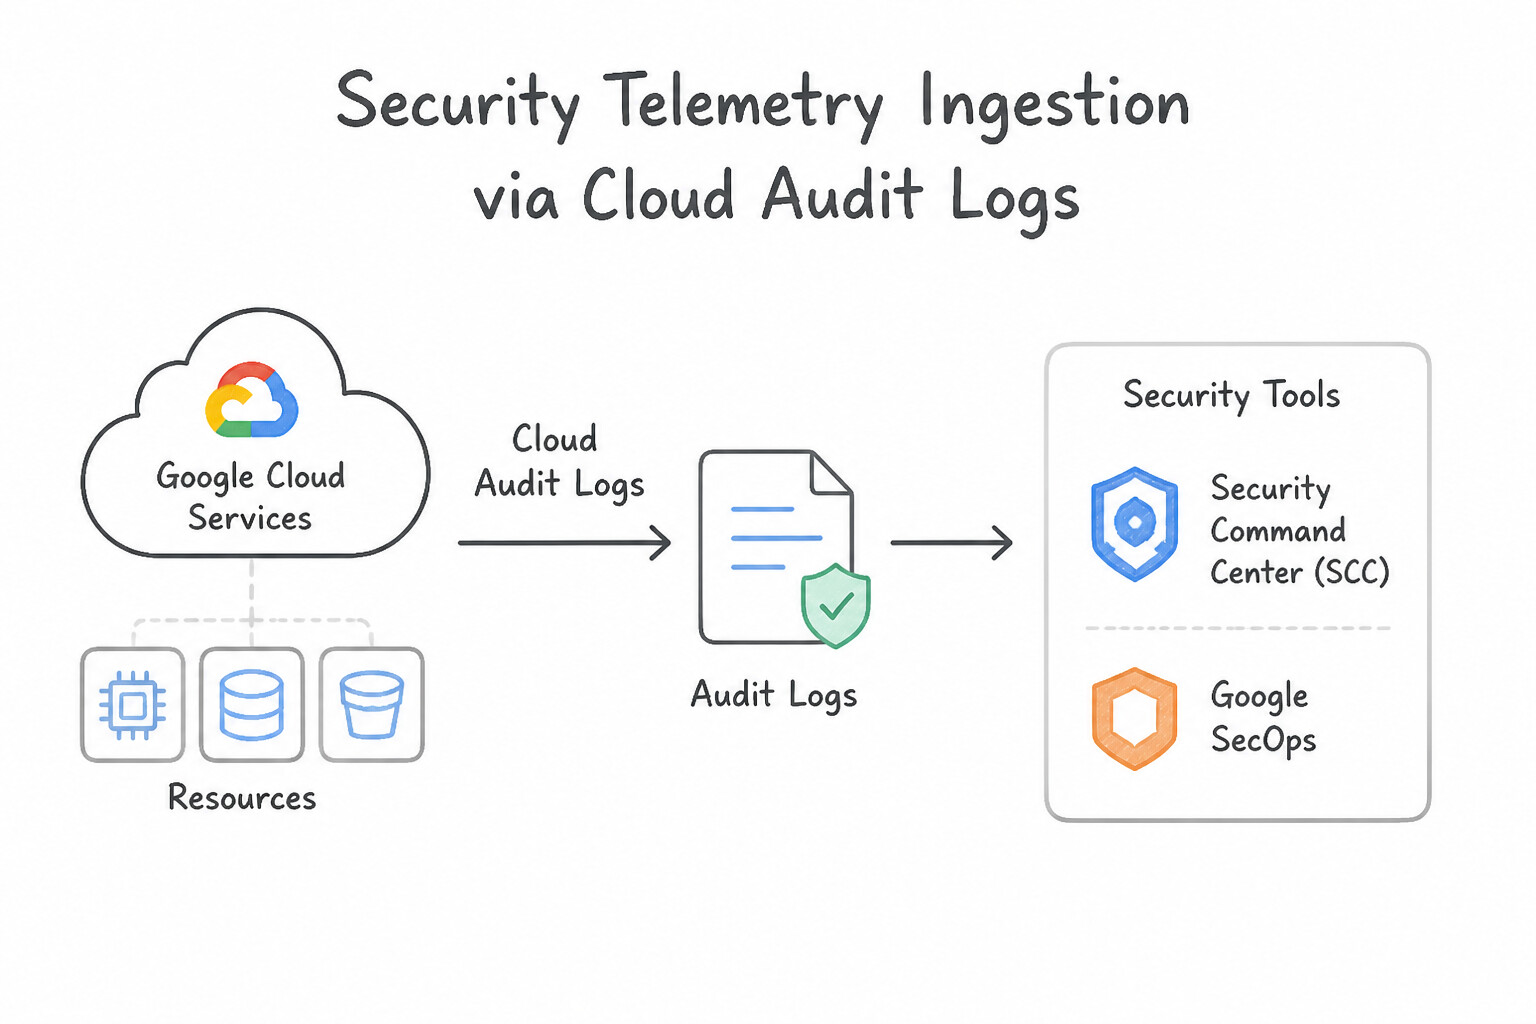
Match the telemetry origin to the optimal Google SecOps ingestion mechanism:
- 1. Google Cloud Native Telemetry (
Cloud Audit Logs,VPC Flow Logs,Cloud DNS,GKE,SCC): - Use the Direct Google Cloud-to-SecOps Ingestion Integration (enabled at the Organization level) or an Organization-level Cloud Logging Log Router Sink (
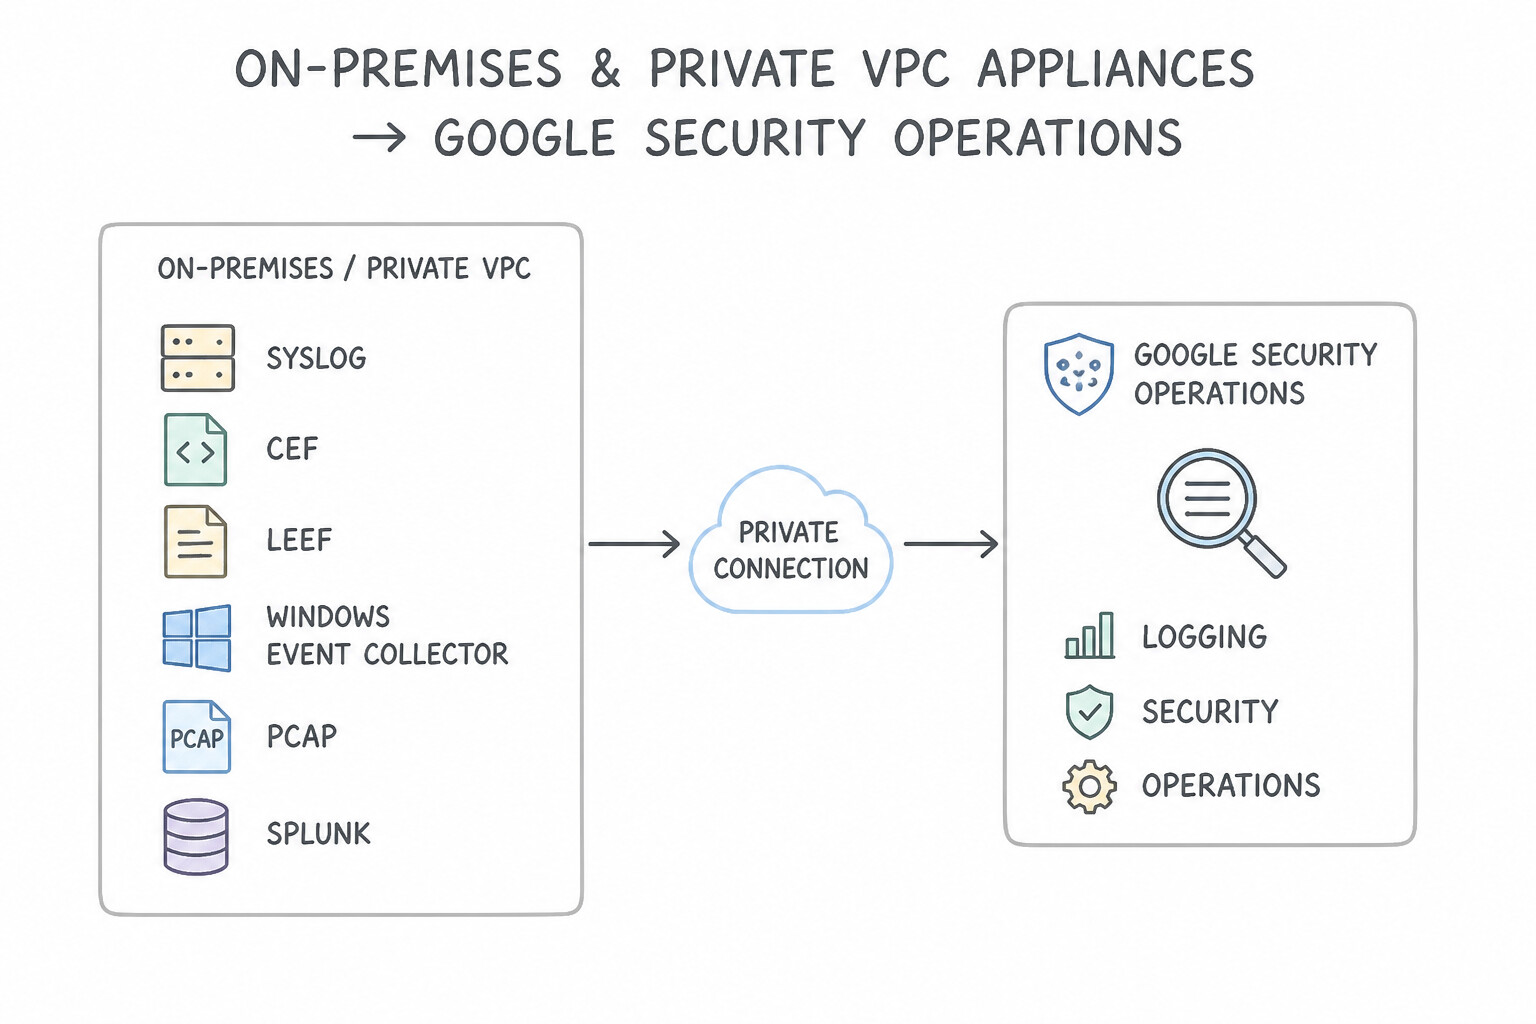
--include-children). Never deploy a VM-based forwarder just to read native Google Cloud logs! - 2. On-Premises & Private VPC Appliances (
Syslog,CEF,LEEF,Windows Event Collector,PCAP,Splunk): - Deploy the Google SecOps Forwarder (lightweight Docker container or binary on Linux/Windows) or Bindplane Agent. It listens locally on TCP/UDP Syslog ports, compresses and buffers logs on disk during WAN outages, and streams them over outbound HTTPS/TLS to SecOps.
- 3. Multi-Cloud & SaaS Platforms (
AWS CloudTrail via S3/SQS,Microsoft O365,Okta,CrowdStrike Falcon,Box): - Configure Google SecOps Feed Management (built-in cloud-to-cloud pull/webhook connectors inside SecOps Settings → Feeds) to pull directly from S3 buckets, Azure Blob Storage, or SaaS REST APIs without managing intermediate infrastructure.
- 4. Custom Serverless or Proprietary Apps (
Cloud Functions/Cloud Run): - Push JSON/raw batches directly to the Google SecOps Ingestion API (
chronicle.googleapis.com) or emit structured logs to Cloud Logging and route them via Log Router.
Key Implementation Patterns
- Centralizing Organization-Wide Audit Logs: Use Create an aggregated log sink at the Organization level that filters for audit logs and exports them to a Pub/Sub topic. Aggregated log sinks at the Organization level automatically inherit logs from all current and future child projects.
- PII Redaction Before Ingestion: Use Create a Cloud Logging sink to export logs to a Pub/Sub topic. specific Create a Dataflow job to read from the topic, mask the PII fields, and forward the results to Google SecOps. Cloud Logging sinks cannot modify data; use Pub/Sub and Dataflow to mask PII before final ingestion.
- Ingesting On-Premises Firewall Logs: Use Deploy the Google SecOps Forwarder on the intermediary server and configure the firewalls to send Syslog data to it. The Google SecOps Forwarder collects Syslog data on the intermediary server and forwards it securely to the cloud.
Key Takeaways (2.1a)
- Aggregated log sinks allow centralized log routing for an entire Organization or Folder.
- Using aggregated sinks ensures new projects are automatically monitored without manual setup.
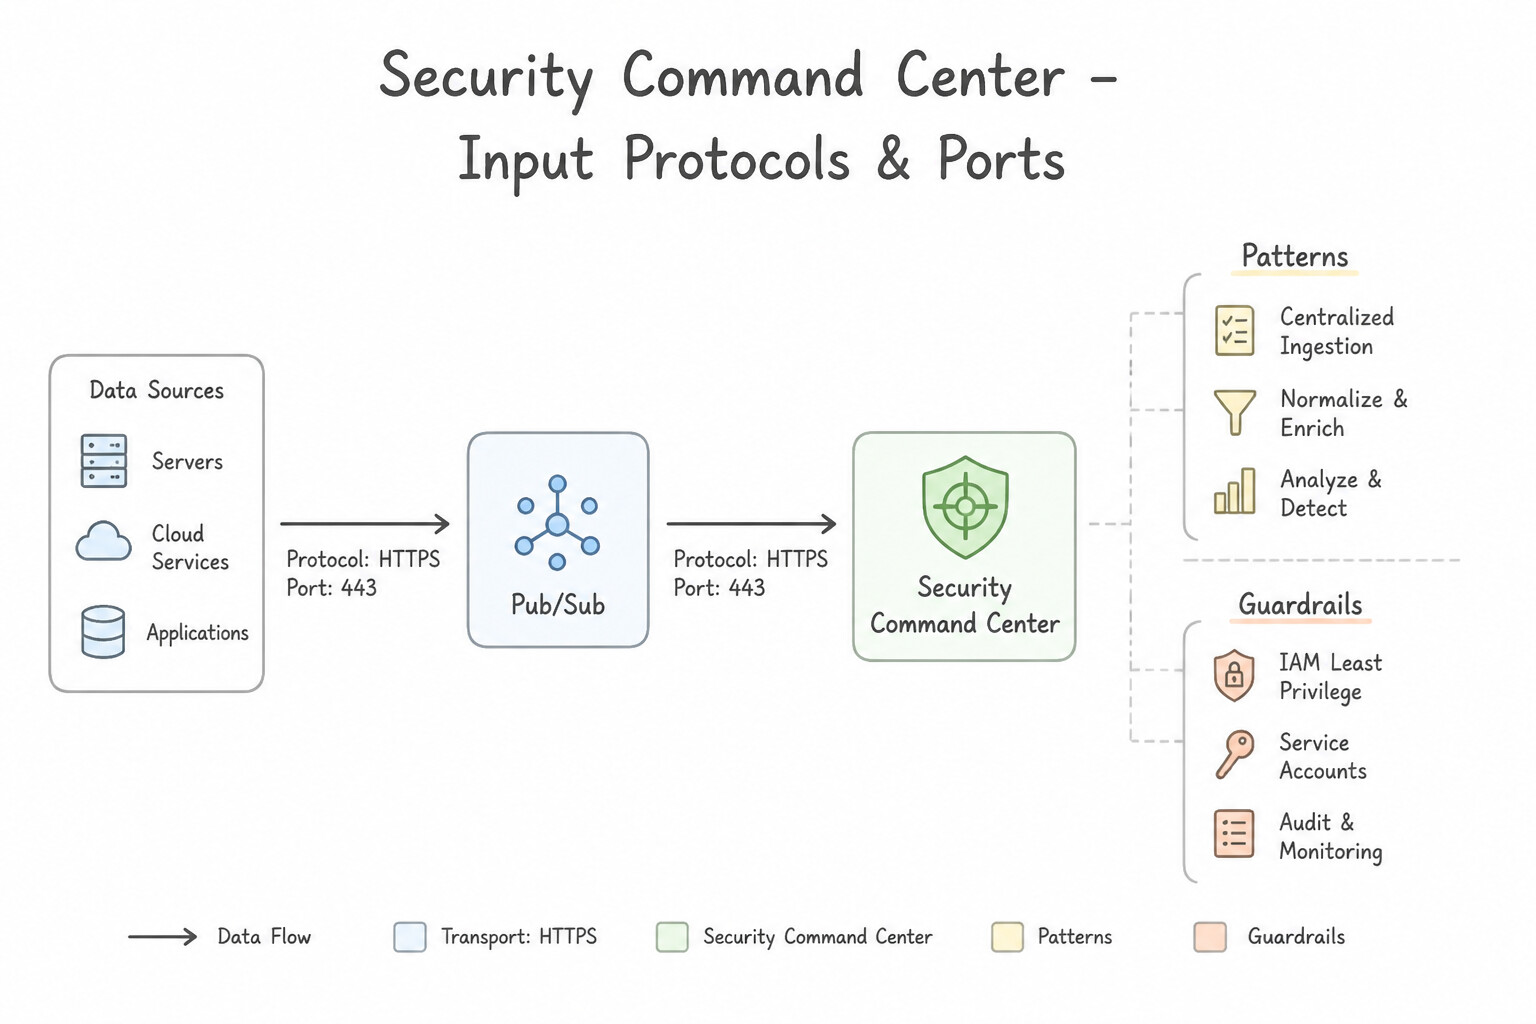
- Pub/Sub is a common intermediate transport layer for ingesting logs into security tools like Google Security Operations.
- Cloud Logging sinks export data as-is; they cannot modify or redact payload content.
Consideration 2.1b: Configuring an ingestion tool or features within security tools (e.g., SCC, Google SecOps)
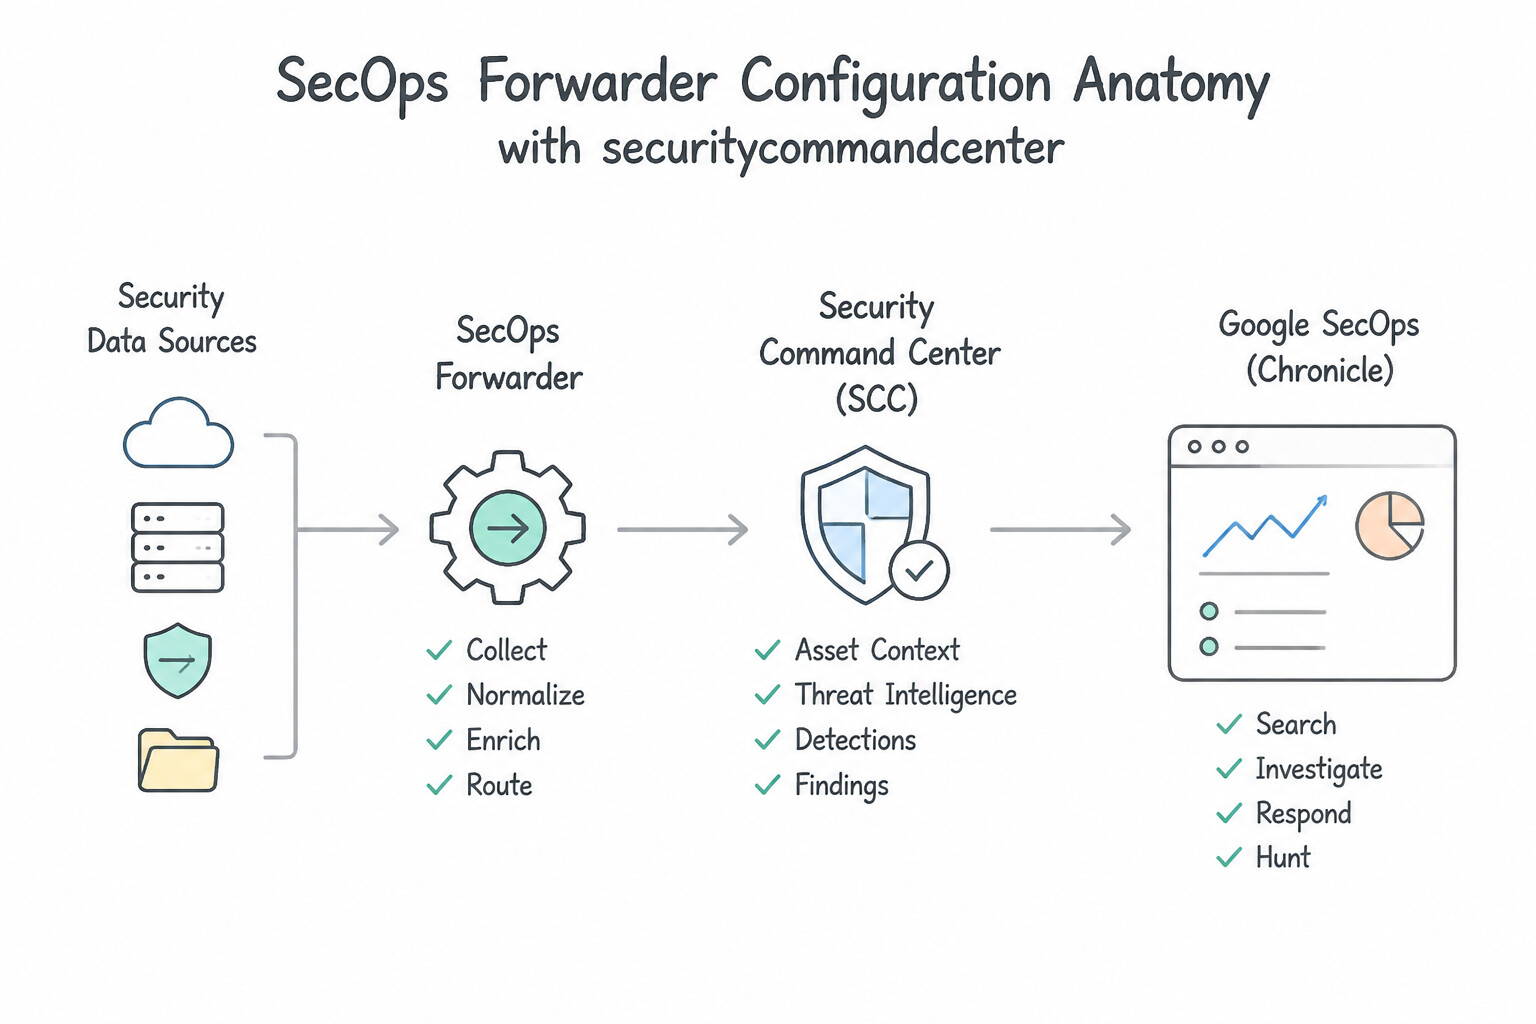
When configuring the Google SecOps Forwarder (collector.conf or UI-managed forwarder configuration) and SCC / Cloud Logging pipelines:
- SecOps Forwarder Configuration Anatomy:
- Every collector block in a forwarder configuration requires:
- Input protocol & port (e.g.,
syslogovertcp_address: "0.0.0.0:10514"orudp_address). - Mandatory
log_type(Ingestion Label): The exact string identifier (e.g.,PAN_FIREWALL,WINDOWS_AD,LINUX_SYSLOG) that tells SecOps which parser to invoke. - Optional
namespace&ingestion_labels: Attaches static asset namespace (e.g.,corp-us-east) and key-value metadata to every event ingested through that collector port. - Disk Buffering (
max_file_buffer_bytes/write_to_disk_buffer_enabled): Prevents data loss if internet connectivity between the on-premises data center and Google Cloud temporarily drops. - Organization-Level Log Router Sink Configuration:
- When configuring an aggregated sink at the GCP Organization node, you must pass
--include-childrenso logs from all child folders and projects flow into the sink, and grant the sink's unique Writer Identity Service Account (serviceAccount:o123456-...@gcp-sa-logging.iam.gserviceaccount.com) permission on the destination (roles/pubsub.publisherorroles/bigquery.dataEditor).
Key Implementation Patterns
- Real-time SIEM Integration via SCC: Use Configure a Notification Config in SCC to send findings to a Pub/Sub topic, and configure your SIEM to subscribe to that topic. Notification Configs combined with Pub/Sub are the standard mechanism for real-time finding exports. (Avoid alternative: Scheduled scripts are batch processes and do not meet real-time requirements.)
- Filtering Noise in SCC Findings: Use Configure a mute rule in Security Command Center that targets the specific development resources. Mute rules selectively hide findings that matched specific criteria without disabling the scanner. (Avoid alternative: Disabling the detector globally stops all alerts, including valid threats in production.)
- Ingesting On-Premises Logs to Google SecOps: Use Deploy the Google SecOps Forwarder on a Compute Engine virtual machine (VM). Configure the on-premises systems to send syslog data to the VM's internal IP address. The Google SecOps Forwarder collects syslog data and acts as a bridge, allowing devices on a private network to send logs to Google SecOps.
Key Takeaways (2.1b)
- Real-time needs Pub/Sub: If a scenario asks for real-time data streaming or event-driven integration, Pub/Sub is usually the correct component.
- Notification Configs: Use SCC Notification Configs to filter and route findings automatically.
- Avoid Storage for Streaming: Cloud Storage is for batch/archive, not low-latency streaming.
- Mute Rules allow you to suppress specific findings based on criteria like resource tags or project IDs without disabling the detector globally.
Consideration 2.1c: Assessing required logs for detection and response, including automated sources, within security tools (e.g., SCC Event Threat Detection, Google SecOps)
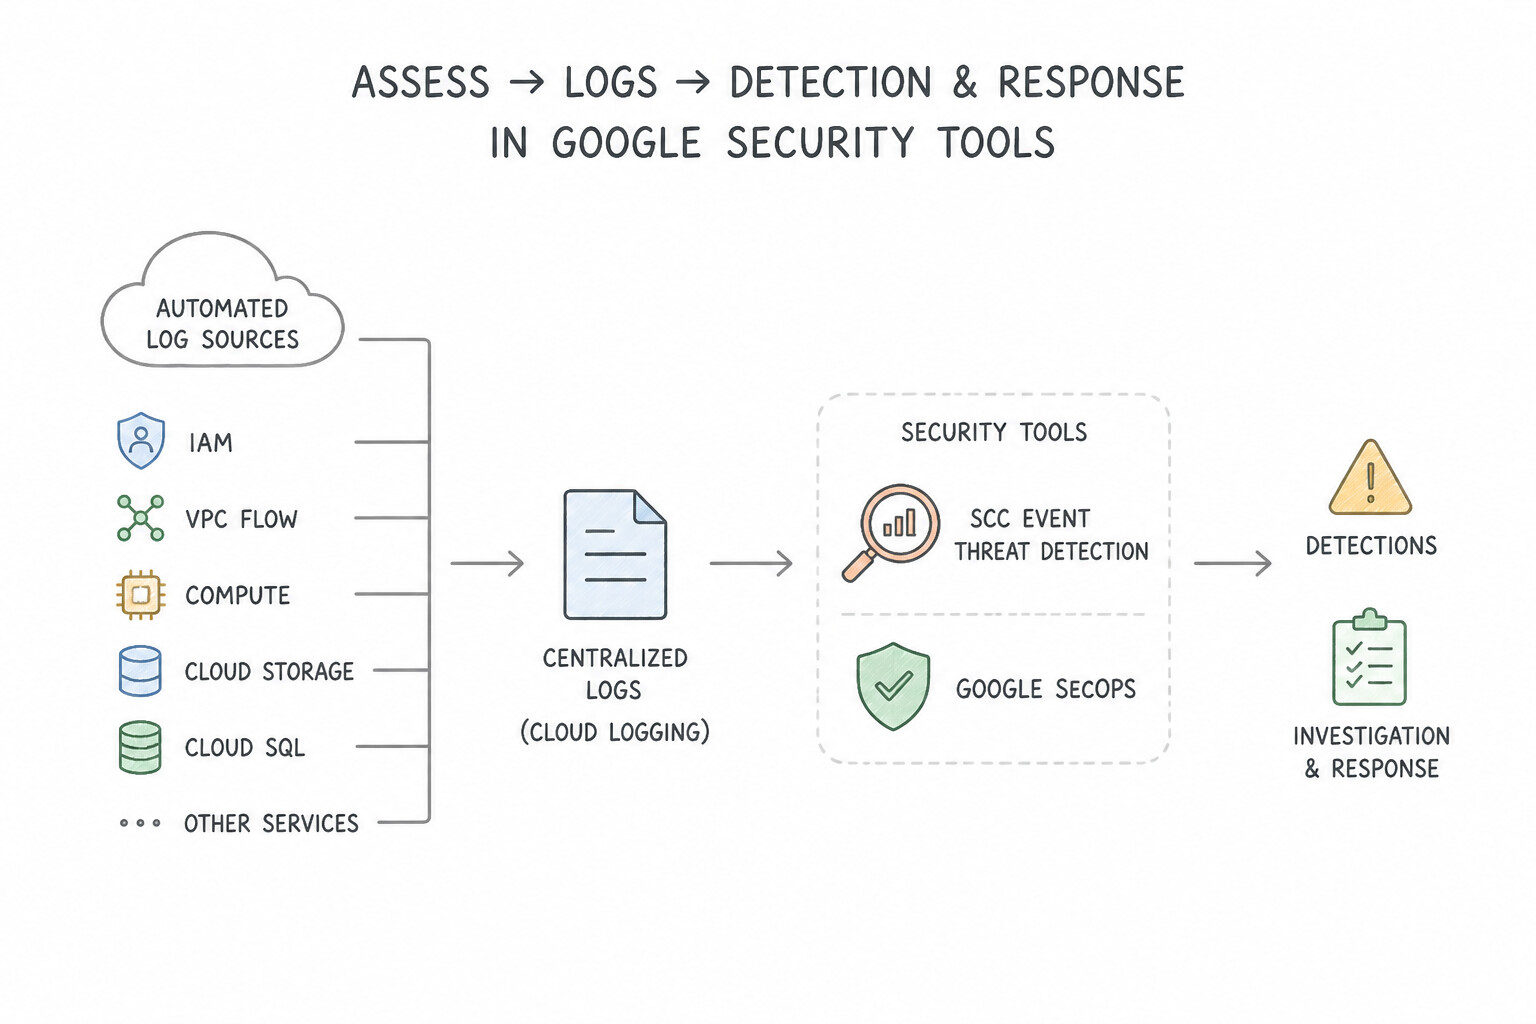
Understand what security tools ingest automatically versus what requires explicit activation:
- SCC Event Threat Detection (
ETD) Automated Log Scanning: - Once SCC Premium/Enterprise is enabled at the Organization level,
ETDautomatically consumes Cloud Audit Logs (Admin Activity,System Event,Data Accessif enabled),GKE Audit Logs,Cloud DNS Logs(if enabled on the VPC policy),VPC Flow Logs(if enabled on the subnet), andCloud NAT Logsdirectly from the underlying Cloud Logging stream—even if a custom exclusion filter drops them from the_Defaultstorage bucket! - Key Architectural Rule: While
ETDreads from the log stream automatically, ifCloud DNS Logging,VPC Flow Logs, orData Access Audit Logsare turned OFF at the resource/IAM level, the logs are never generated in the first place, blinding bothETDandGoogle SecOps! - Required Logs by Threat Scenario:
- IAM privilege escalation / Service Account key creation / Firewall modifications → Cloud Audit Logs (
Admin Activity). - Unauthorized read/exfiltration of Cloud Storage objects or BigQuery tables → Cloud Audit Logs (
Data Access—DATA_READ). - VPC Service Controls perimeter blocks or IAM permission denials → Cloud Audit Logs (
Policy Denied). - Cryptomining domain lookups / C2 DGA domains / DNS exfiltration → Cloud DNS Server Policy Logging.
- Lateral movement across internal VMs / East–West port scanning → VPC Flow Logs (plus Firewall Rules Logging for denied connection attempts).
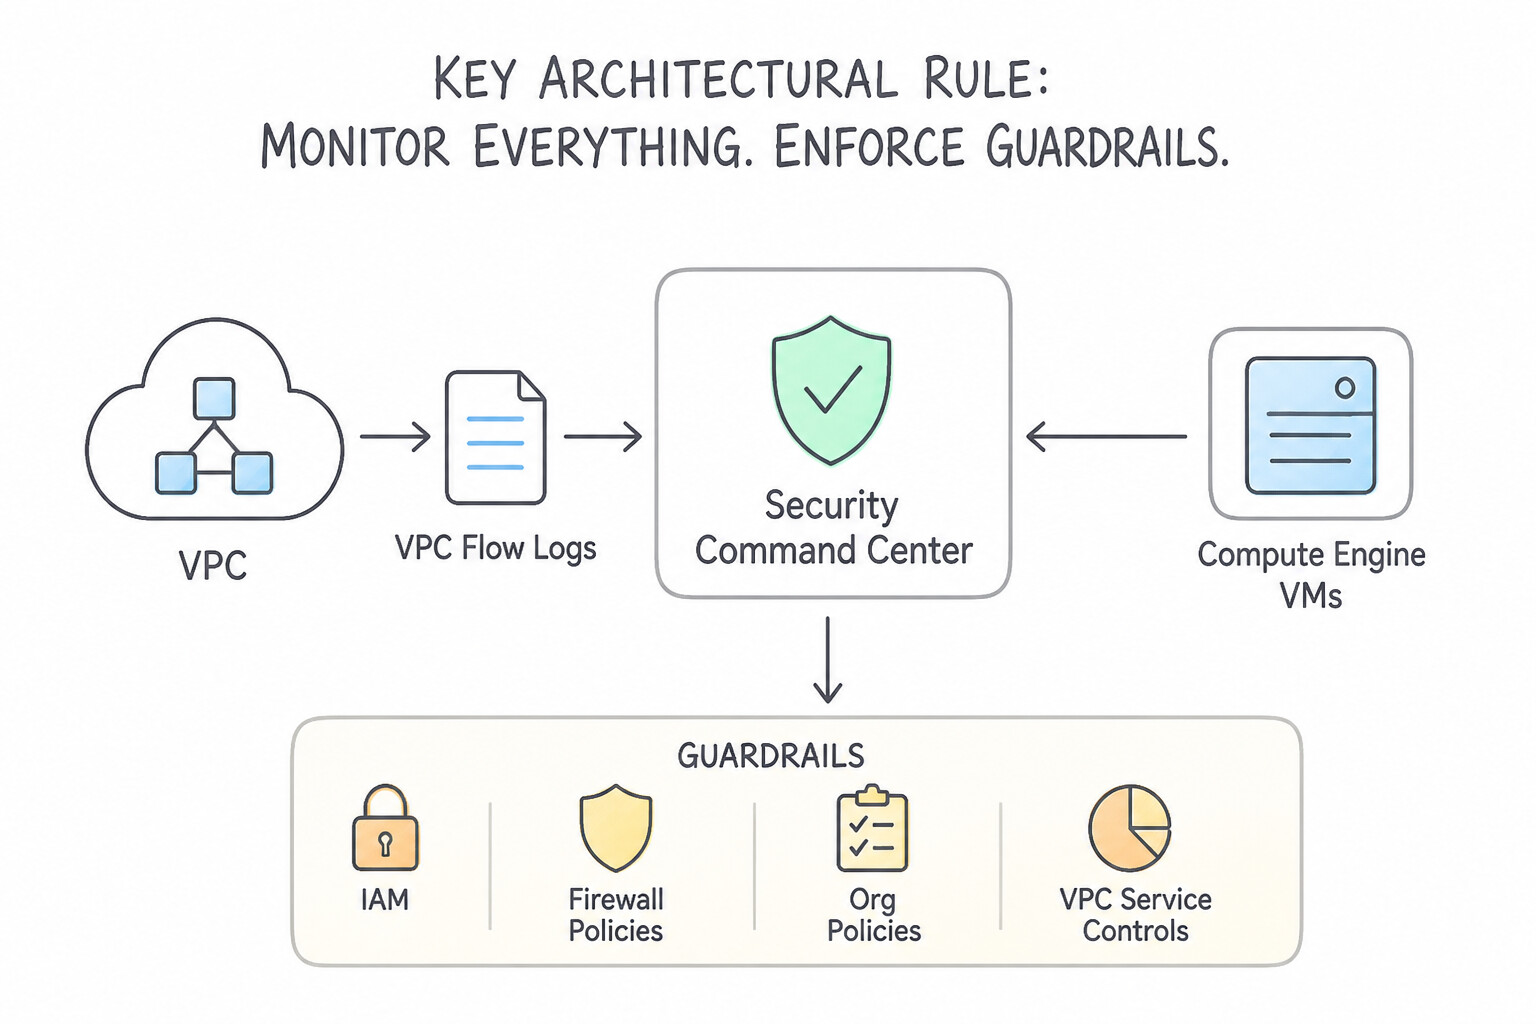
Key Implementation Patterns
- ETD Cryptomining Prerequisites: Use Enable VPC Flow Logs for the subnets used by the VMs. ETD uses VPC Flow Logs to match outbound traffic against known mining pool IP addresses. (Avoid alternative: Cloud Audit Logs track API calls, not the network traffic metadata needed to spot mining pool connections.)
- Granular Data Exfiltration Visibility: Use Enable Data Access audit logs for the Cloud Storage API to capture DATA_READ operations. Admin Activity logs do not track data reads. You must enable Data Access audit logs (specifically DATA_READ) to see object-level access. (Avoid alternative: Object Versioning tracks changes and deletions for recovery, not read access for security auditing.)
- Malware C2 Detection via DNS: Use Enable Cloud DNS logging for all Virtual Private Cloud (VPC) networks. Cloud DNS logging captures the domain name queries, allowing SCC to detect malware using Domain Generation Algorithms. (Avoid alternative: VPC Flow Logs capture IP addresses and ports, not the domain names required to detect DGA-based malware.)
Key Takeaways (2.1c)
- Event Threat Detection (ETD) relies on specific logs to function; if logs are disabled, detection cannot occur.
- VPC Flow Logs are the primary source for network-based threat detection, such as identifying connections to cryptomining pools.
- Cloud Audit Logs identify API actions (control plane), while VPC Flow Logs identify network traffic (data plane).
- Admin Activity logs track configuration changes and are on by default.
Consideration 2.1d: Evaluating parsers for data ingestion in Google SecOps
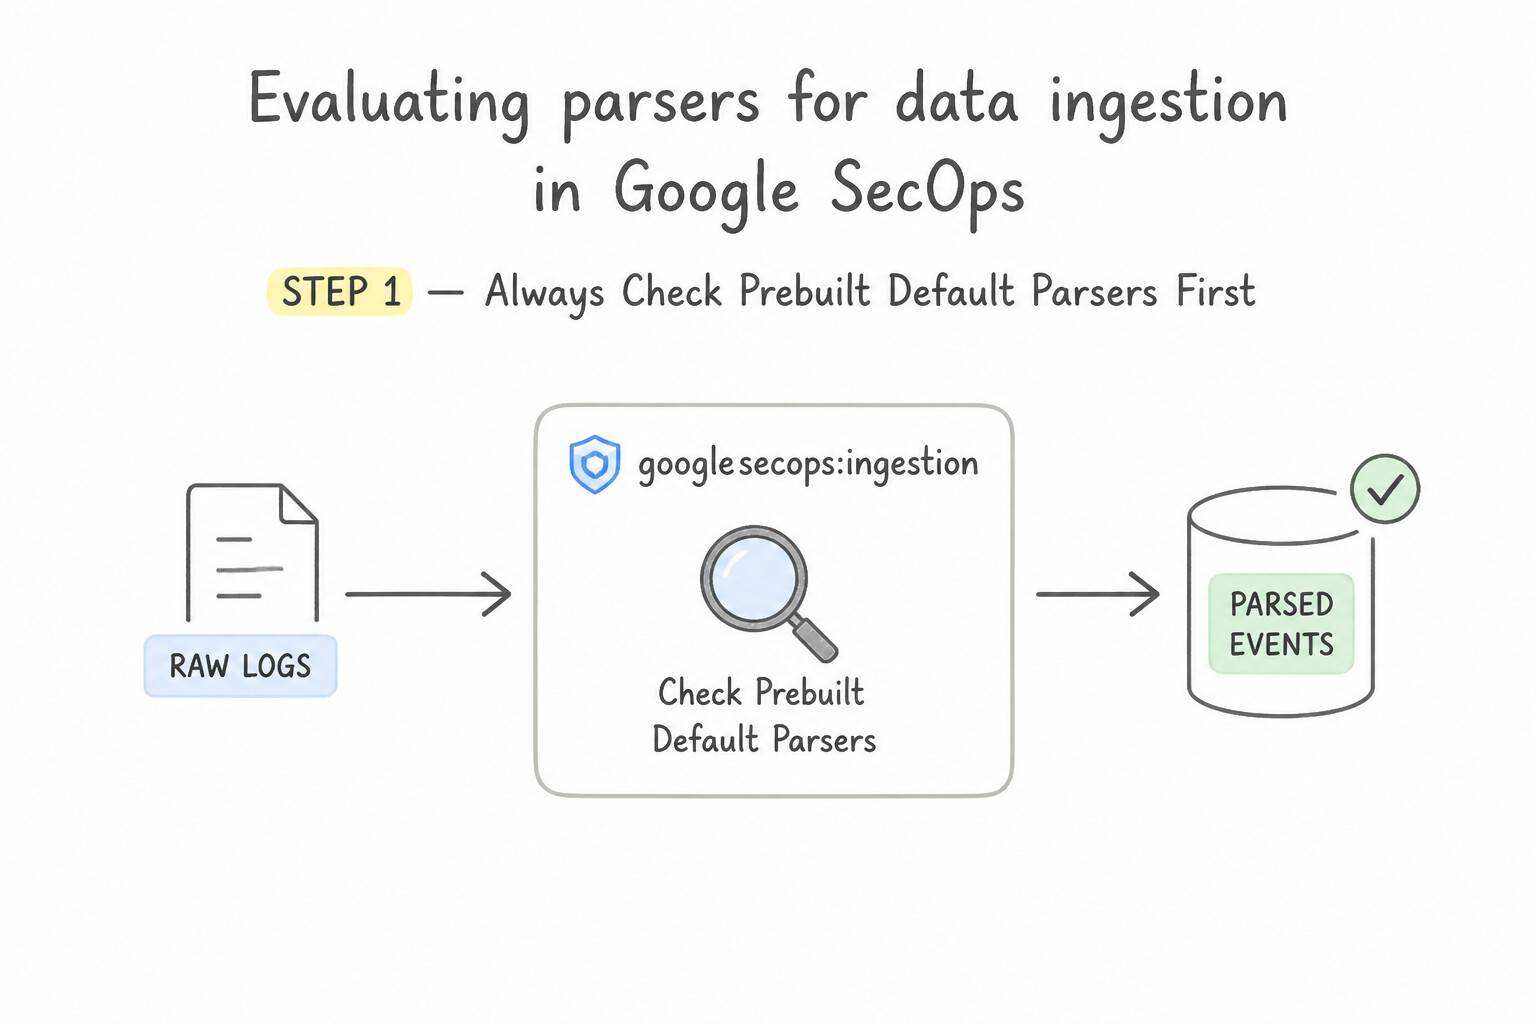
When onboarding a new log source into Google SecOps SIEM:
- Step 1 — Always Check Prebuilt Default Parsers First: Google SecOps maintains hundreds of out-of-the-box parsers mapped to standard
log_typelabels. Before writing any parser code, verify whether an official prebuilt parser exists for the vendor/appliance. - Step 2 — Diagnose Parser Health in the Data Ingestion & Parser Management UI:
- Parsed (
Active): Raw logs matched the parser rules and produced valid UDM events. - Failed /
Drop: Intentionally dropped blank/heartbeat lines via parserdropstatements. Parse Error: The raw log syntax (e.g., malformed JSON or unexpected syslog header) could not be parsed by thegrok/json/xmlfilter.Validation Error: The parser extracted fields, but the resulting UDM object violated UDM Schema Validation (for example, settingmetadata.event_type = "NETWORK_CONNECTION"without populating required target/principal network fields, or failing to populatemetadata.event_timestamp).
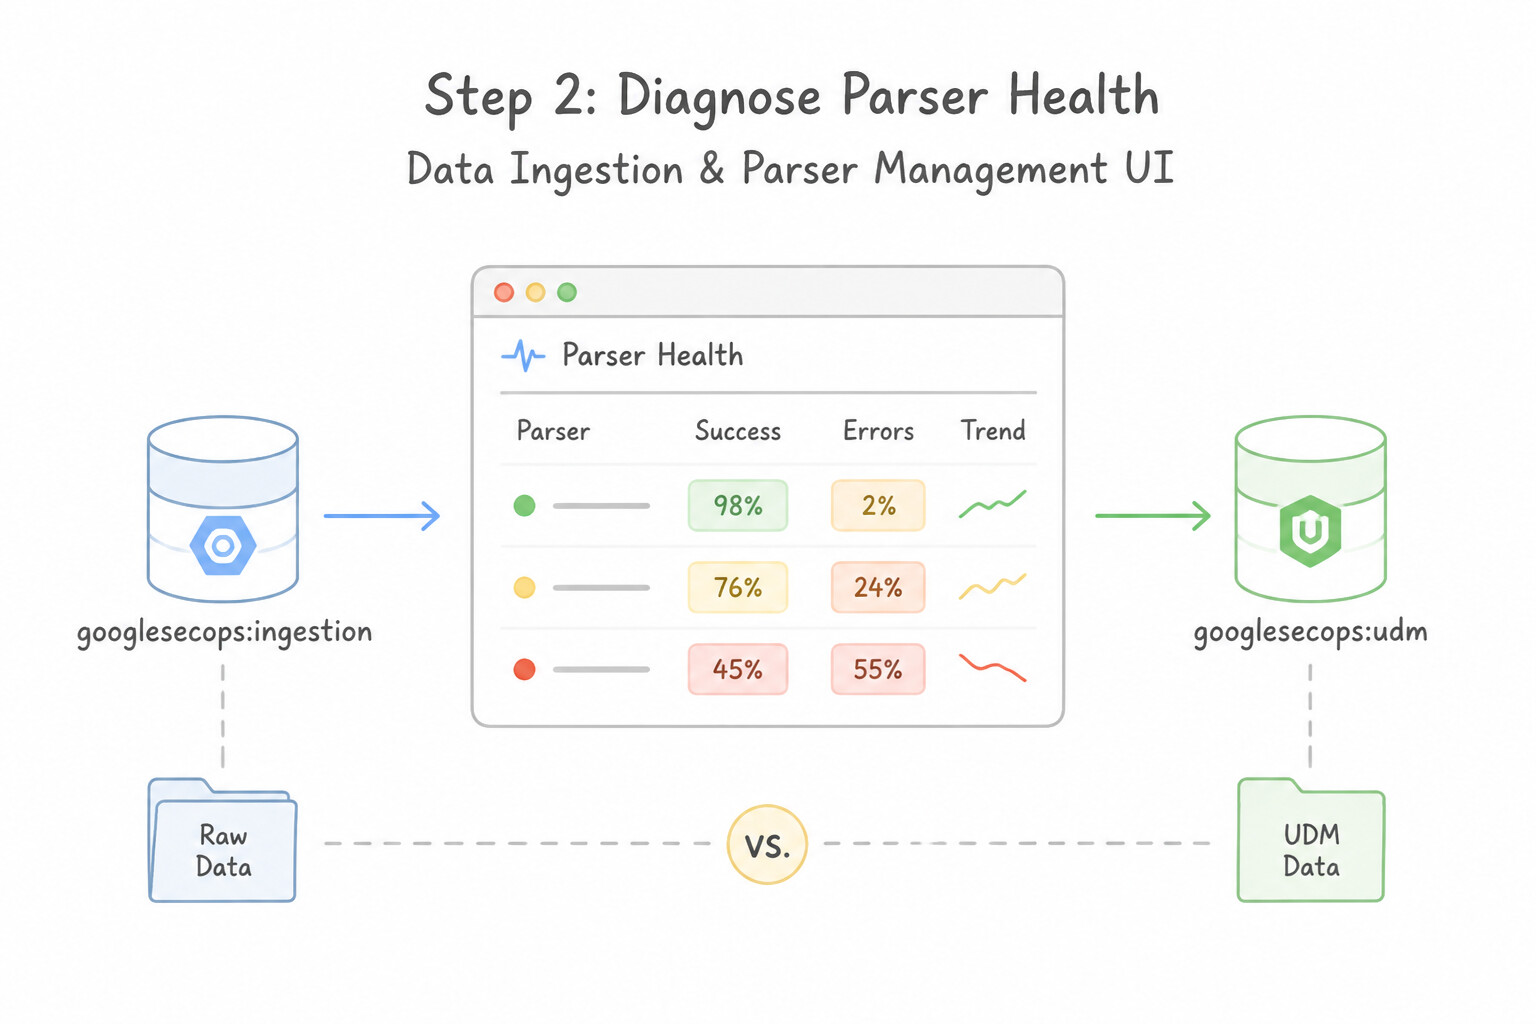
Key Implementation Patterns
- Ingestion Label Mismatches: Use Change the forwarder configuration to use the correct Ingestion Label for the firewall's Log Type. The Ingestion Label maps the log source to the correct parser; correcting it enables parsing. (Avoid alternative: Custom parsers are unnecessary for standard supported logs; the issue is configuration, not the absence of a parser.)
- Handling Timestamp Formats: Use Update the parser configuration to define the correct time_zone parameter in the date filter. The parser determines how timestamps are interpreted; specifying the
time_zonein the date filter ensures the parser applies the correct offset to logs lacking explicit timezone data. - Custom Parser Creation (CBN): Use Create a custom parser using Chronicle parser syntax (CBN) to map log patterns to UDM fields. Custom parsers allow you to map non-standard log formats to structured UDM fields for searchability and correlation. (Avoid alternative: Ingesting as unparsed does not normalize data into UDM, preventing effective correlation and efficient searching.)
Key Takeaways (2.1d)
- Logs in Google SecOps must be associated with a specific Log Type (Ingestion Label) to be parsed.
- If logs appear in raw search but not in UDM search, the parser is not being applied.
- Default parsers exist for most common security vendors; check configuration before building custom parsers.
- The Forwarder configuration controls which Log Type is assigned to a specific data source.
Consideration 2.1e: Configuring parser modifications or extensions in Google SecOps
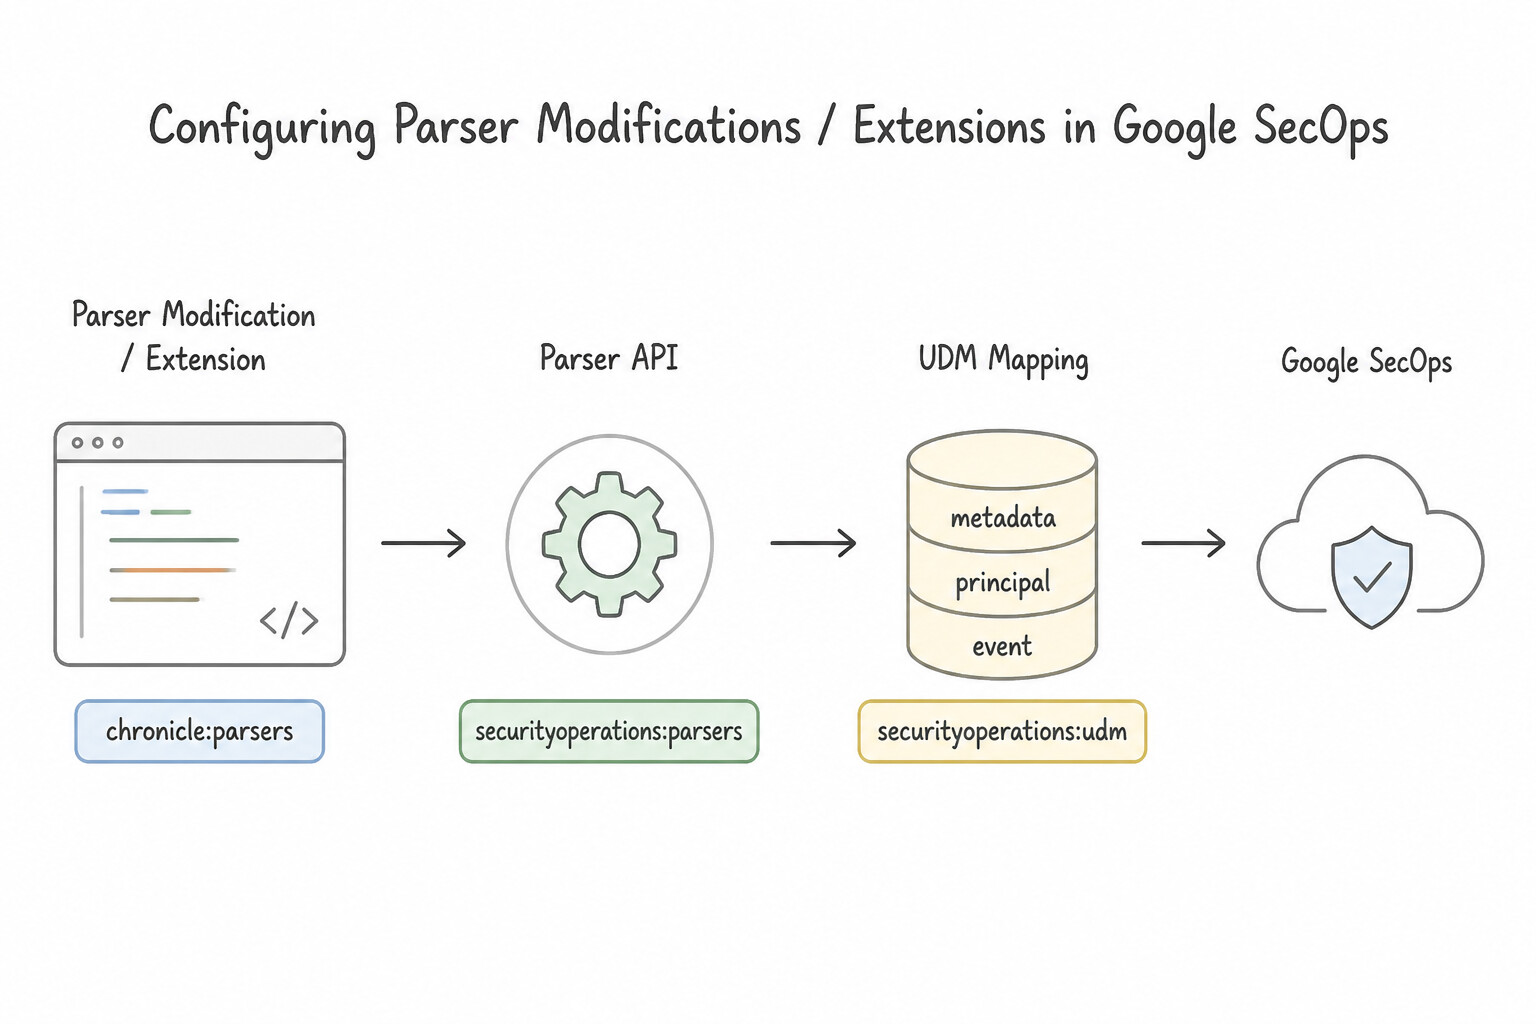
When a default parser does not extract a custom organizational field or fails on a vendor format tweak, follow the Strict Customization Hierarchy:
- Option 1 (Best Practice — Lowest Maintenance): No-Code
Parser Extension: - If the incoming log is structured (
JSON,XML, orKey-Value) and the Google default parser already works for 95% of fields, create a No-Code Parser Extension in the SecOps UI to map the extra raw field (e.g.,$.custom_auth.badge_id) directly to a UDM field (e.g.,principal.user.employee_idoradditional.fields) without writing code or touching the base parser. - Option 2 (Complex Extraction on Managed Source): Code-Based
Parser Extension(CBN Snippet): - If the unmapped field is embedded inside an unstructured string requiring regex extraction (
grok), conditional logic (if/else), or custom timestamp transformation (date), write a Code-Based Parser Extension. It executes alongside the Google-managed parser so you still inherit all upstream updates to the base parser. - Option 3 (Proprietary / Homegrown Application with Zero Default Parser): Full
Custom CBN Parser: - Only build a full custom Config-Based Normalization (
CBN) parser when no default parser exists. Validate it against sample logs using the SecOps Parser Editor / CLI (cbn_tool) before promoting it fromDraft/PrebuilttoActive.
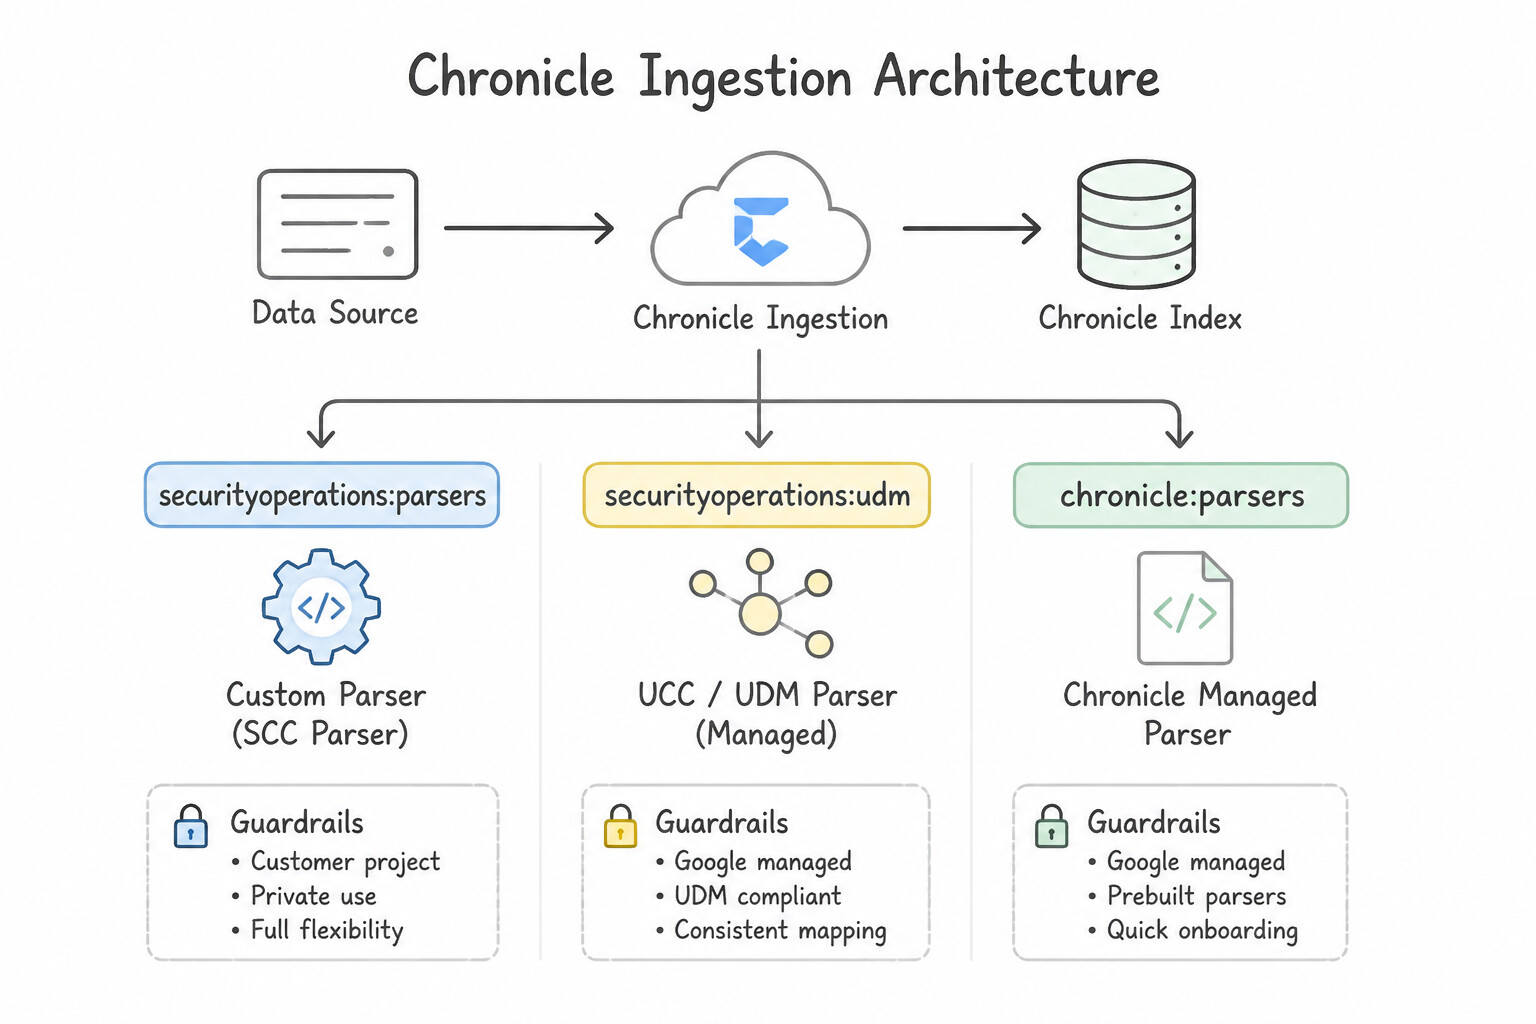
Key Implementation Patterns
- Creating Custom Parsers for Proprietary Applications: Use Create a new parser in the Google SecOps Settings page using Grok patterns to extract and map fields to UDM. You must build a custom parser within Google SecOps to map non-standard logs to UDM. (Avoid alternative: External preprocessing is unnecessary as Google SecOps has a native parsing engine.)
- Extending System Parsers without Overwriting: Use Create a parser extension for the log type that includes the extraction logic for the "Session_ID" field. Parser extensions enable custom field mapping while keeping the underlying system parser connected to Google-managed updates.
Key Takeaways (2.1e)
- Google SecOps requires parsers to convert raw logs into the Unified Data Model (UDM).
- Default parsers exist for standard vendors, but proprietary apps require custom parsers.
- Custom parsers are created in the Settings menu using Grok patterns to extract and map data.
- Parsing is preferred over external pre-processing for log normalization.
Consideration 2.1f: Evaluating data normalization techniques from log sources in Google SecOps
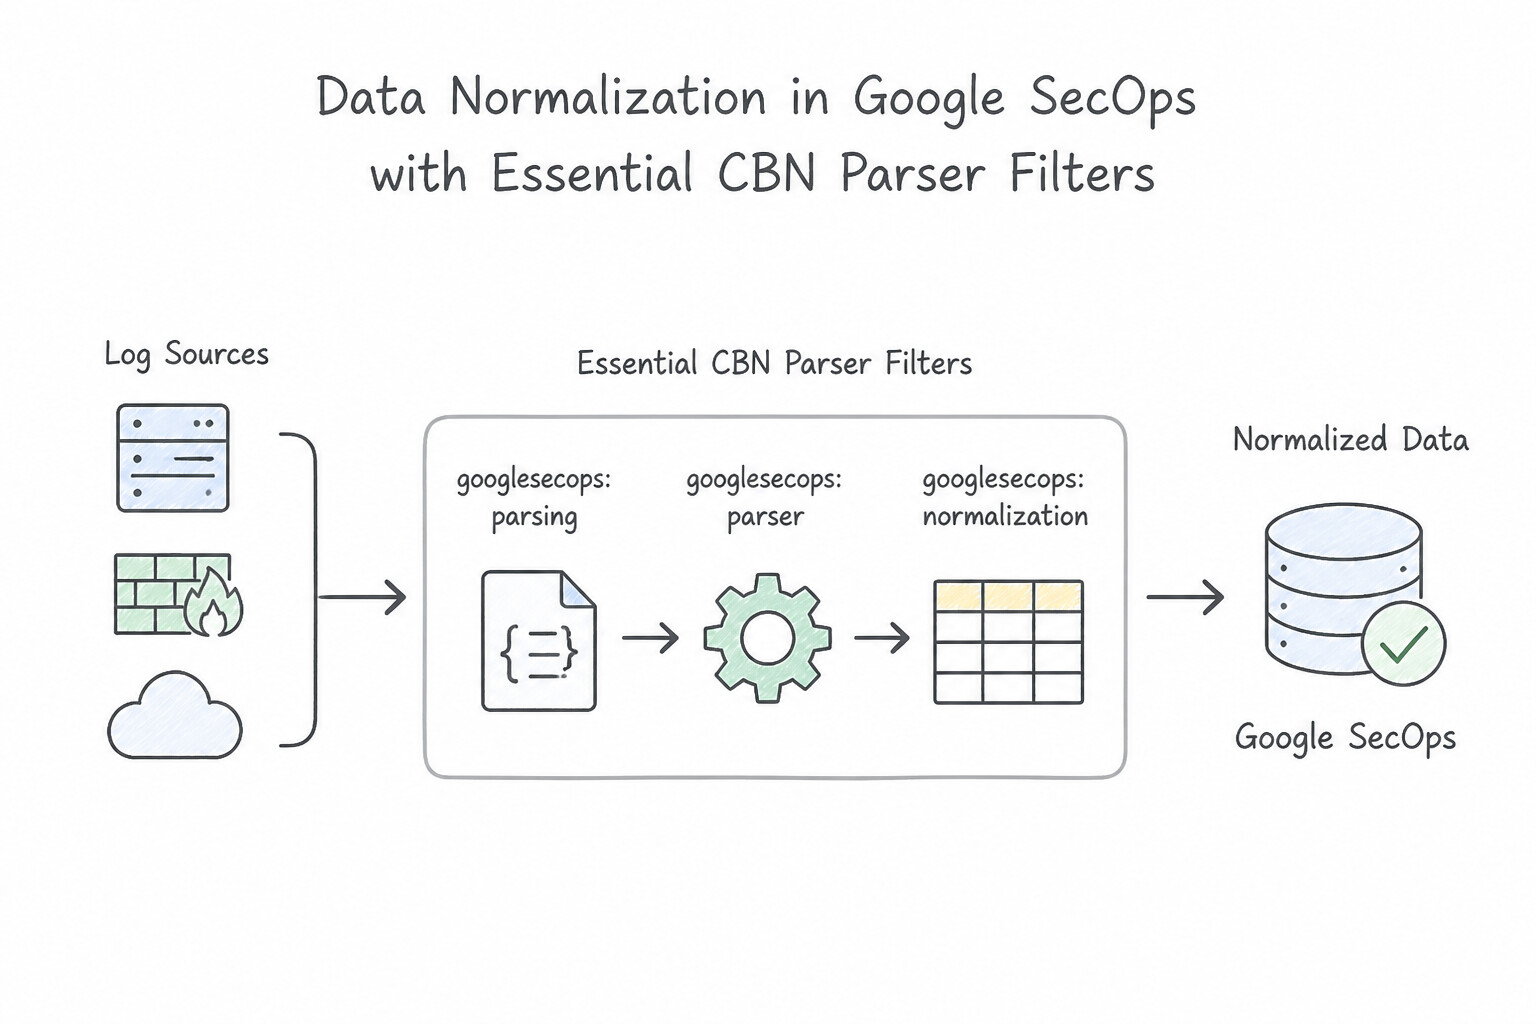
Mastering Config-Based Normalization (CBN) filters and UDM schema rules is critical in production:
- Essential CBN Parser Filters:
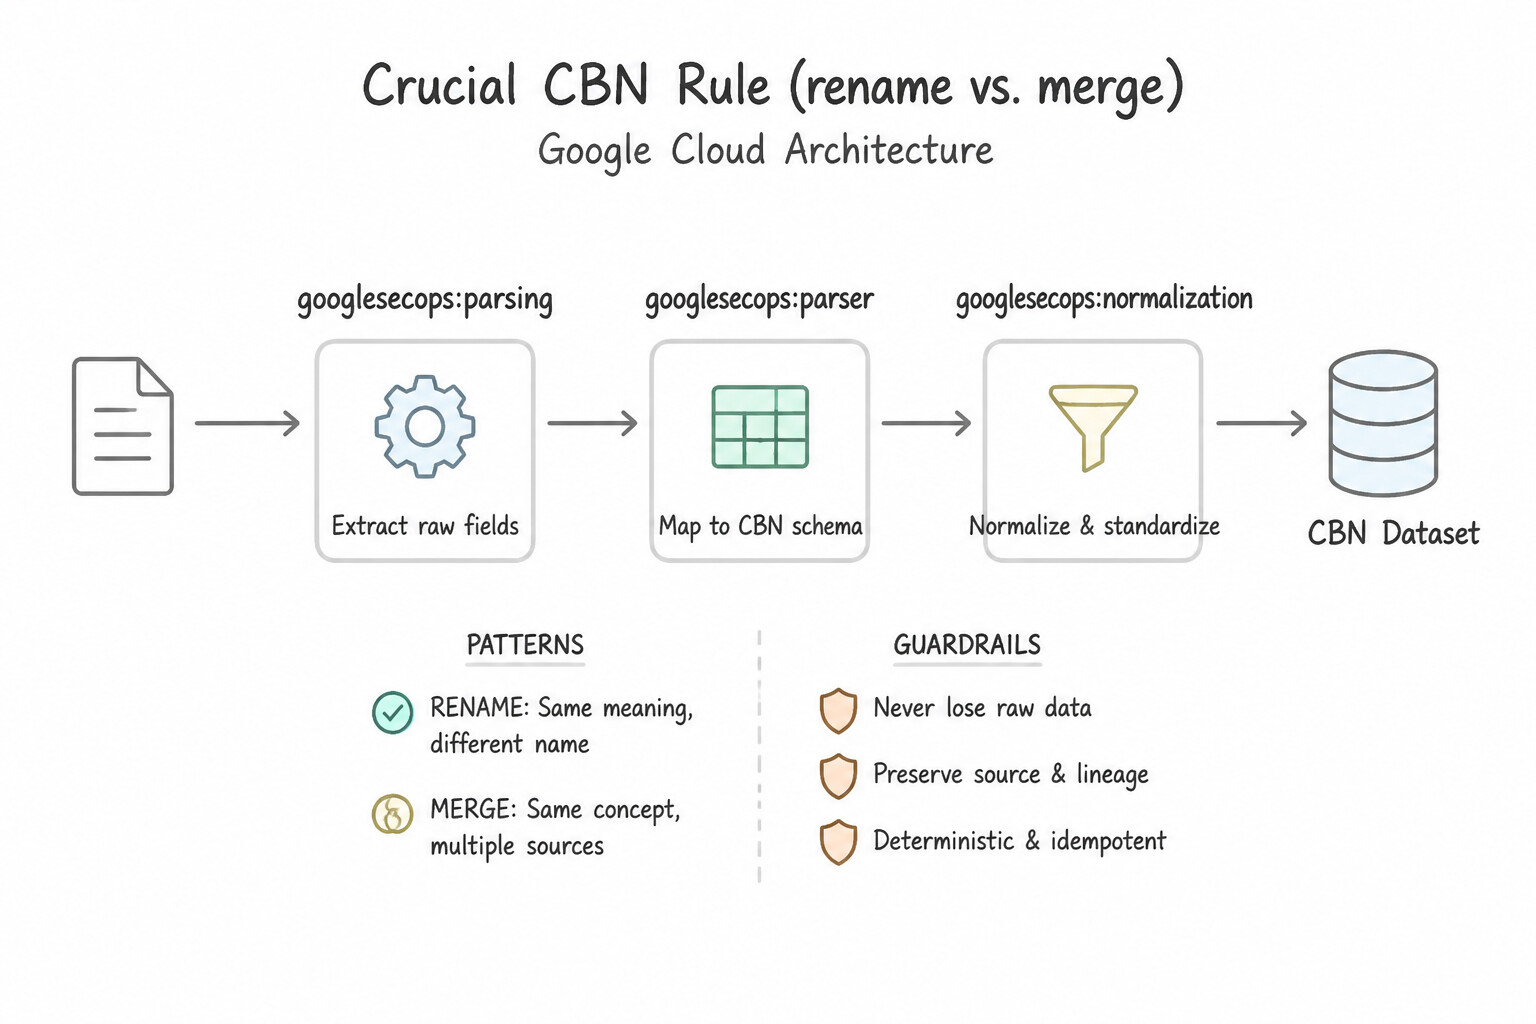
grok: Extracts named fields from unstructured text using regular expression patterns (e.g.,match => { "message" => "%{IP:src_ip} %{WORD:action}" }).kv: Automatically splits key-value pairs (key1=val1 key2=val2) using specifiedfield_splitandvalue_splitdelimiters.json/xml/csv: Parses structured payloads into intermediate dictionary trees.date: Converts arbitrary local timestamp strings (e.g.,"13/Oct/2026:14:22:01 +0530") into the normalized UTCevent.idm.read_only_udm.metadata.event_timestamprequired by every UDM record.mutate(rename,replace,convert,merge,gsub,lowercase): Maps intermediate variables into final UDM paths.- Crucial CBN Rule (
renamevs.merge): Userenameorreplacefor scalar (single-value) UDM fields (likeprincipal.hostname). For repeated (array) UDM fields (likeprincipal.ip,target.ip,security_result, oradditional.fields), you must assign the element to a temporary variable and usemutate { merge => { "@output_array" => "temp_item" } }! - Handling Unmapped Custom Attributes (
additional.fields): - Always map security concepts to standard UDM fields first (
principal.user.userid,target.process.command_line,security_result.action). Only when a proprietary business attribute has no semantic equivalent in the UDM schema should you map it as a key-value Struct insideadditional.fields.
Key Implementation Patterns
- Unstructured Log Parsing with Grok: Use Create a custom parser that uses Grok patterns to extract data based on the text structure. Grok patterns are specifically designed to extract structured data from unstructured, positional text logs. (Avoid alternative: XML filters are strictly for XML-formatted data and cannot parse plain, space-delimited text.)
- Timestamp Normalization and Timezones: Use Use the date filter in the parser, specifying the timezone parameter to convert local time to UTC. The date filter with a timezone parameter correctly converts local time strings to the standard UTC format. (Avoid alternative: Replacing the event timestamp with ingestion time loses the actual time the event occurred.)
- JSON Log Field Mapping: Use Use the
jsonfilter to parse the payload, and assign the extracted variable to the UDM field. Thejsonfilter is the standard and most efficient way to parse structured JSON logs directly into variables. (Avoid alternative: Grok is intended for unstructured text using regex, not for natively structured data like JSON.)
Key Takeaways (2.1f)
- Unstructured text logs require custom parsers to define how data is read.
- Grok is the primary method for extracting data from text based on patterns and position.
- Standard filters like JSON or XML only work if the source data already follows those formats.
- Google SecOps (Chronicle) requires all event timestamps to be normalized to UTC in the UDM.
Consideration 2.1g: Evaluating new labels for data ingestion
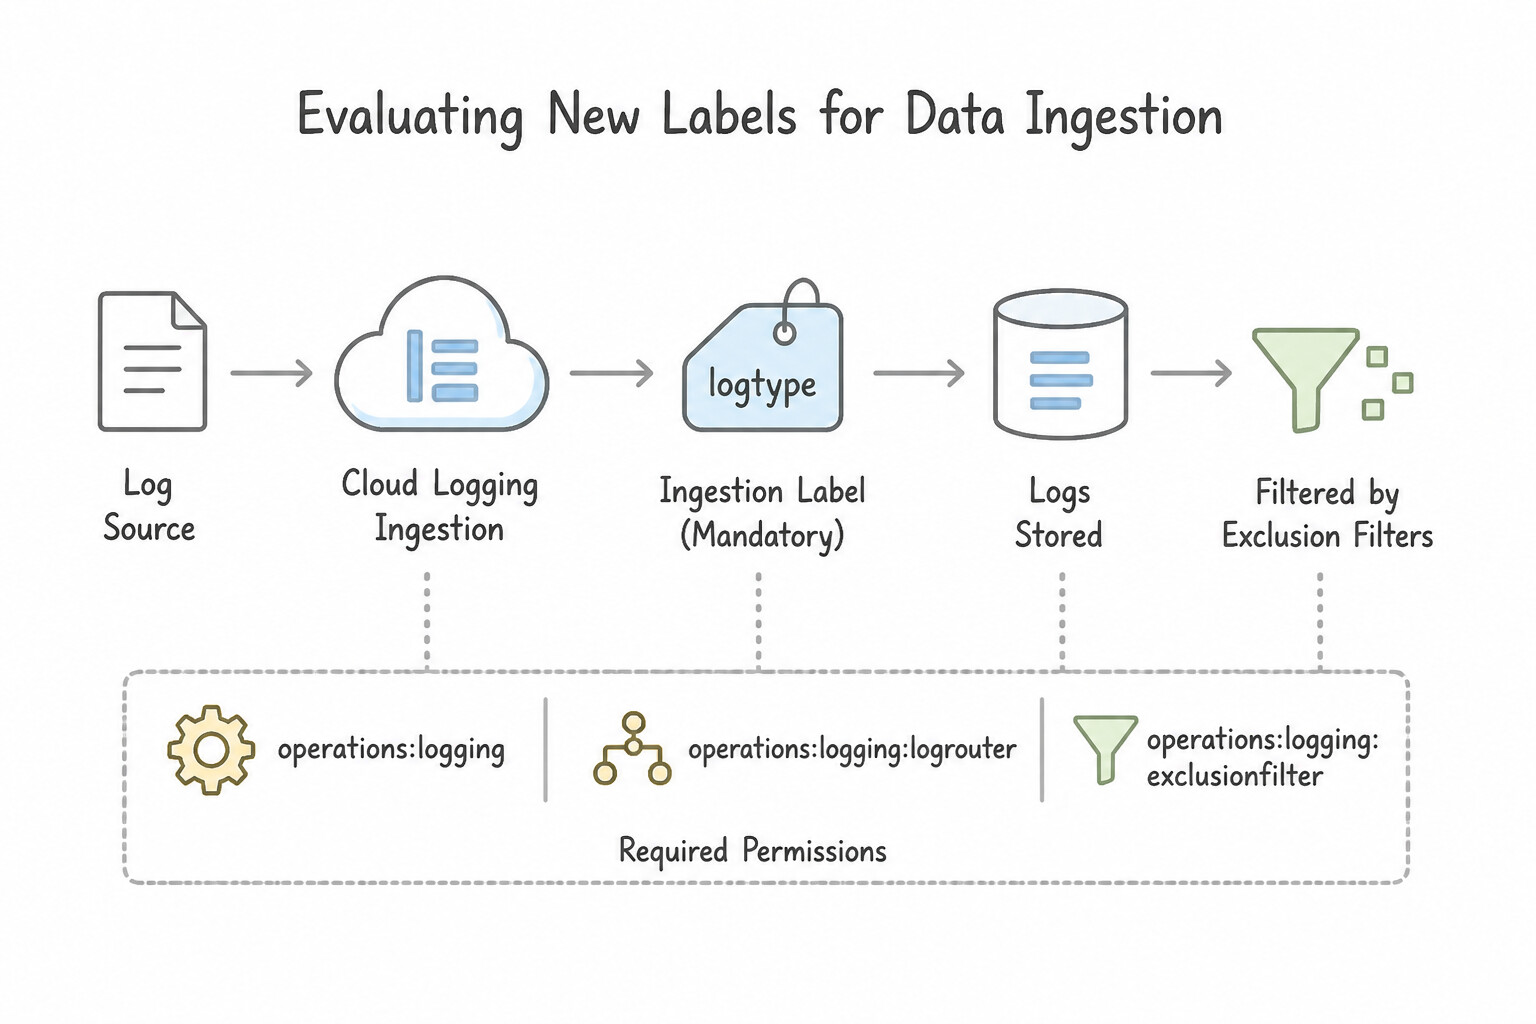
Google SecOps attaches three distinct categories of labels during ingestion—never confuse them in Production:
- 1.
log_type(Ingestion Label — Mandatory): - Identifies the vendor/format schema (e.g.,
GCP_CLOUDAUDIT,OKTA,WINDOWS_SYSMON,CS_EDR) and determines which parser processes the raw log. - 2.
namespace(Asset Namespace — Network Disambiguation): - Solves the Overlapping RFC 1918 Private IP Problem. If an enterprise has
VPC-Prod(10.1.0.0/16),VPC-Dev(10.1.0.0/16), and an acquired subsidiary (10.1.0.0/16), tagging each forwarder/feed with a distinctnamespace(e.g.,prod,dev,sub-alpha) ensures that10.1.5.20inprodis never aliased or correlated with10.1.5.20indev. - 3.
ingestion_labels(Custom Key-Value Metadata): - Arbitrary key-value pairs attached at the forwarder or feed level (e.g.,
environment=production,data_classification=pci,region=emea) that populatemetadata.ingestion_labelsin UDM. Used for Data RBAC scoping, compliance filtering, and YARA-L rule conditions.
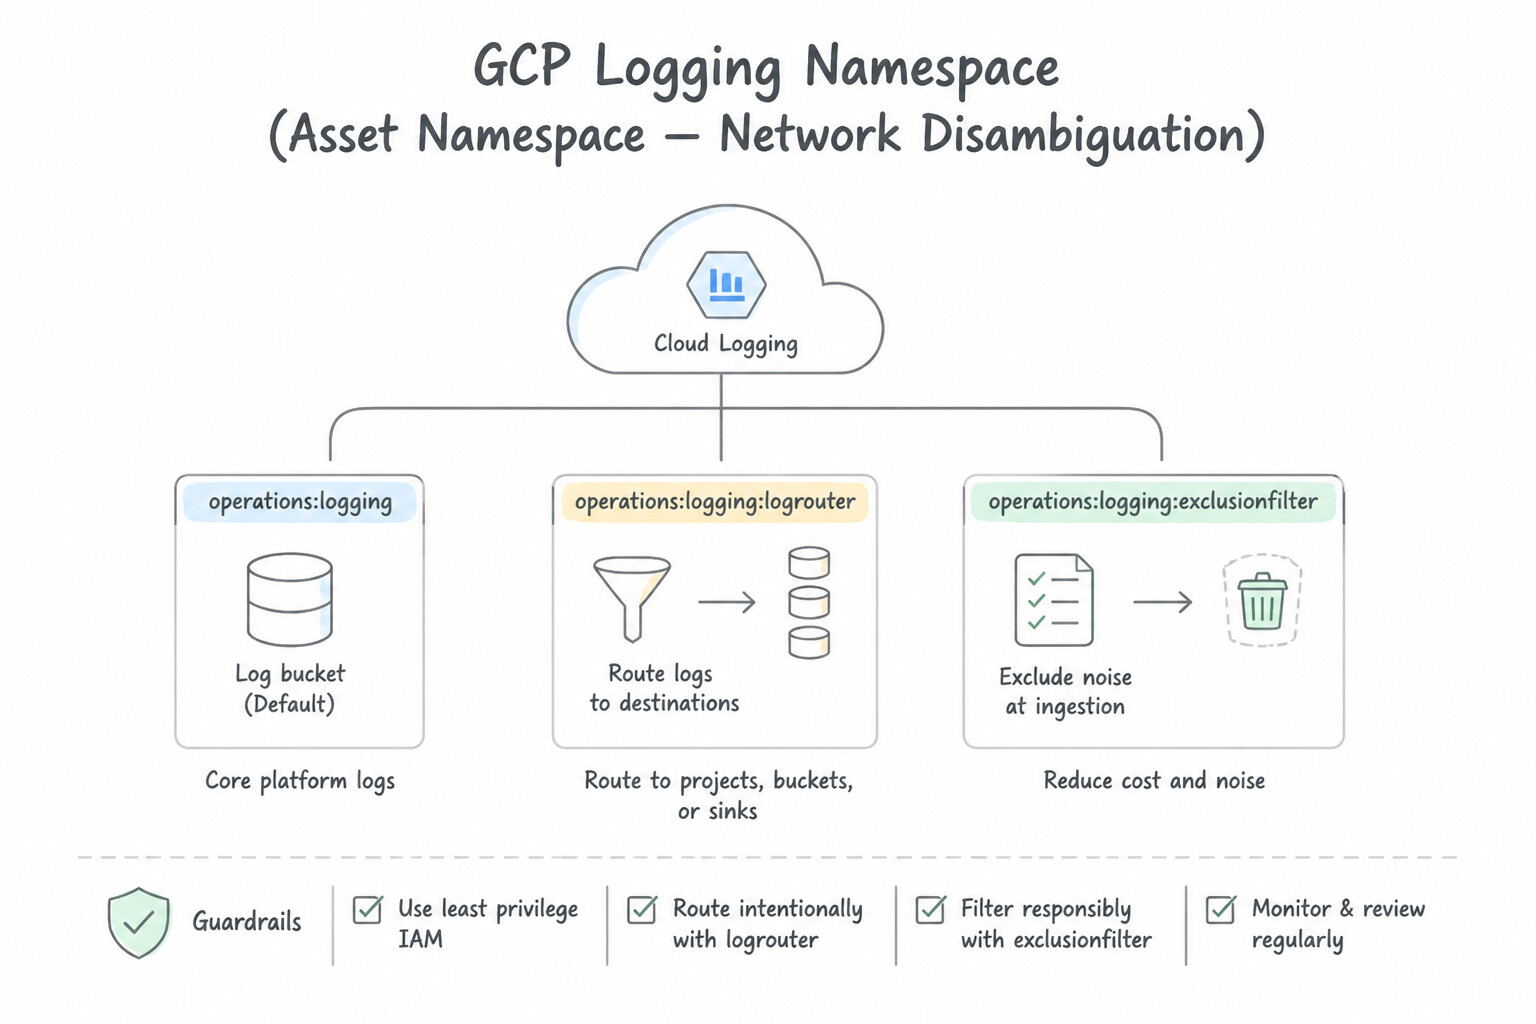
Key Implementation Patterns
- Optimizing Log Ingestion Costs via Environment Labels: Use Create a Log Router sink to export all logs. Add an exclusion filter to the sink matching labels.env="Development" AND severity < ERROR. Use an exclusion filter in the Log Router sink to discard Development logs with low severity before ingestion.
- Enriching SIEM Alerts with Context: Use Apply the labels to the VM instances. Configure Splunk to extract the label field from the exported JSON log payload. Labels applied to resources appear in the log JSON structure; the SIEM (Splunk) must be configured to extract this field to make it usable.
- Routing Compliance Data to Regional Buckets: Use Create two Log Router sinks. Configure the first sink with a filter for label "region:eu" and set the destination to the Europe dataset. Configure the second sink with a filter for label "region:us" and set the destination to the US dataset. Create separate Log Router sinks with inclusion filters matching the specific labels to route logs to their respective regional destinations.
Key Takeaways (2.1g)
- Use Log Router exclusion filters to reduce ingestion costs by dropping noisy or unnecessary logs.
- Sinks can filter based on resource labels and log severity.
- Filtering data before ingestion is more cost-effective than deleting it after storage.
- Sinks route data to destinations; exclusion filters refine what gets routed.
Consideration 2.1h: Managing log and ingestion costs
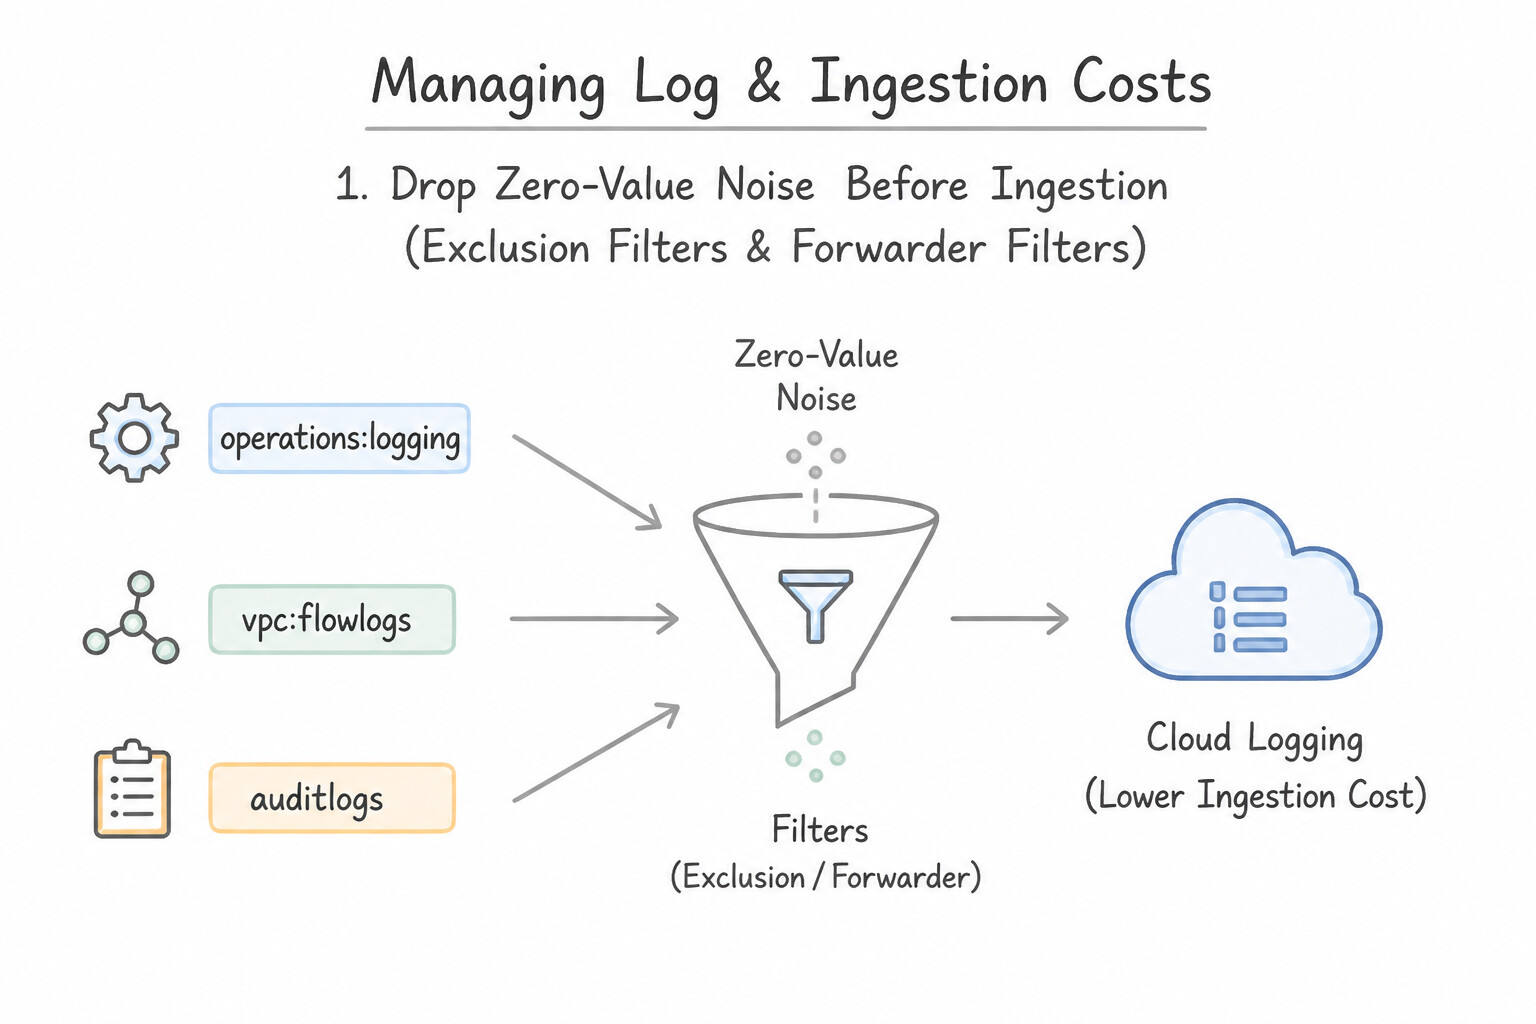
When a workload scenario requires how to reduce Cloud Logging or Google SecOps ingestion costs without sacrificing critical threat detection:
- 1. Drop Zero-Value Noise Before Ingestion (
Exclusion Filters&Forwarder Filters): - In Cloud Logging, configure Exclusion Filters on the
_Defaultlog bucket (or on the SecOps export sink) to exclude high-volume, low-security-value logs such as HTTP Load Balancer health checks (userAgent="GoogleHC/1.0"), successful internal readiness probes, or verboseDEBUGapplication logs. - In Google SecOps Forwarder, use regex
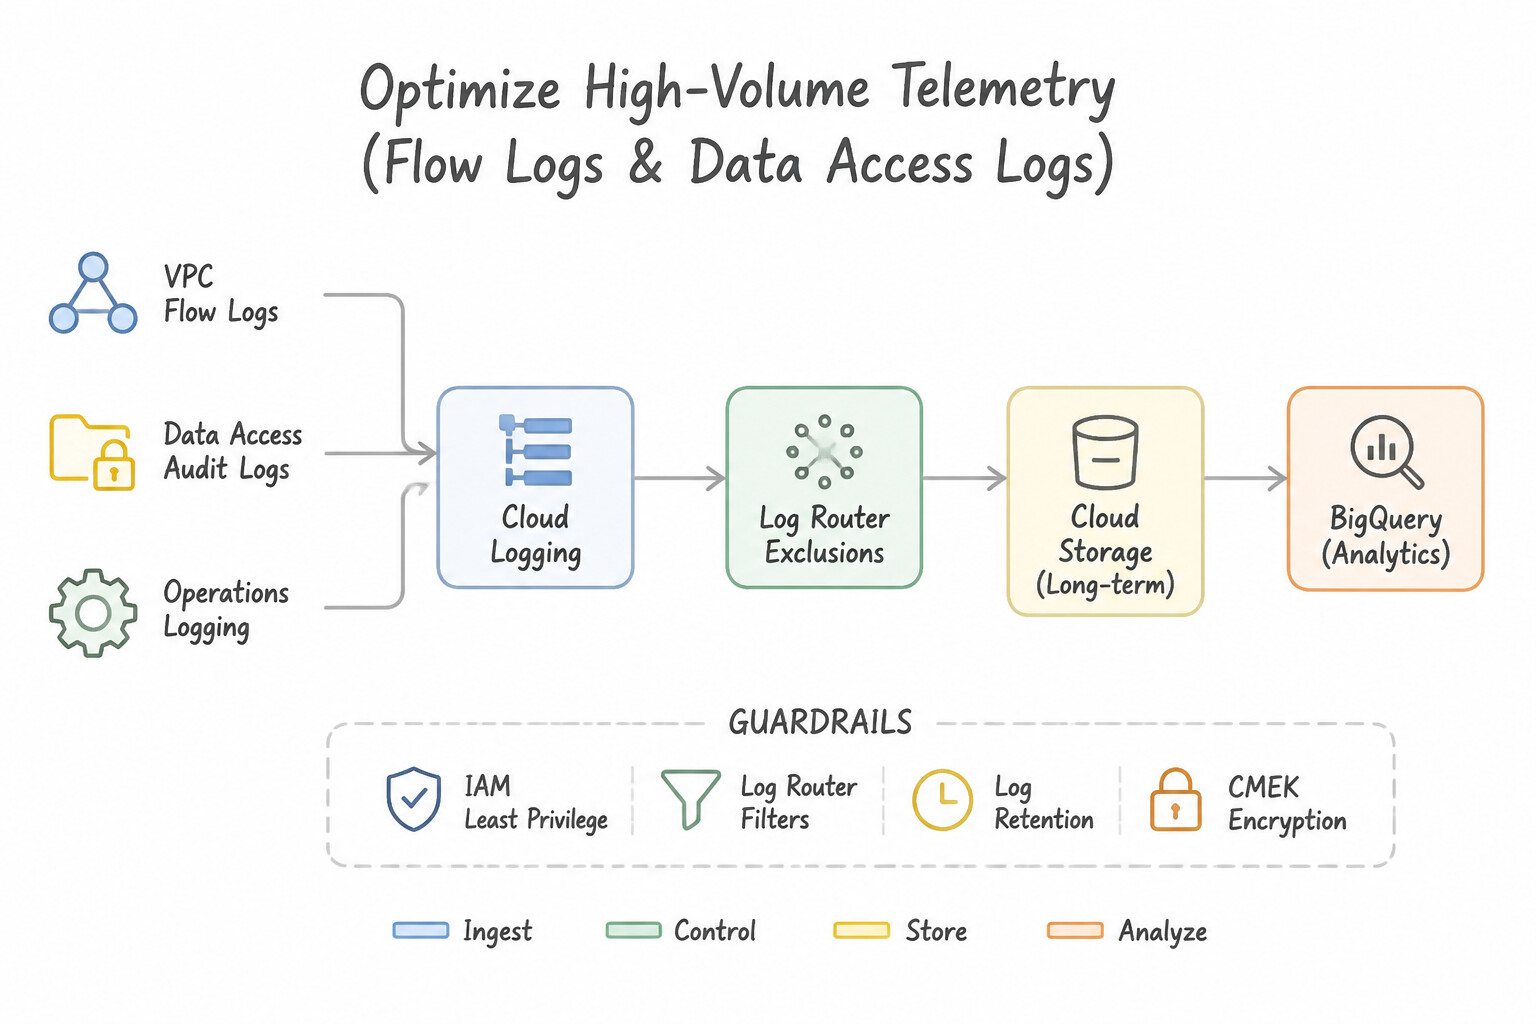
regex_filterrules (or SecOps Ingestion Filters) to drop noisy keepalive/broadcast events before they consume SIEM ingestion quota. - 2. Optimize High-Volume Telemetry (
VPC Flow Logs&Data Access Logs): - VPC Flow Logs: Instead of disabling Flow Logs completely or keeping 100% sampling everywhere, use metadata filtering (
filter-exprto log only external or cross-subnet flows), adjust sampling rate (e.g.,0.5on standard subnets,1.0on crown-jewel subnets), and selectOnly include selected metadatato trim payload size. - Data Access Audit Logs: Enable
DATA_READ/DATA_WRITEonly on sensitive services/projects, and configureexemptedMembersto exclude trusted, high-frequency internal batch service accounts from generating millions of routine read logs. - 3. Tiered Storage Routing (
Hot SIEMvs.Cold Compliance Archive): - Route security-relevant logs (
Admin Activity,Policy Denied,Cloud IDS,EDR,IdP) to Google SecOps SIEM, and route raw verbose compliance/network logs via a Log Router Sink directly to Cloud Storage (Nearline/Coldline/Archive) for low-cost multi-year retention.
Key Implementation Patterns
- Optimizing VPC Flow Log Volume: Use Set the VPC Flow Logs sampling rate to 0.5. Reducing the sampling rate (e.g., to 0.5) lowers the volume of logged packets, directly reducing ingestion costs while maintaining statistical trends. (Avoid alternative: A sampling rate of 1.0 captures all traffic, which maximizes rather than reduces cost.)
- Selective Data Access Logging: Use Update the IAM Audit Config to disable the 'DATA_READ' log type for the Google Cloud Storage API. Disabling 'DATA_READ' in the IAM Audit Config stops the generation of high-volume read logs at the source, reducing costs while keeping other log types active.
- Exclusion Filters for HTTP Load Balancers: Use Add an exclusion filter to the _Default sink for logs where httpRequest.status=200. Exclusion filters in the Log Router prevent specific logs from being ingested into log buckets, directly reducing costs. (Avoid alternative: Disabling logging stops all logs, including critical errors needed for security, which violates the requirement.)
Key Takeaways (2.1h)
- VPC Flow Logs can generate high data volumes in busy networks.
- Use the sampling rate to reduce log volume and costs while maintaining statistical visibility.
- Avoid enabling unnecessary metadata fields to keep log entry sizes small.
- A sampling rate of 1.0 captures 100% of traffic; lower values capture a percentage.
Quick Decision Cheat Sheet (Subsection 2.1)
If the Scenario Requires... | Choose This Google Cloud Pattern | Avoid This Common Mistake |
|---|---|---|
"Add custom field extraction to an existing supported vendor log source without losing Google updates" | Configure a Parser Extension in Google SecOps | Copying the managed parser to create a standalone Custom Parser from scratch |
"Parser fails when mapping a string into principal.ip, target.ip, or security_result" | Use mutate { merge => ... } because the target UDM field is a repeated (array) field | Using mutate { rename => ... } or mutate { replace => ... } directly on a repeated field |
"Custom log has non-standard timestamp string ( dd-MMM-yyyy HH:mm:ss) causing UDM validation errors" | Use the CBN date filter to parse the string and timezone into metadata.event_timestamp | Mapping the raw date string into additional.fields and leaving metadata.event_timestamp empty |
"Isolate overlapping private IP ranges ( 10.0.0.0/8) across multiple VPCs, branches, or M&A subsidiaries" | Configure distinct Asset namespaces in the Forwarder (collector.conf) or Feed settings | Using custom log_type names per branch or NATing all internal logs before ingestion |
"High Cloud Logging bill caused by routine internal batch Service Account DATA_READ audit logs" | Add the trusted batch Service Account to exemptedMembers in the Data Access Audit Log config | Disabling all Data Access logs globally or disabling Admin Activity logs |
"Organization-level Log Router Sink is created, but logs from child projects are not appearing in BigQuery/PubSub" | Enable --include-children on the Organization sink AND grant the sink's Writer Identity permissions on the destination | Creating separate manual sinks in every child project |
Further Reading (Subsection 2.1)
- Collate and route organization-level logs to supported destinations — This guide explains how to create aggregated sinks to route logs from all projects in an organization to a central destination.
- Scenario-based solution: Exporting Cloud Logging data — Provides reference architectures for exporting logs, including the use of Pub/Sub and Dataflow for processing.
- De-identifying sensitive data in logs — Discusses using Cloud DLP and Dataflow to sanitize data.
- Install and configure the forwarder — This guide details the installation and configuration of the Forwarder on a Linux machine, which is the scenario described in the question.
- Setting up finding notifications — Documentation on how to use the Security Command Center API to set up notification configs that send findings to Pub/Sub.
- Mute findings in Security Command Center — Explains how to create mute rules to automatically silence findings based on filters.
Subsection 2.2: Identifying a Baseline of User, Asset, and Entity Context
The Big Picture
Imagine a firewall log arrives in Google Security Operations at 03:14 UTC showing that source IP 10.44.12.88 uploaded 4 GB of data to an external IP 198.51.100.42. If your SIEM only ingests Event logs (point-in-time firewall, proxy, and DNS logs), a Tier 1 analyst staring at 10.44.12.88 cannot answer the three questions that determine whether this is a P4 false positive or a P0 breach:
- Which physical or virtual host held the DHCP lease for
10.44.12.88at03:14 UTC? - Which human user or service account was logged into that host, and what is their department, job title, and privilege tier in Active Directory / Workday?
- Is the host a disposable developer sandbox or a production PCI-DSS database server, and is
198.51.100.42a known Mandiant APT command-and-control server?
Naive security operations teams treat logs as flat text strings and force analysts to run manual lookups across DHCP servers, Active Directory, CMDBs, and VirusTotal during an incident. Production Google SecOps architectures solve this automatically at ingestion time by pairing UDM Event Logs with UDM Entity Context Sources and Time-Aware Aliasing inside the Google SecOps Entity Graph:
Consideration 2.2a: Identifying relevant threat intelligence information in the enterprise environment
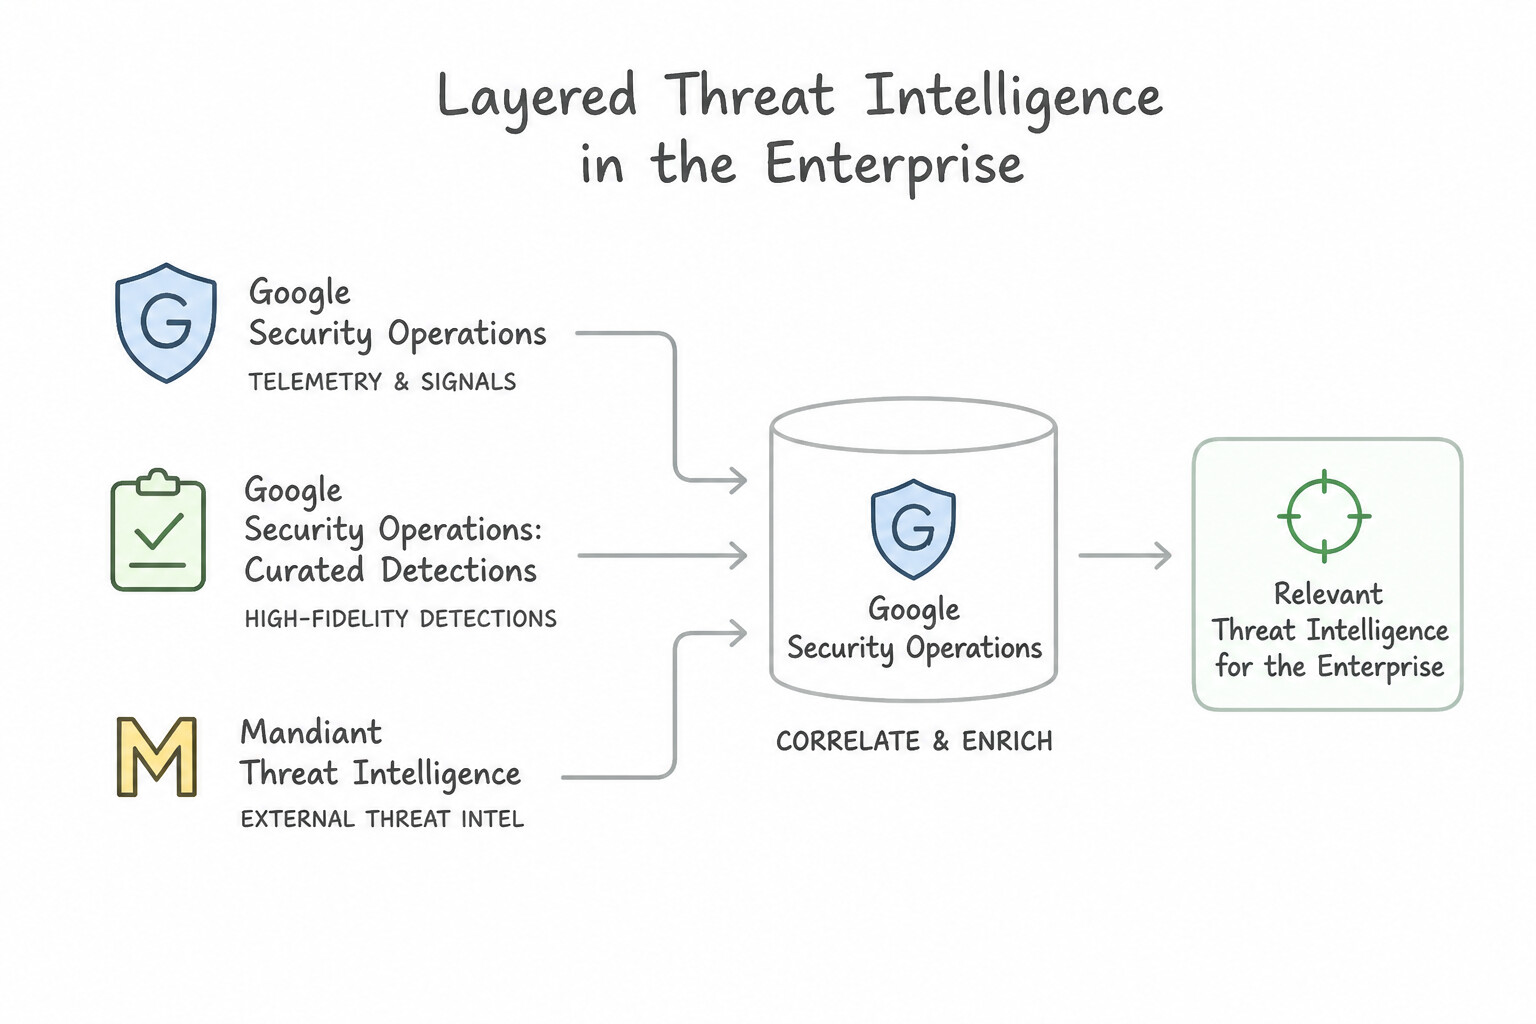
To establish a high-signal threat intelligence baseline inside Google SecOps:
- Layered Threat Intelligence Sources in the Enterprise:
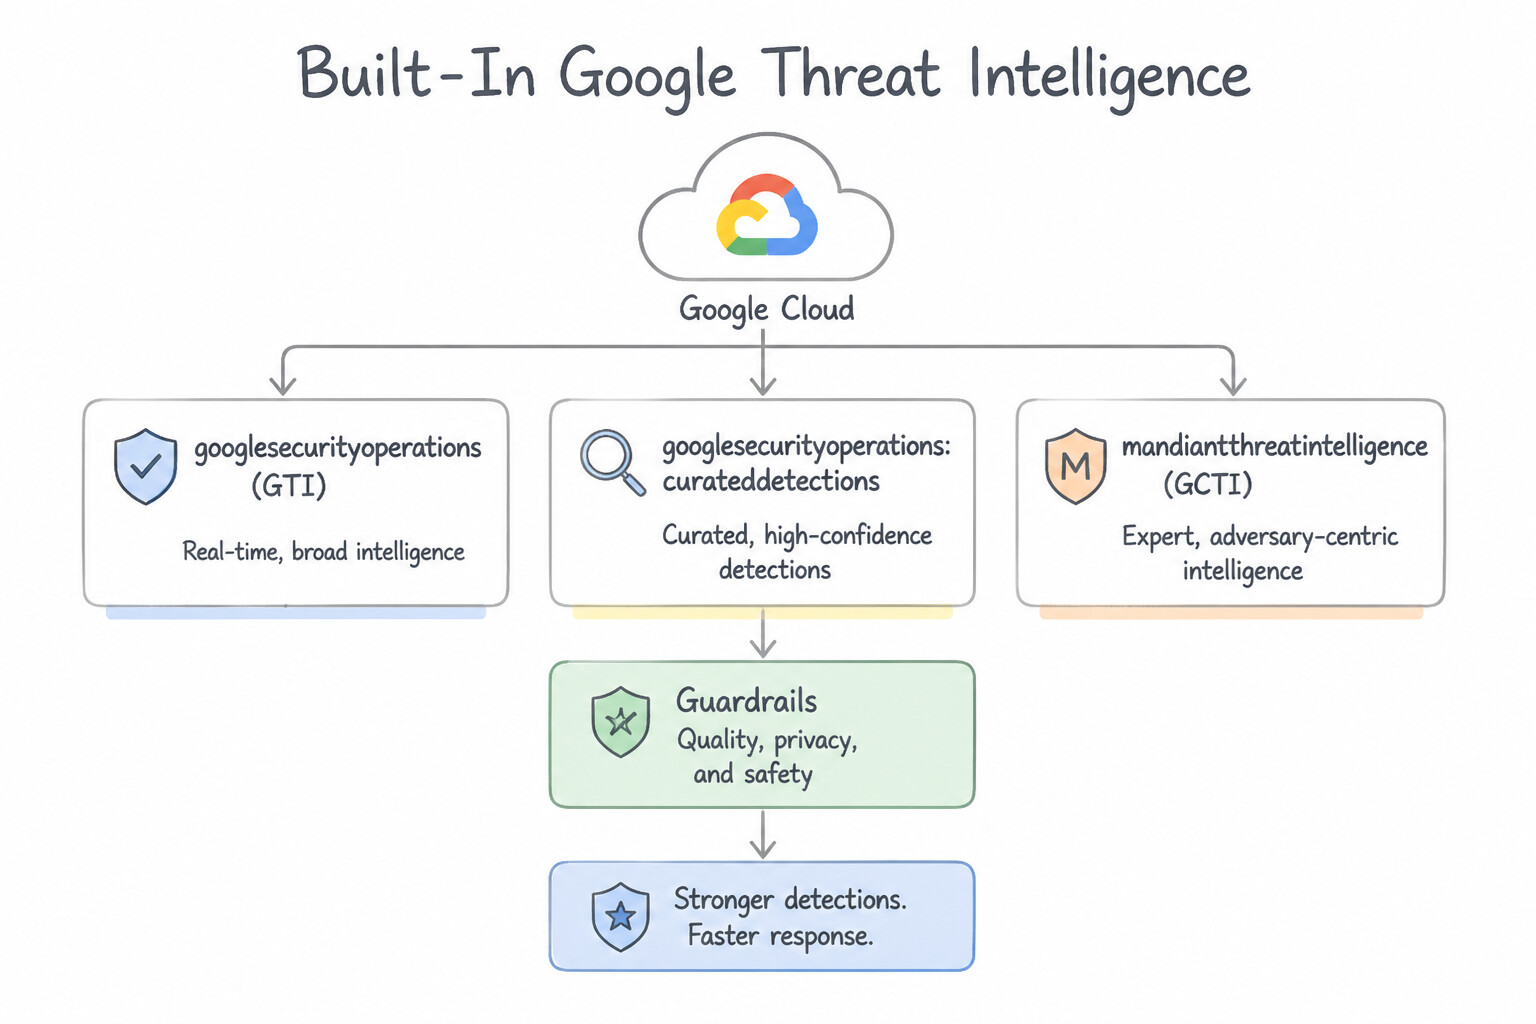
- 1. Built-In Google Threat Intelligence (
GTI/GCTI): Out-of-the-box integration combining Mandiant Frontline intelligence (APT campaigns, malware families, Fin/UNC actor groups), VirusTotal global file/URL/domain reputation, and Google's planet-scale telemetry (Passive DNS, WHOIS, Safe Browsing). - 2. Industry-Specific & Third-Party Feeds (
STIX/TAXII,MISP,FS-ISAC,H-ISAC): Ingested into SecOps via Feed Management or Reference Lists to track sector-specific adversaries targeting financial, healthcare, or energy verticals. - 3. Internal / First-Party Telemetry Intelligence: Adversary infrastructure discovered during your own SOC's past incident investigations or purple-team exercises.
- Filtering Relevant Intel by Industry, Region & Confidence (
IC-Score): - Raw threat feeds contain millions of noisy or expired indicators (such as shared CDN IPs or sinkholed domains). Baseline enrichment prioritizes indicators with high Confidence Score (
IC-Score), recentlast_seentimestamps, and severity/threat actor alignment with your enterprise's technology stack (e.g., prioritizing Linux/Kubernetes and cloud IAM TTPs for a GKE-heavy cloud environment).
Key Implementation Patterns
- Integrating Curated Threat Intelligence: Use Enable Curated Detections in the Google Security Operations console. Curated Detections provide managed, high-fidelity rules powered by Mandiant threat intelligence to identify threats with context and low false positives. (Avoid alternative: Custom YARA-L rules on static lists are manual, high-maintenance, and do not offer the rich context or attribution of curated intelligence.)
- Filtering TI via Asset Criticality: Use Ingest asset context data to enrich events with criticality fields for the destination IP address. Enriching events with asset context allows the platform to automatically determine urgency based on the destination's importance. (Avoid alternative: Manual cross-referencing is inefficient and does not meet the requirement for automated prioritization.)
- Retroactive IoC Matching: Use Review the IoC Matches view to see if the new intelligence has automatically matched against historical data. Google Security Operations automatically matches new threat intelligence against historical data (retroactive matching). (Avoid alternative: Rules focus on detecting threats in future or incoming data, not analyzing historical exposure.)
Key Takeaways (2.2a)
- Curated Detections provide managed, high-fidelity threat detection rules maintained by Google/Mandiant.
- Automated intelligence integration reduces the operational burden of maintaining manual blocklists or custom rules.
- Contextual information (like actor attribution) is crucial for prioritizing alerts effectively.
- Asset Context is Key: Knowing what is being attacked is as important as knowing who is attacking.
Consideration 2.2b: Differentiating event and entity data log sources (e.g., Cloud Audit Logs, Active Directory organizational context)
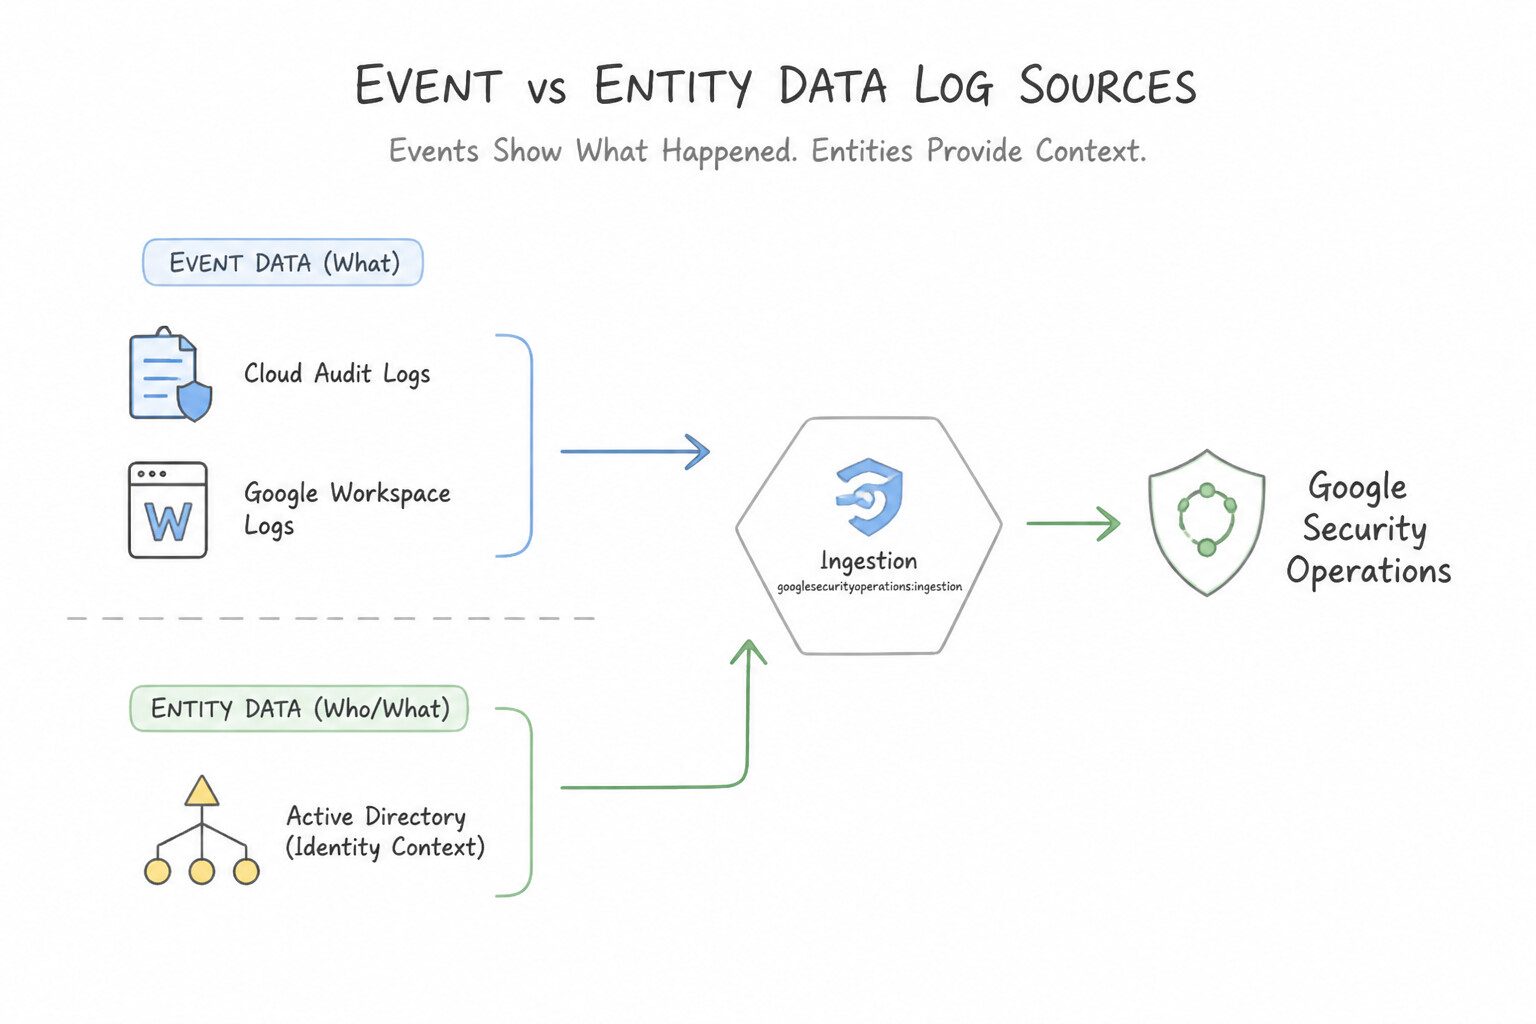
Google Cloud architecture frequently tests whether you can distinguish UDM Event records from UDM Entity records and identify which top-level UDM nouns apply:
UDM EventData Sources (event.idm.read_only_udm.*):- Definition: Represent discrete, immutable actions or transactions that occurred at a specific millisecond (
metadata.event_timestamp). - Examples:
Cloud Audit Logs(USER_RESOURCE_ACCESS),VPC Flow Logs(NETWORK_CONNECTION),Cloud DNS(NETWORK_DNS),EDR Process Creation(PROCESS_LAUNCH),Okta Login(USER_LOGIN),DHCP Lease Assignment(NETWORK_DHCP). - Key UDM Event Actor/Resource Nouns:
principal: The actor or source initiating the activity (the user, process, or client IP).target: The destination resource, user, or server receiving the action.src/intermediary/observer: Source object, proxy/MTA relay, and the firewall/sensor recording the log.about: Additional objects referenced in the event.UDM EntityData Sources (entity.metadata.*+entity.entity.*):- Definition: Represent stateful contextual descriptions of a user, asset, group, resource, or threat indicator over a validity time interval (
metadata.interval). - Examples:
- Identity Context (
entity_type = USER/GROUP):Microsoft Active Directory,Entra ID (Azure AD),Google Cloud Identity,Workday(suppliesuser.title,user.department,user.employee_id,user.managers,user.group_identifiers,user.account_status). - Asset & Vulnerability Context (
entity_type = ASSET/RESOURCE):Security Command Center (SCC) Asset & Vulnerability exports,ServiceNow CMDB,CrowdStrike / Tanium host inventory,Qualys / Tenable scans(suppliesasset.asset_id,asset.hostname,asset.vulnerabilities,asset.software, cloud labels). - Threat Context (
entity_type = FILE/DOMAIN_NAME/IP_ADDRESS):GTI / Mandiant / VirusTotalIOC feeds andWHOISrecords.
Key Implementation Patterns
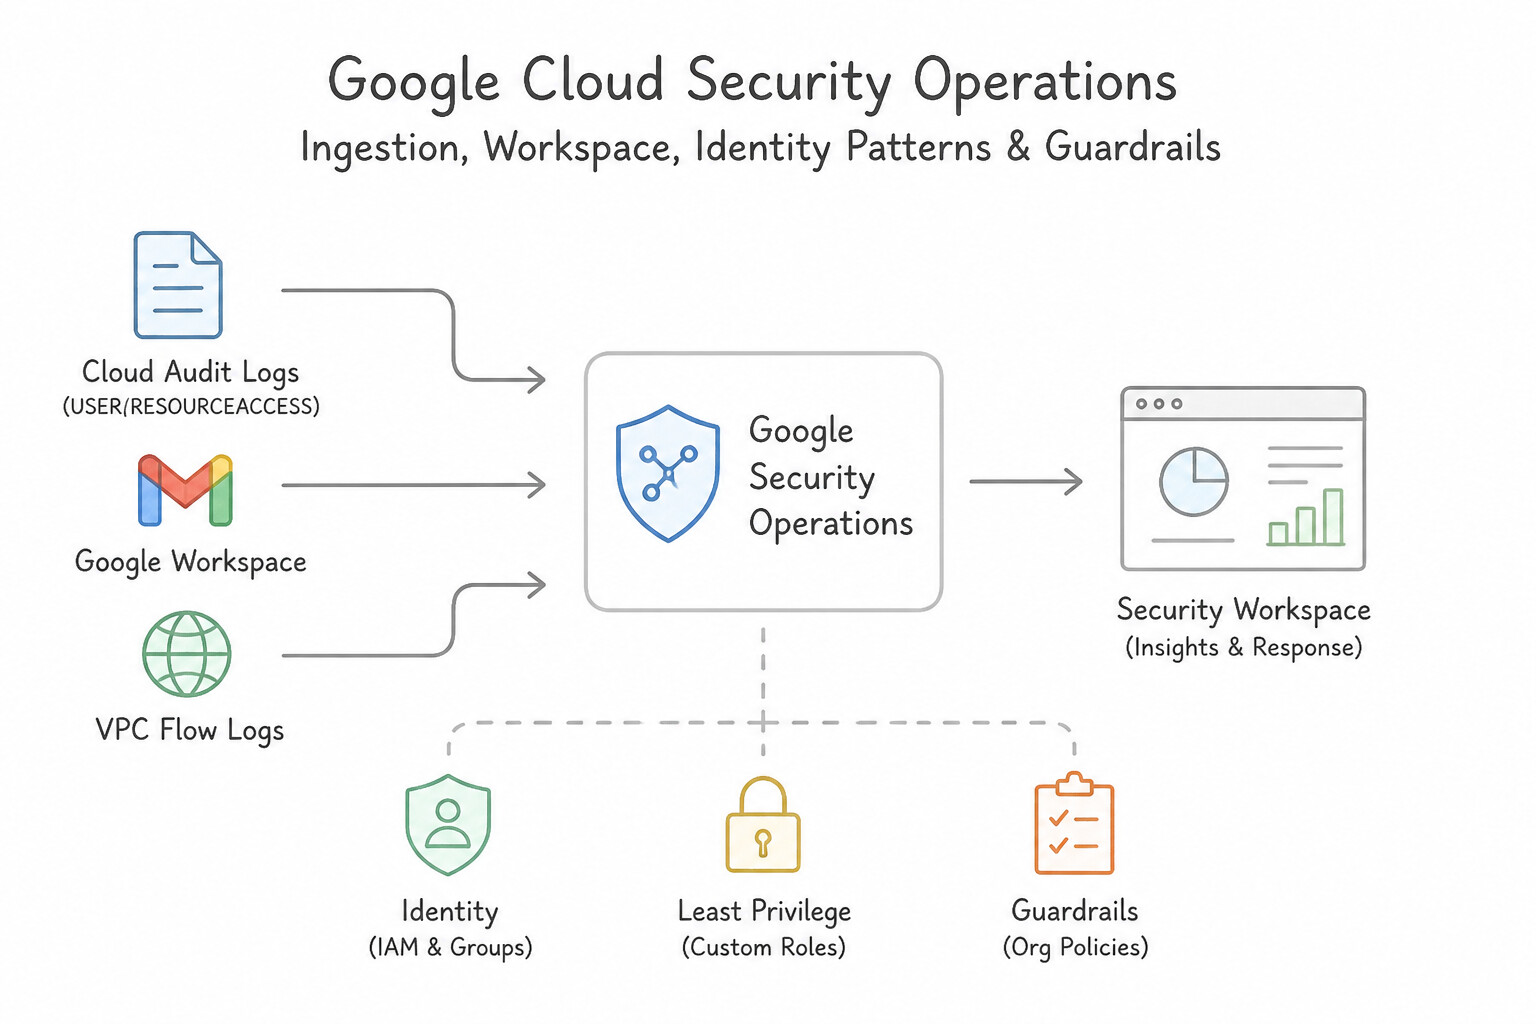
- Google Workspace Context vs. Audit Logs: Use Ingest both Google Workspace Audit Logs and Google Cloud Identity User Context. You need Audit Logs for the activity events and User Context for the organizational attributes. (Avoid alternative: Audit logs provide the event activity but lack the user's organizational attributes.)
- Cloud Audit Logs vs. Asset Inventory: Use Join the Cloud Audit Log event with entity context data from Google Cloud Asset Inventory. Entity data from Cloud Asset Inventory stores resource metadata (labels) that can be correlated with event logs. (Avoid alternative: You cannot query the API for resource details after the resource has been deleted.)
- Active Directory: LDAP vs. Event Logs: Use Configure the ingestion of Active Directory data to populate the Entity Graph. Ingesting Active Directory data provides the necessary entity context (attributes) to enrich user profiles in Google Security Operations. (Avoid alternative: Verbose logging provides more event details but does not synchronize user attributes like department or group membership.)
Key Takeaways (2.2b)
- Events vs. Entities: Security operations rely on correlating 'what happened' (Logs) with 'context about who/what was involved' (Entities).
- Audit Logs: These are the primary source for detecting specific user actions like logins.
- User Context: This data (often from Cloud Identity or Active Directory) enriches alerts with helpful triage metadata like departments or managers.
- Cloud Audit Logs record the action (verb) but not always the full resource state.
Consideration 2.2c: Evaluating event and entity data matches for enrichment using aliasing fields
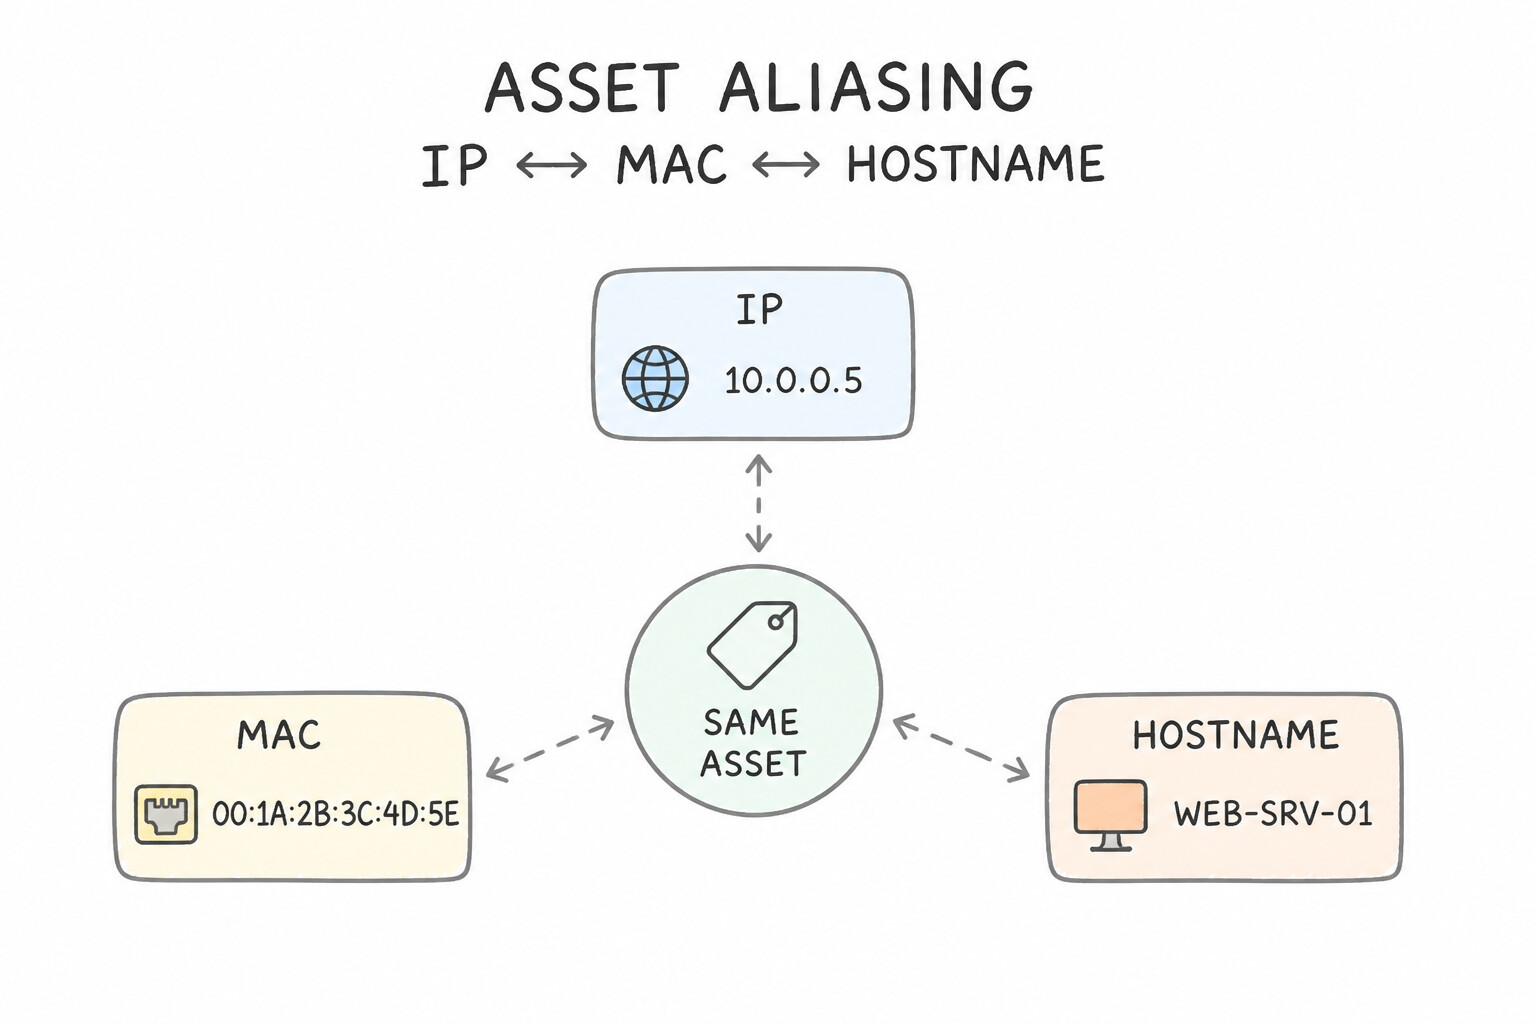
How does Google SecOps join a raw firewall event (containing only principal.ip = "10.20.30.40") with an Active Directory user record or a CMDB asset record? Through Aliasing:
- 1. Asset Aliasing (
IP↔MAC↔Hostname↔Asset ID): - Ephemeral DHCP IP addresses change frequently. If a rule matches on a static IP 6 hours later, it may flag the wrong laptop!
- By continuously ingesting DHCP logs (
NETWORK_DHCP) along with EDR / CMDB asset logs, the Google SecOps aliasing pipeline tracks exactly whichhostnameandmacheld10.20.30.40at the exactmetadata.event_timestampof the firewall event, automatically populatingprincipal.asset.hostnameandprincipal.hostnamein the enriched UDM event! - 2. User Aliasing (
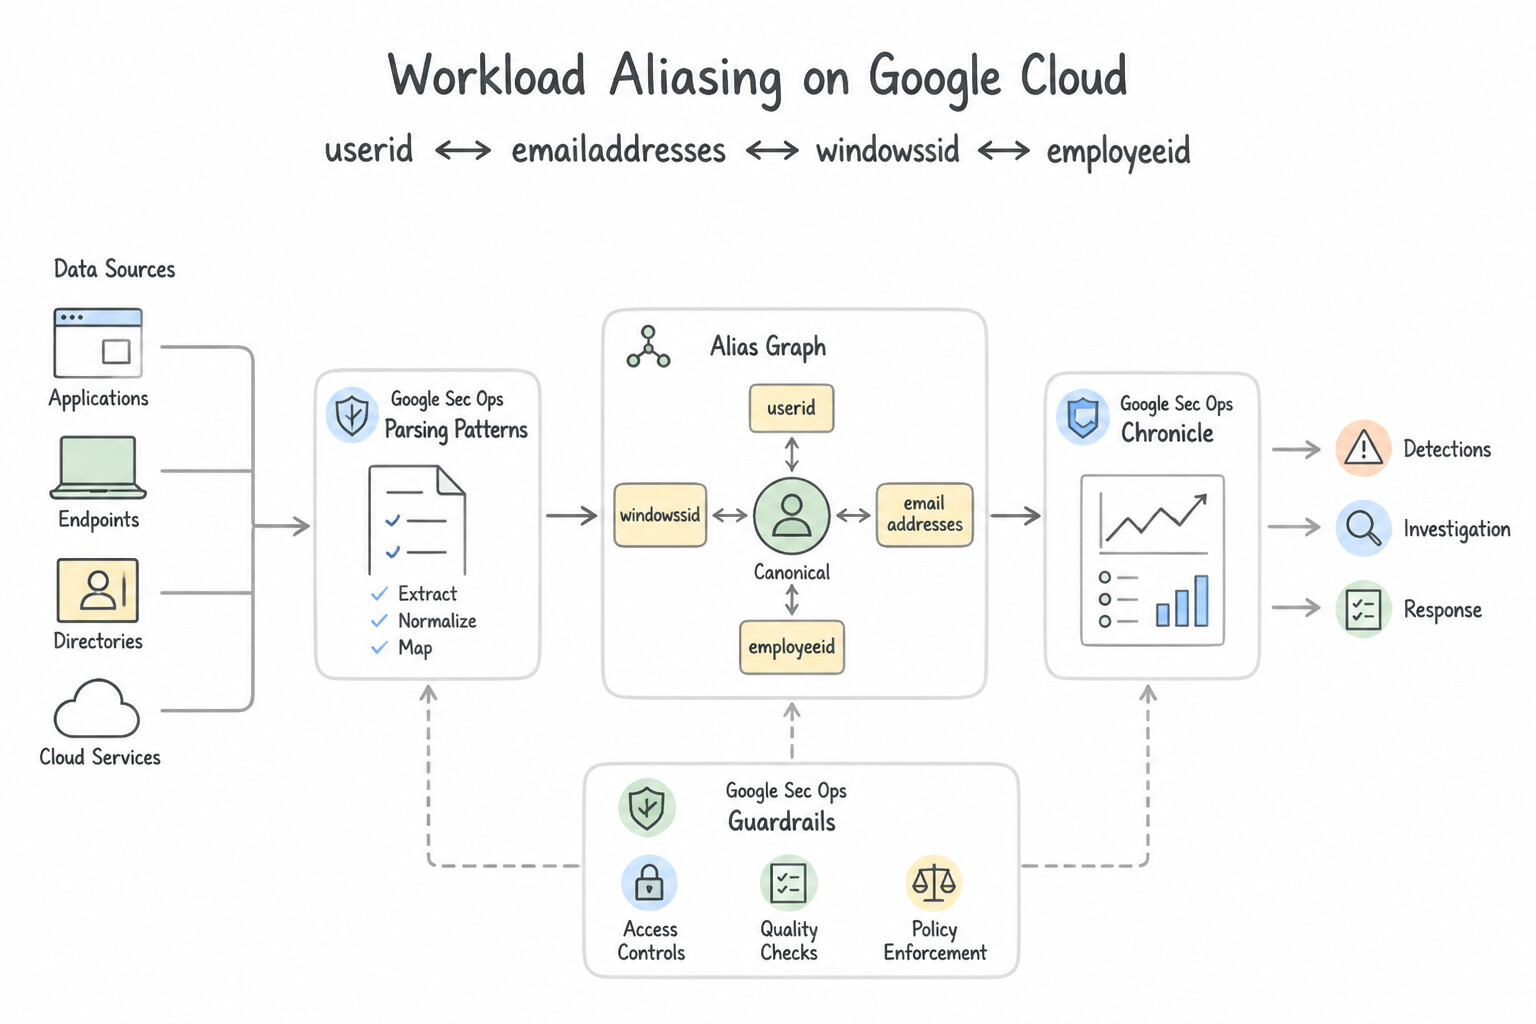
userid↔email_addresses↔windows_sid↔employee_id): - Different log sources log the same human differently: Linux logs
jdoe, Google Workspace logsjane.doe@corp.com, Active Directory logsS-1-5-21-..., and Workday logsEMP-99412. - Ingesting Active Directory (
WINDOWS_AD) and HR (WORKDAY) entity logs allows the aliasing pipeline to unify all four identifiers into a single canonical user entity, enrichingprincipal.user.*across every event log. - 3. Critical Aliasing Requirements & Troubleshooting in Production:
- Namespace Alignment: An event in
namespace = "PROD_VPC"will only alias against DHCP and Entity records innamespace = "PROD_VPC"! If your firewall forwarder setsnamespace = "PROD_VPC"but your DHCP forwarder has an emptynamespace, asset aliasing will fail to match. - Join Key Alignment in YARA-L (
Entity Graph): When joining an Event variable ($e) with an Entity Graph variable ($context) in YARA-L, join on a normalized aliasing field (such as$e.principal.user.userid = $context.graph.entity.user.useridor$e.principal.hostname = $context.graph.entity.hostname).
Key Implementation Patterns
- Handling Ephemeral IP Reassignment: Use Verify that DHCP logs linking the IP address to the workstation's hostname at the event timestamp are ingested. Ingesting DHCP logs provides the necessary time-based mapping between the IP address and the workstation to correct the alias.
- Mapping Custom Parser Fields for Aliasing: Use Modify the parser configuration to map the username value to the principal.user.userid field. The Aliasing engine uses specific fields like principal.user.userid to link events to entities; mapping data here triggers the association.
- Namespace Collisions in Multi-Tenant Logs: Use Update the parsers to populate the
namespacefields (such asprincipal.namespaceandtarget.namespace) with a unique identifier for each company. Namespaces segment identical IP addresses into distinct entities within the aliasing engine.
Key Takeaways (2.2c)
- IP addresses are often ephemeral and reused; they are not unique identifiers over time.
- Accurate asset enrichment depends on ingesting logs (like DHCP) that link IPs to Hostnames or MAC addresses.
- When investigating entity mismatches, check the timestamp of the event against the valid lease time of the asset.
- Parsers must map data to specific UDM fields to trigger product features like Aliasing.
Quick Decision Cheat Sheet (Subsection 2.2)
If the Scenario Requires... | Choose This Google Cloud Pattern | Avoid This Common Mistake |
|---|---|---|
"Differentiate Cloud Audit Logs / VPC Flow Logs from Active Directory / CMDB inventory exports" | Cloud Audit / Flow Logs are UDM Event logs (point-in-time actions); AD / CMDB are UDM Entity logs (stateful context) | Ingesting Active Directory user snapshots as USER_LOGIN event logs |
"Enrich dynamic DHCP IP addresses in proxy/firewall logs with accurate device hostnames over time" | Ingest DHCP logs ( NETWORK_DHCP) to power Google SecOps time-aware Asset Aliasing | Running scheduled reverse-DNS ( PTR) queries hours later during SOAR playbook execution |
"Map jdoe, jane.doe@corp.com, and Windows SID S-1-5-... to the same person in detections" | Ingest Active Directory / Cloud Identity entity context containing all aliases ( userid, email_addresses, windows_sid) | Maintaining separate YARA-L rules for each username format |
"Aliasing is not enriching events even though both DHCP and Firewall logs are parsing cleanly" | Verify that both log sources share the exact same namespace and accurate UTC event_timestamps | Disabling the default firewall parser or increasing YARA-L match windows |
"Determine which UDM top-level field holds the actor, the recipient resource, and the logging sensor" | Actor = principal · Recipient = target · Logging sensor/appliance = observer | Putting the actor in src when principal is expected, or putting the firewall IP in target |
Further Reading (Subsection 2.2)
- Use the curated detections page — Documentation explaining how Curated Detections work, how to enable them, and the value they add through Mandiant threat intelligence.
- Ingestion methods and data types — This documentation explains how Google Security Operations (Chronicle) ingests context data (like asset information) to enrich UDM events, allowing for better prioritization and analysis.
- View alerts and IOC matches — Documentation explaining how Google Security Operations matches indicators against log data, including the concept of retroactive matching functionality.
- Ingest Google Cloud data — Documentation describing how to ingest user context data from Google Cloud Identity into Google Security Operations.
- Audit logs for Google Workspace — Overview of the audit logs available for Google Workspace, including login audits.
- Cloud Audit Logs overview — Provides details on what information is contained in Admin Activity logs.
Book TOC · Previous · Chapter 2 of 7 · Next
AwesomeGCP.com Learning
The approach taken is a question-led learning approach: you explore realistic project scenarios where you need to make decisions or take actions to achieve business goals within specific constraints. Instead of passive learning, you are challenged to think and work through the options to master the Professional Security Operations Engineer (PSOE) certification!