Book TOC · Previous · Chapter 3 of 6 · Next
Chapter 3: Applying Site Reliability Engineering (SRE): SLIs/SLOs, Error Budgets, Autoscaling & Incident Command
Chapter Focus: SLI selection (Request/Window), SLO targets, Error Budget policy enforcement, toil elimination, MIG/GKE/Cloud Run autoscaling, traffic draining, canary rollbacks, Incident Command System (ICS), and blameless postmortems.
Subsection 3.1: Balancing change, velocity, and reliability of the service
The Big Picture
Traditional IT operations and product development are locked in a structural conflict: Product Developers are incentivized to ship features as fast as possible (maximizing change velocity), while traditional SysAdmins are incentivized to change nothing so nothing breaks (minimizing instability). Google Site Reliability Engineering (SRE) resolves this deadlock mathematically through SLIs, SLOs, SLAs, and Error Budgets:
- Measuring Server Internals Instead of User Happiness (3.1a): A cluster can have 35% CPU utilization and 0 pod restarts while 100% of users receive HTTP 500 errors due to an expired database certificate or a broken load balancer route. Service Level Indicators (
SLIs) must measure the critical user journey from the user's perspective—typically measured at the Load Balancer or Cloud Service Mesh proxy as the ratio of Good Events / Total Valid Events. - The Trap of Chasing 100% Reliability (3.1c): Every additional "nine" of reliability ($99.9\% → 99.99\% → 99.999\%$) increases engineering cost by an order of magnitude while drastically slowing feature delivery—and if the user's cellular ISP is only $99.5\%reliable, users cannot even perceive the difference between @@ESCAPEDDOLLAR@@99.9% and $99.999\%$! Setting an SLO at the lowest reliability level that keeps users happy preserves room for innovation.
- Treating Error Budgets as Suggestions (3.1b): The Error Budget ($100\% - \text{SLO}$) converts reliability from a political debate into an objective engineering currency. As long as the service has remaining error budget over its rolling window (e.g., 28 or 30 days), the product team can ship risky features and architectural migrations freely. The moment the error budget hits zero, an executive-backed Error Budget Policy freezes feature launches until reliability is restored.
Consideration 3.1a: Defining SLIs (e.g., availability, latency), SLOs, and SLAs
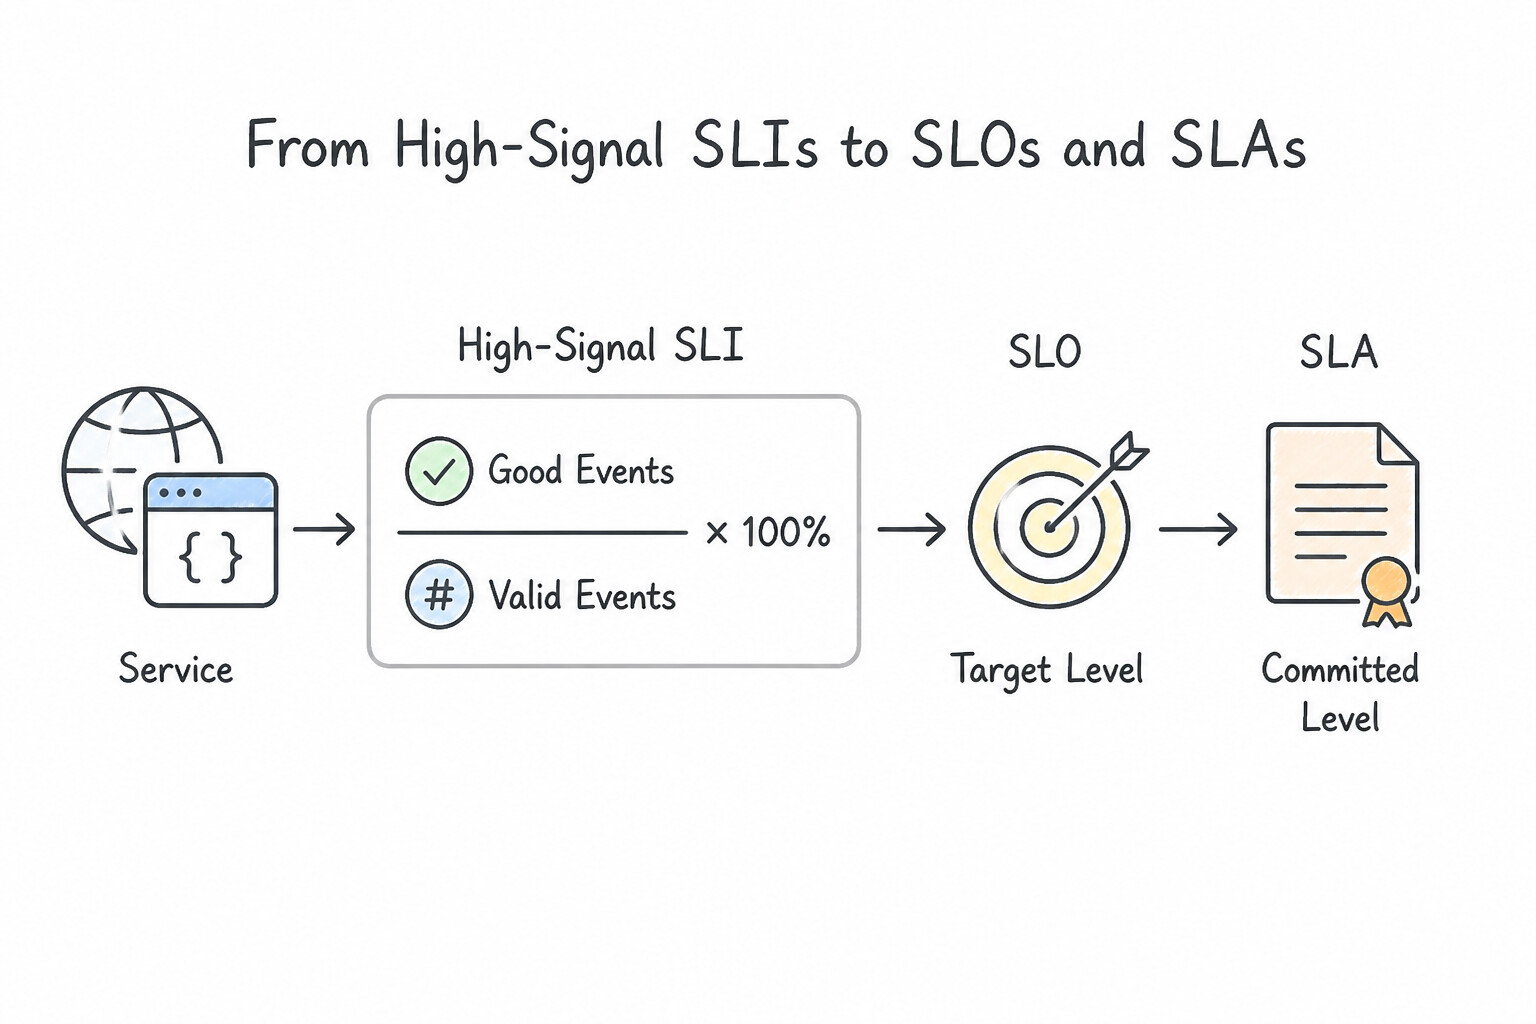
- Defining High-Signal SLIs (
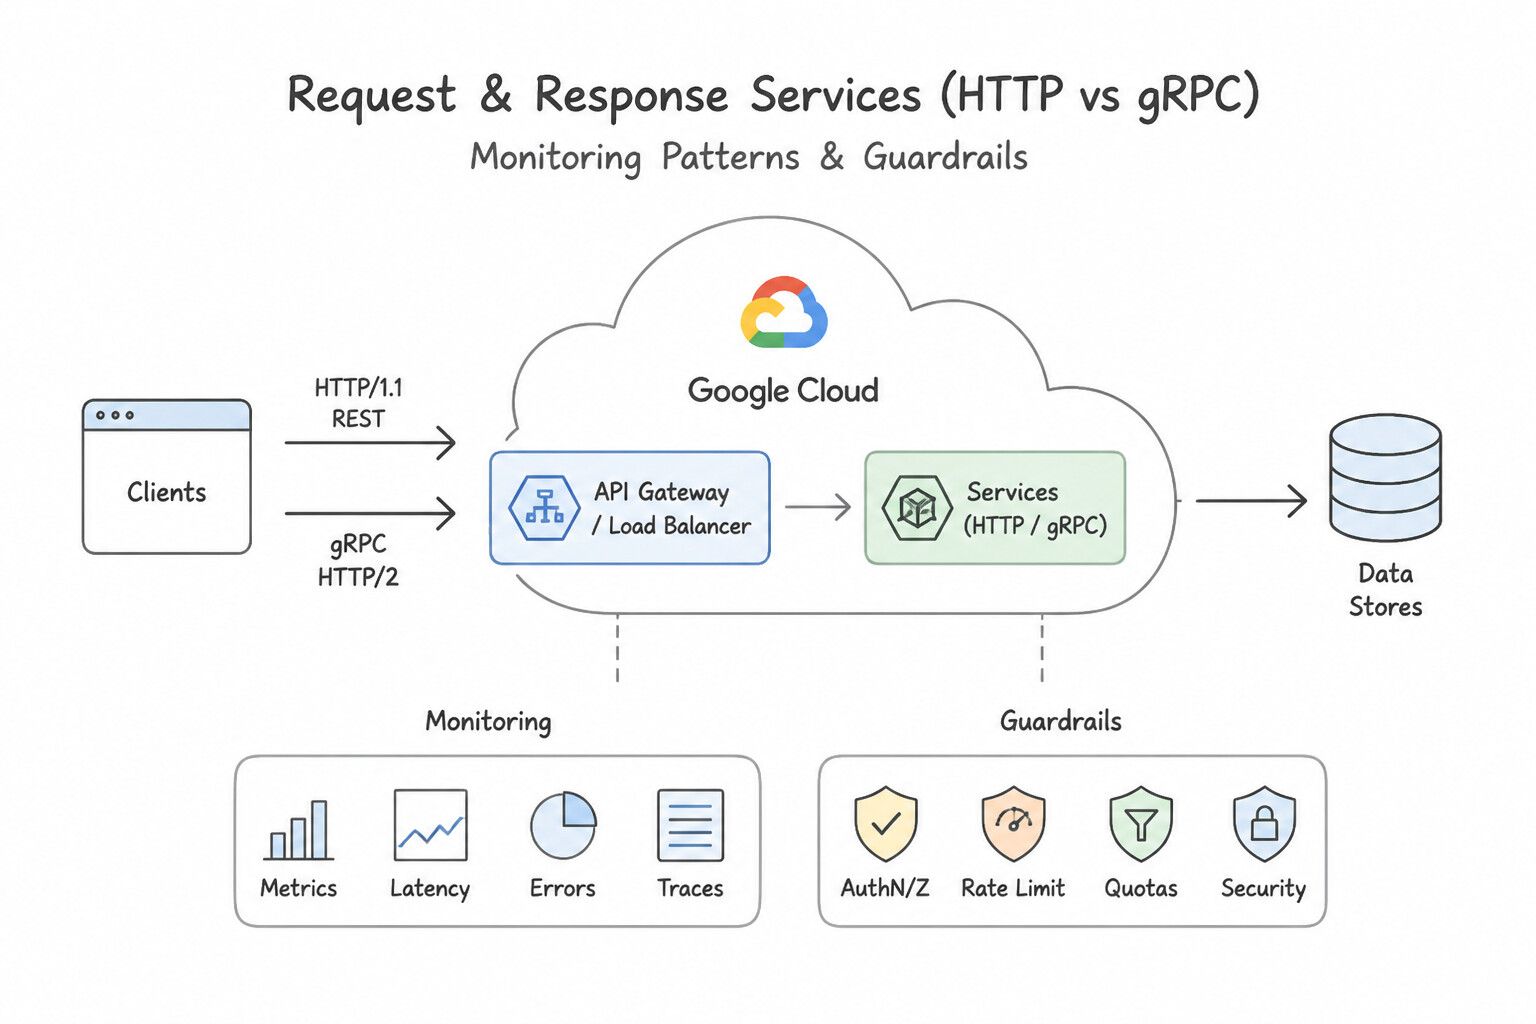
SLI = Good Events / Valid Events × 100%—3.1a): - Request/Response Services (HTTP/gRPC APIs):
- Availability SLI: Proportion of valid requests that return a successful status. Key Architectural Rule: Count
HTTP 2xx,3xx, and client-error4xx(such as400 Bad Request,401 Unauthorized,404 Not Found, usually excluding429 Too Many Requests) as GOOD/SUCCESSFUL server responses (because the server operated correctly when rejecting an invalid client request!), and countHTTP 5xxas BAD responses! - Latency SLI: Proportion of valid requests served faster than a threshold (e.g., 99% of checkout requests complete in < 400 ms). Always evaluate latency using percentiles (
p90,p95,p99) / Histogram Distributions, never arithmetic averages (mean), because a fast average hides long-tail latency affecting your highest-value customers. - Asynchronous / Data Processing Pipelines: Measure Throughput (bytes/records processed per second), End-to-End Freshness (age of the most recently processed watermark), and Correctness (proportion of records producing valid outputs).
- Storage Systems: Measure Availability, Latency, and Durability (verify via periodic restore tests, not just backup job exit codes).
- Distinguishing
SLIvs.SLOvs.SLA(3.1a): - SLI (Indicator): The actual quantitative measurement ($99.92\%$ successful requests over the last 28 days).
- SLO (Objective): The internal engineering target for that SLI (≥ 99.9% over 28 days).
- SLA (Agreement): The external legal contract with customers containing financial credits/penalties. Always set the internal SLO stricter/higher than the external SLA (e.g., SLO = 99.9%, SLA = 99.5%) to create an early-warning safety buffer.
Key Implementation Patterns
- Distinguishing SLIs, SLOs, and SLAs: Use Define a Service Level Indicator (SLI). An SLI is the specific quantitative measure of a service's behavior, such as latency or availability. (Avoid alternative: An SLA is a business contract with consequences, not the direct technical measurement of behavior.)
- Selecting SLIs for Batch Processing: Use Define an SLI based on the proportion of batch runs that successfully complete with valid data by 8 AM. Batch jobs prioritize data freshness and correctness by a specific deadline. (Avoid alternative: Latency is a metric for interactive services, not for batch processing deadlines.)
Key Takeaways (3.1a)
- SLI (Indicator): The measurement (What is the latency?).
- SLO (Objective): The target (What should the latency be?).
- SLA (Agreement): The contract (What happens if we miss the target?).
- Error Budget: The allowed unreliability (How much can we fail before stopping new releases?).
Consideration 3.1b: Error budgets (e.g., Cloud Service Mesh definitions)
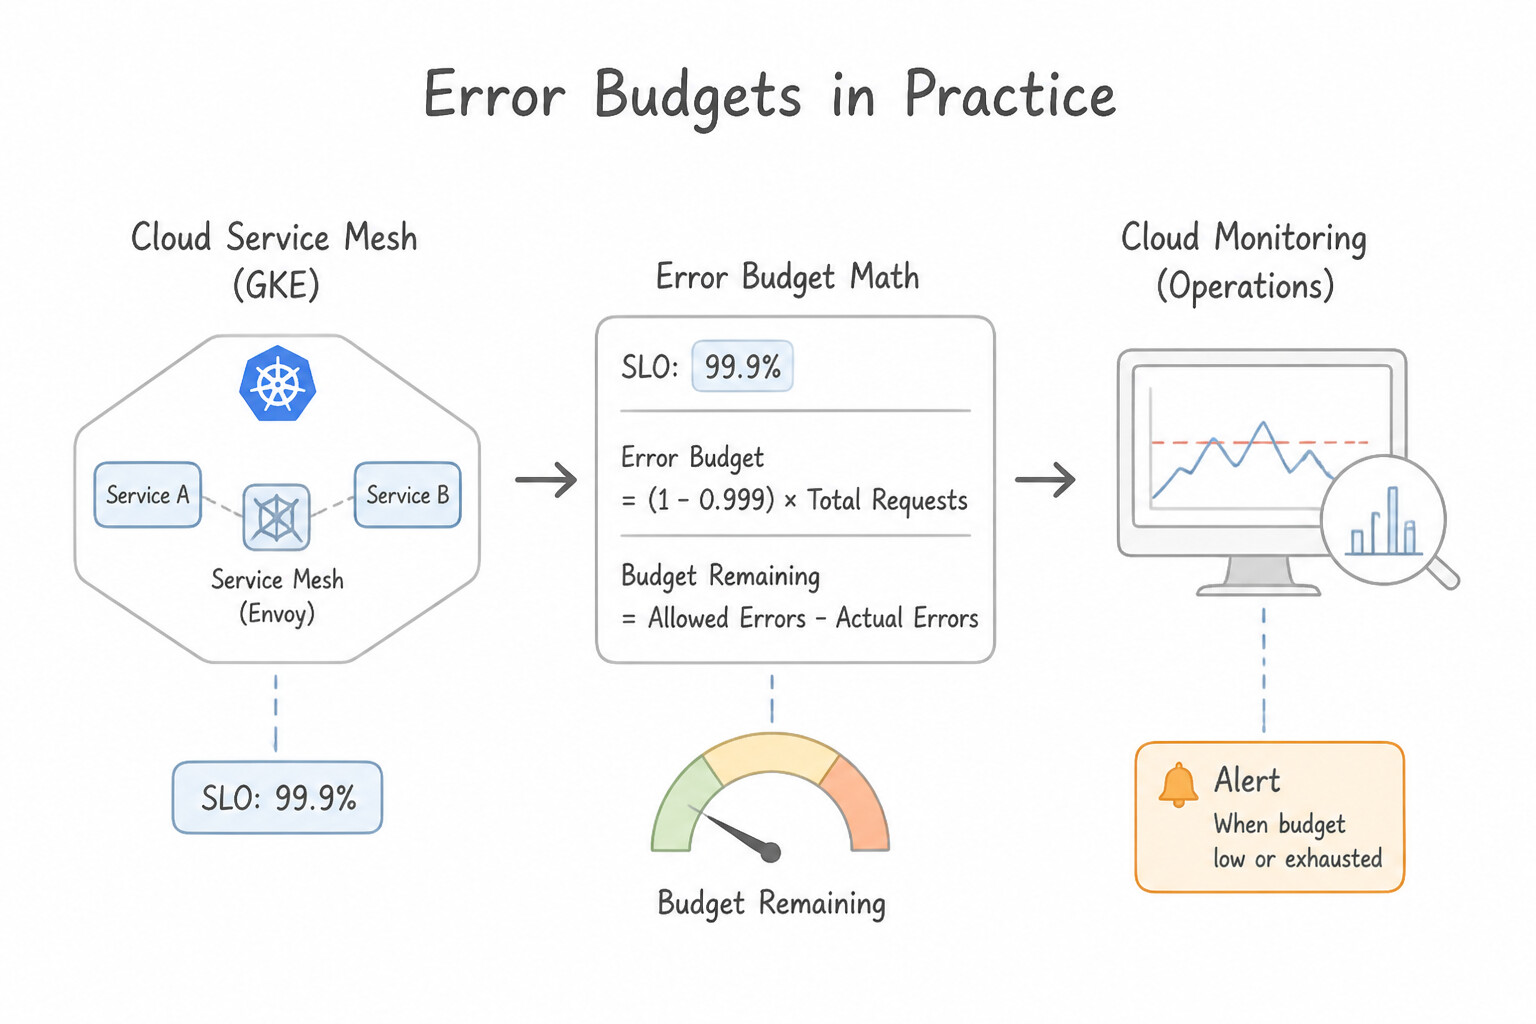
- Error Budget Math & Cloud Service Monitoring (3.1b):
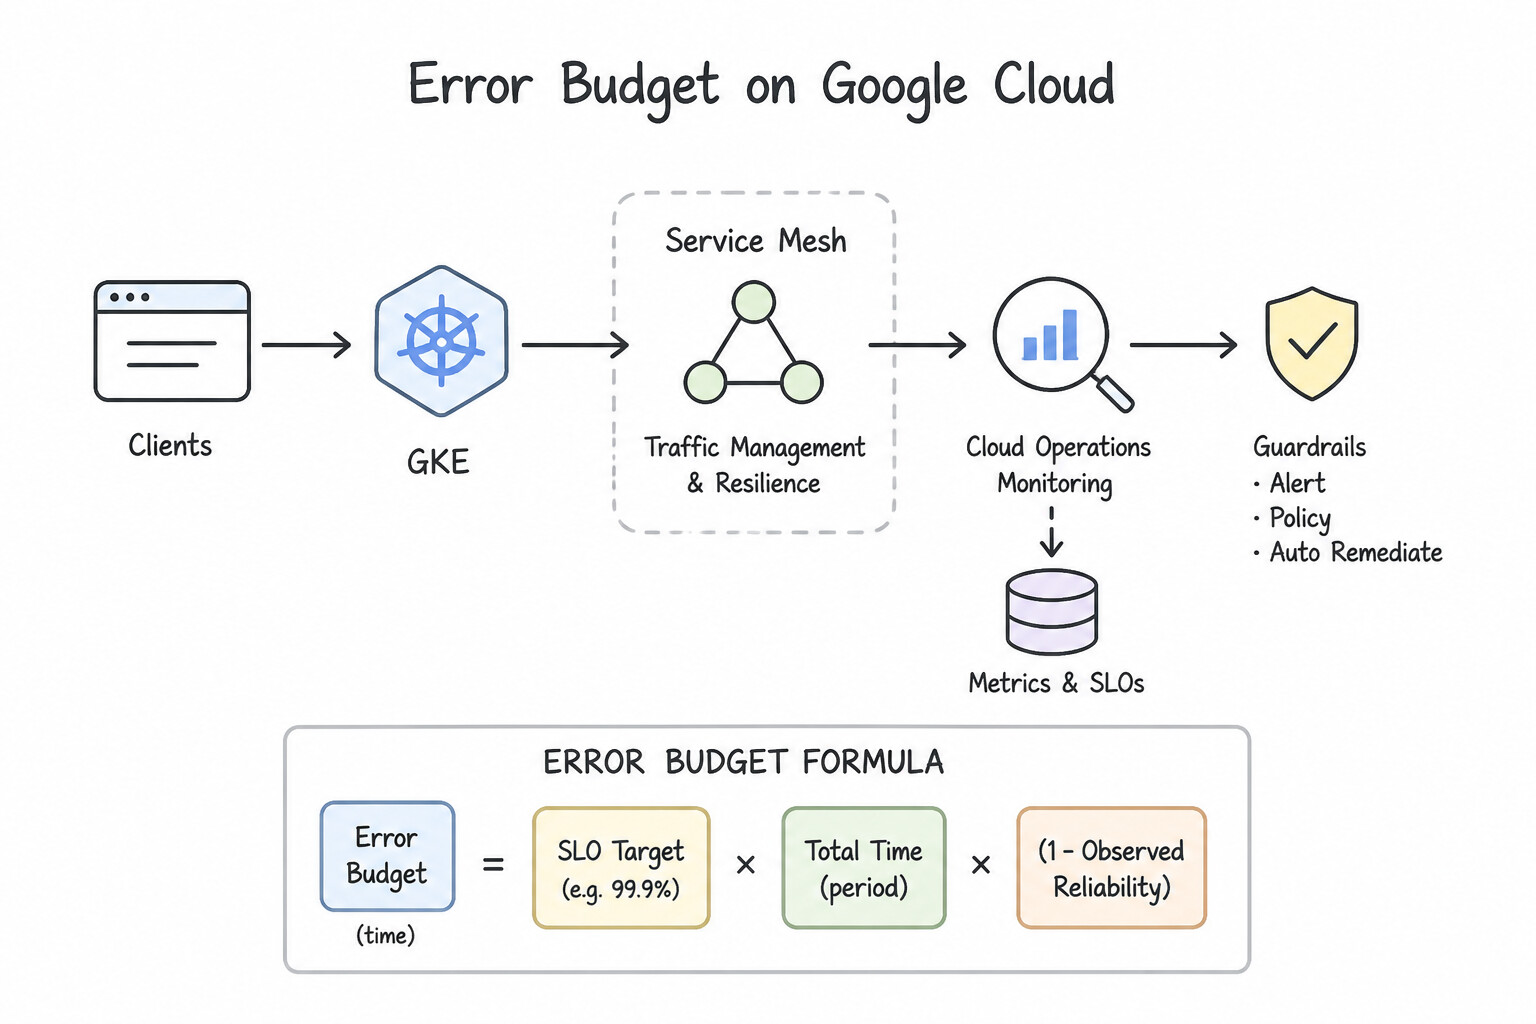
- Error Budget Formula: Error Budget = 1 - SLO.
- For a request-based SLO of $99.9\%$ on a service handling $10,000,000$ requests per month, the error budget is $0.001 \times 10,000,000 = \mathbf{10,000\text{ failed requests}}$.
- For a windows-based / uptime SLO over a 30-day month ($43,200\text{ minutes}$):
- $99.0\%$ ("Two Nines") $→ \mathbf{432\text{ minutes}}(@@ESCAPEDDOLLAR@@7.2 hours) of error budget.
- $99.9\%$ ("Three Nines") $→ \mathbf{43.2\text{ minutes}}$ of error budget.
- $99.99\%$ ("Four Nines") $→ \mathbf{4.32\text{ minutes}}$ of error budget.
- Cloud Service Mesh (
CSM) & Cloud Monitoring SLOs: Both Cloud Service Mesh and Cloud Monitoring Service Monitoring automatically extract request-based and windows-based SLIs (latency, availability) from Envoy sidecar proxies, GKE, Cloud Run, App Engine, and Load Balancers—letting you configure rolling (28d/30d) or calendar-month SLOs and Error Budget Burn-Rate alerts with zero custom code. - Enforcing the Error Budget Policy: An Error Budget Policy must be agreed upon jointly by Product Management, Engineering, and SRE leadership before an outage happens. When a single bad release or incident consumes 100% of the error budget, feature launches stop (except urgent security patches and P0 bug fixes) until the rolling error budget recovers.
Key Implementation Patterns
- Defining SLOs with Cloud Service Mesh Metrics: Use Create an SLI using the
istio_requests_totalmetric. Filter the metric byresponse_codeto count non-5xx responses as successful. Cloud Service Mesh sidecars automatically export theistio_requests_totalmetric, which allows you to calculate availability based on HTTP response codes. - Calculating Error Budget Compliance: Use 10,000 requests. An SLO of 99.9% leaves a 0.1% error budget. 0.1% of 10 million is 10,000. (Avoid alternative: 1,000 requests corresponds to a 99.99% SLO, not 99.9%.)
- Error Budget Exhaustion Policy: Use Halt the release of the new feature. Direct engineering efforts toward reliability improvements until the service recovers enough error budget. When an error budget is exhausted, SRE best practices dictate halting non-essential releases to focus on reliability.
Key Takeaways (3.1b)
- Availability SLOs are typically calculated as the ratio of successful requests to total requests.
- Cloud Service Mesh (Istio) sidecars automatically provide the
istio_requests_totalmetric.- Avoid using infrastructure metrics (like CPU or Restart Count) for service-level availability objectives.
- Standard metrics allow for observability without application code instrumentation.
Consideration 3.1c: Opportunity cost of risk and reliability (e.g., number of "nines")
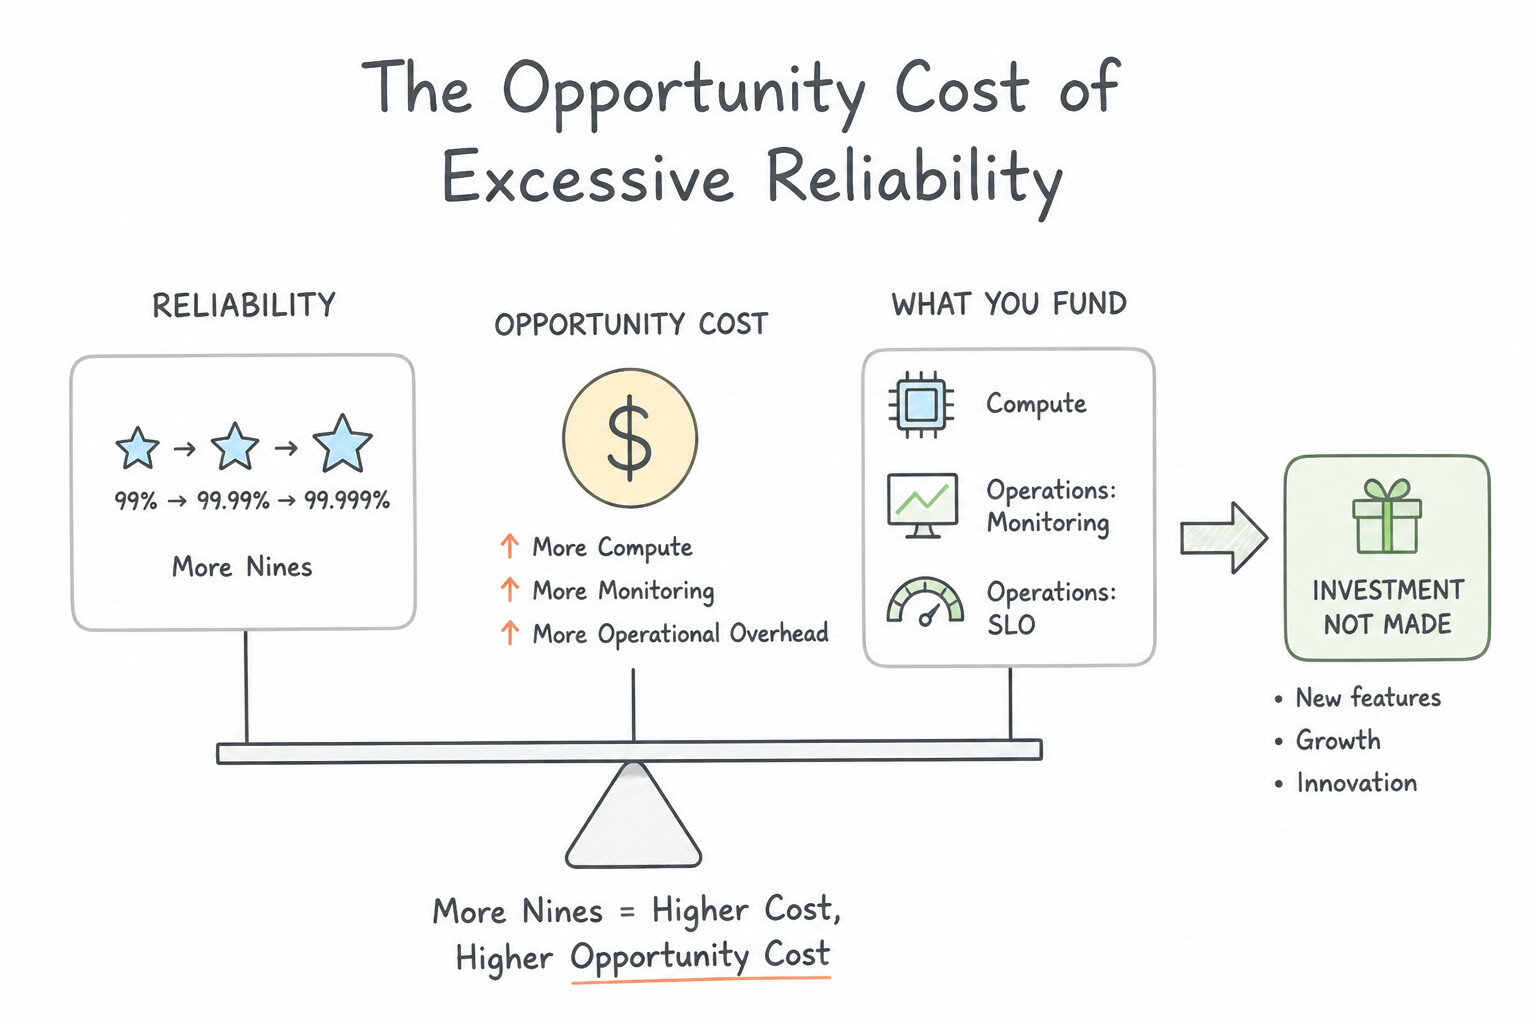
- The Opportunity Cost of Excessive Reliability (3.1c):
- Moving from $99.9\%(regional multi-zone) to @@ESCAPEDDOLLAR@@99.99% or $99.999\%$ (active-active global multi-region with Spanner, automated zero-touch failover, and strict canary soak times) multiplies infrastructure costs and slows developer velocity.
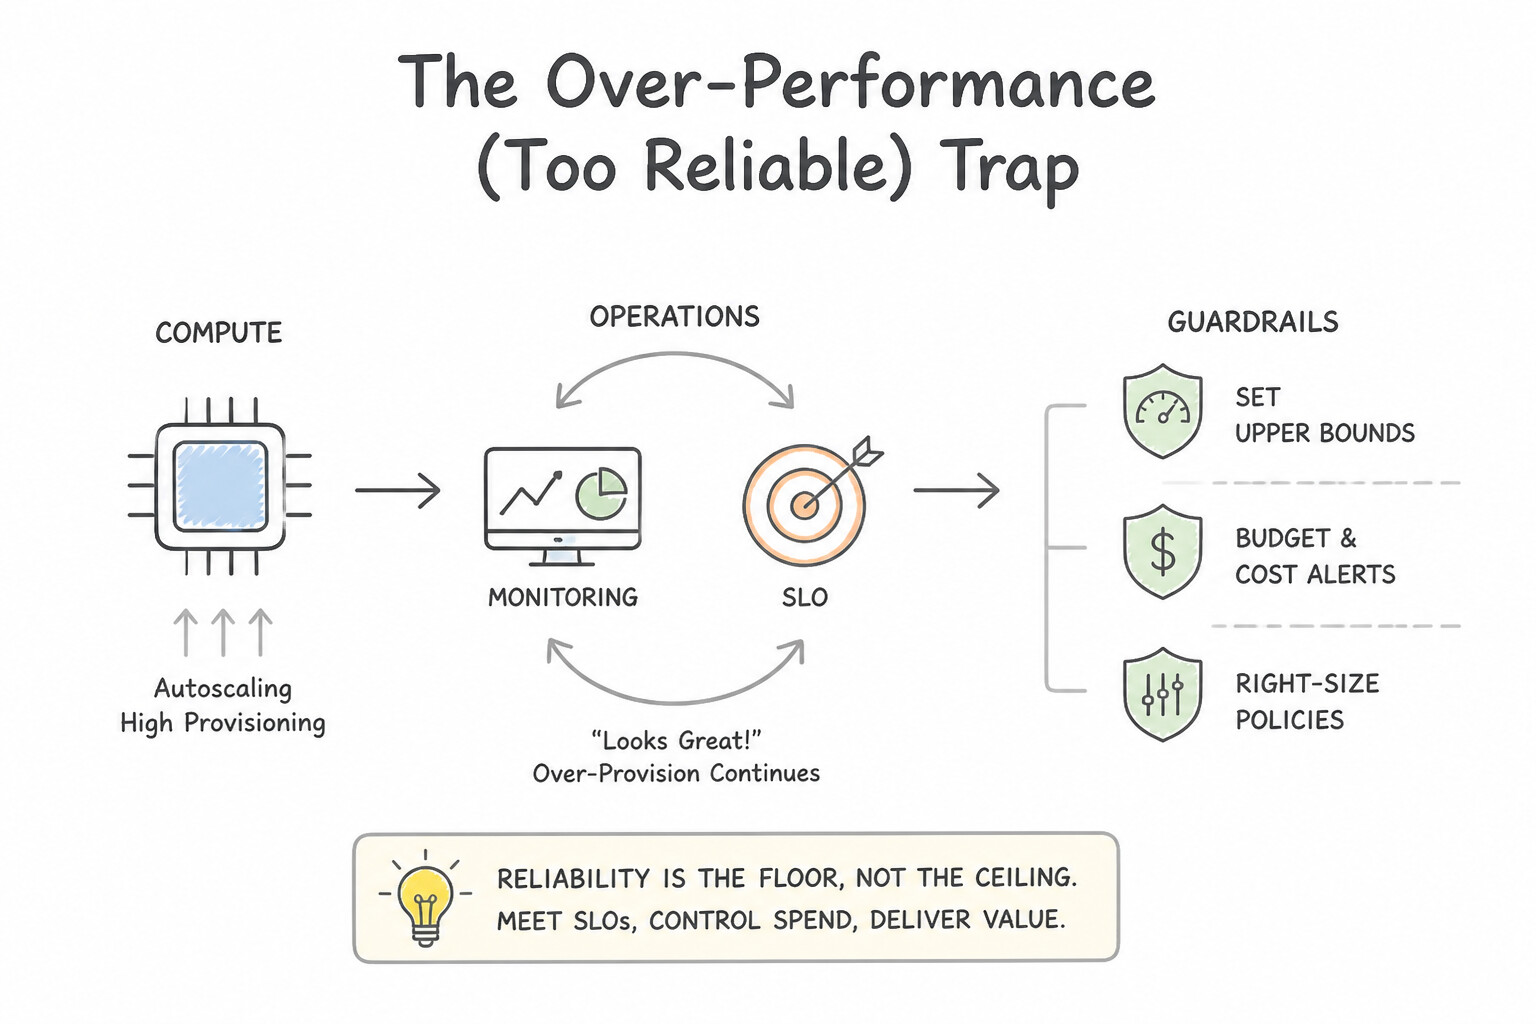
- The Over-Performance ("Too Reliable") Trap: If a service's published SLO is $99.9\%, but it consistently runs at @@ESCAPEDDOLLAR@@99.999% for two years, downstream internal callers will implicitly design their systems assuming your service never fails (omitting retries, circuit breakers, and fallbacks). When your service finally has a legitimate 15-minute maintenance window (well within its $99.9\%$ SLO!), all downstream callers crash. Google SRE recommends setting SLOs no higher than users actually need, and occasionally injecting controlled downtime (planned maintenance / Chaos testing) or spending surplus error budget on faster feature releases so callers respect the documented SLO boundary.
Key Implementation Patterns
- Diminishing Returns of excessive Nines: Use Present a cost-benefit analysis showing that the cost of higher reliability outweighs the business value. You should align reliability targets with business value and avoid unnecessary engineering costs. (Avoid alternative: Implementing complex changes without business justification wastes resources.)
- Dependency Reliability Constraints: Use Adjust the service availability target to 99.9% or lower. A service cannot be more reliable than its critical dependencies, so you must lower the target to match the database's 99.9% limit. (Avoid alternative: You cannot increase reliability by setting a higher target; the dependency limits the maximum possible availability.)
- Error Budget Exhaustion and Feature Freeze: Use Halt new feature deployments and focus on reliability improvements until the service is stable. When an error budget is exhausted, SRE principles dictate a feature freeze to restore reliability. (Avoid alternative: Ignoring the error budget violates SRE principles and risks severe system instability.)
Key Takeaways (3.1c)
- Reliability is not free: Every increase in availability target (adding a nine) increases cost and complexity exponentially.
- Align with Business Value: Do not engineer for higher reliability than the users actually need or than the business can justify financially.
- Opportunity Cost: Engineering time spent on unnecessary reliability is time not spent on feature development.
- A service's maximum availability is limited by its critical dependencies.
Quick Decision Cheat Sheet (Subsection 3.1)
If the Scenario Requires... | Choose This Google Cloud Pattern | Avoid This Common Mistake |
|---|---|---|
"Checkout dashboard shows healthy 120ms average latency, but enterprise customers with large carts experience 8-second timeouts" | Switch the Latency SLI from arithmetic average ( mean) to high-percentile distribution (p95 / p99) | Increasing the polling interval of the average latency metric |
"Calculate the allowed monthly downtime in minutes for a 99.9% SLO over a 30-day window" | (1 - 0.999) × 30 × 24 × 60 = 43.2 minutes | $432\text{ minutes}(that's 99.0%) or @@ESCAPEDDOLLAR@@4.32 minutes (that's 99.99%) |
"Internal SLO is 99.9%; Legal asks what availability percentage to put in the customer-facing SLA contract" | Set the external SLA lower/looser than the internal SLO (e.g., 99.5%) so SREs are alerted and can remediate before breaching the legal contract | Setting the SLA higher than the SLO (e.g., 99.99% SLA with a 99.9% SLO) |
"Configure zero-code service-level SLIs, SLOs, and error budget burn-rate dashboards for GKE microservices" | Use Cloud Service Mesh ( CSM) / Cloud Monitoring Service Monitoring | Writing a custom Prometheus scraper that exports CSV files to Cloud Storage |
"Error budget is 100% exhausted, but a critical zero-day CVE patch must be deployed today" | Deploy the critical P0 security patch (Error Budget Policies explicitly exempt critical security patches and fixes that directly restore reliability) | Blocking a P0 security vulnerability patch for 2 weeks waiting for the rolling SLO window to reset |
Further Reading (Subsection 3.1)
- Service Level Objectives — Google's SRE book chapter defining SLIs, SLOs, and SLAs.
- Concepts in Service Monitoring — Documentation on how Google Cloud defines and implements SLIs and SLOs.
- Overview — Google Cloud documentation on defining Service Level Indicators and the distinction between request-based, windows-based, and other metric types.
- Observability overview — Describes how Cloud Service Mesh provides metrics, logs, and traces automatically for services in the mesh.
- SRE error budgets and maintenance windows | Google Cloud Blog — The defining chapter on how error budgets work and the policies required to enforce them effectively.
- Set realistic targets for reliability — Guidance on using error budgets within Google Cloud to measure and manage service reliability.
Subsection 3.2: Managing service lifecycle
The Big Picture
Many engineering teams assume that "the cloud is infinite" and that configuring a simple CPU-based autoscaler guarantees elastic scale. In production, three lifecycle traps shatter that assumption:
- Hitting Hidden Regional Quota Ceilings & Zonal Stockouts (3.2b): An autoscaler is only as good as the underlying quota and physical capacity available in the region. If your Managed Instance Group (
MIG) or GKE Cluster Autoscaler attempts to scale from 20 to 200 VMs during a flash sale, but your project's regionalN2_CPUSquota is capped at 128—or if on-demand GPUs are exhausted in that zone—every scale-out request fails! Production capacity planning combines proactive quota monitoring/alerting, Compute Engine Capacity Reservations for mission-critical baselines, and Dynamic Workload Scheduler (DWS) for flexible GPU/TPU batch/AI allocations. - Autoscaler Thrashing & Wrong Scaling Signals (3.2c):
- Combining Horizontal Pod Autoscaler (
HPA) and Vertical Pod Autoscaler (VPA) on the same CPU/memory metric causes both controllers to fight each other, triggering violent pod eviction loops. - Scaling an asynchronous Cloud Pub/Sub worker fleet on CPU utilization fails whenever workers are I/O-bound (waiting on an external API or database): CPU stays at 15% while the Pub/Sub backlog grows to 5 million messages! Asynchronous consumers must scale on queue depth /
num_undelivered_messagesper pod. - Ad-Hoc Service Launches & Toil Overload (3.2a): Launching a new service into production without a structured Production Readiness Review (
PRR) or retirement plan leaves SRE teams drowning in manual operational toil (which Google SRE strictly caps at < 50% of an engineer's time).
Consideration 3.2a: Service management (e.g., planning, deployment, maintenance, retirement)
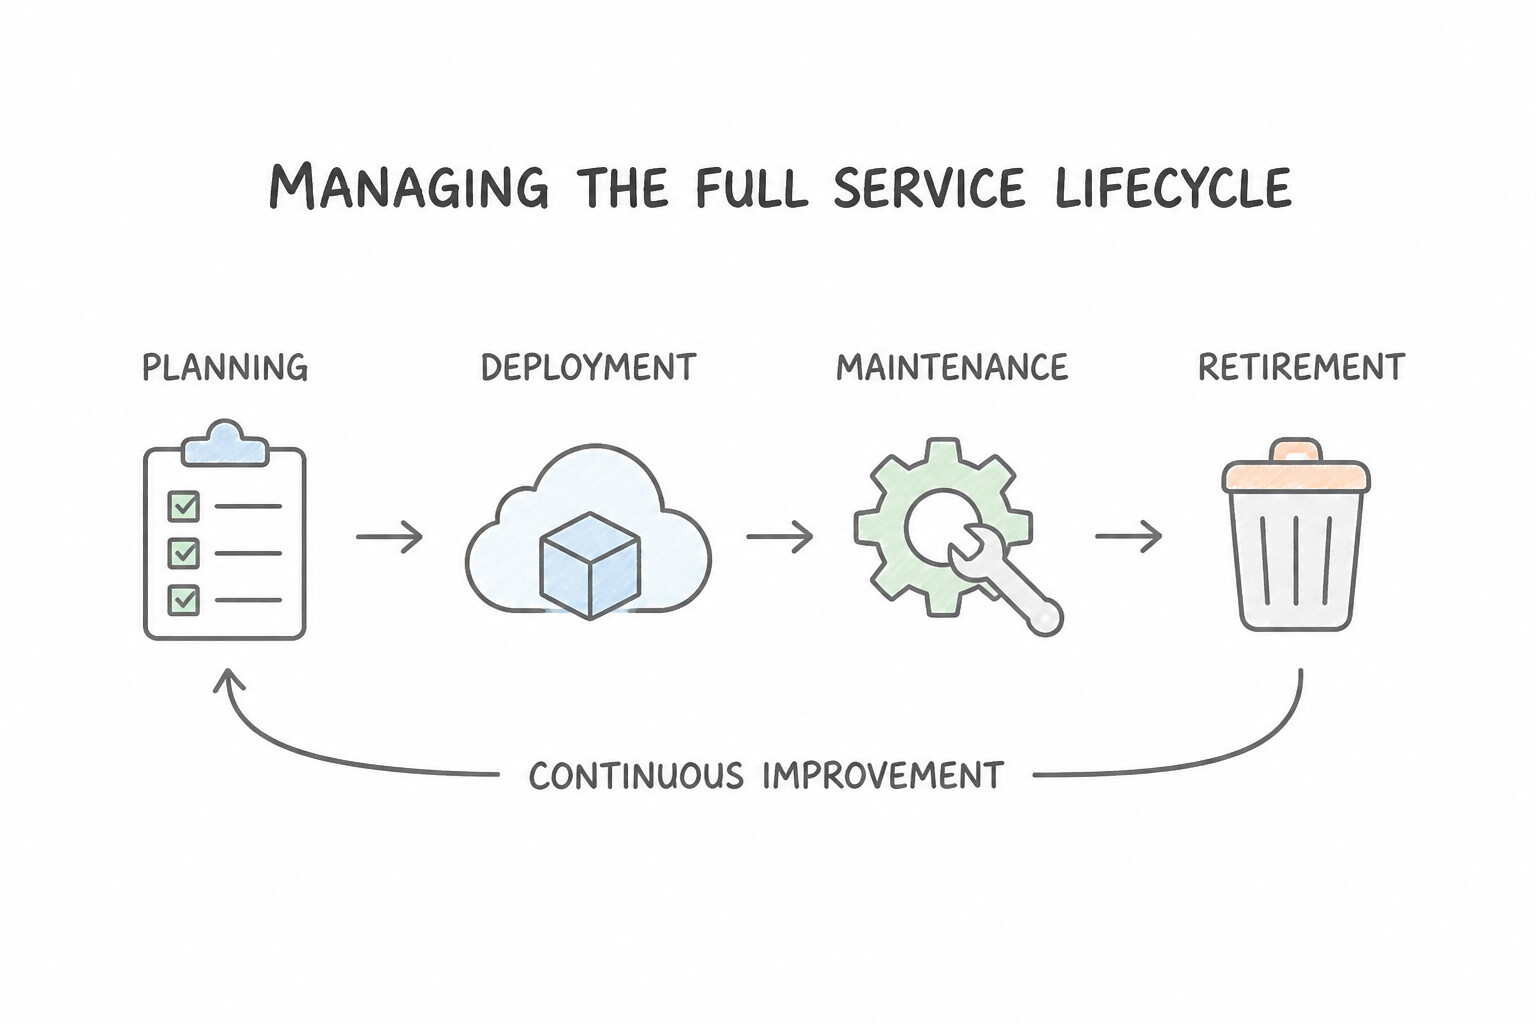
- Managing the Full Service Lifecycle (
Planning→Deployment→Maintenance→Retirement—3.2a): - Planning & Production Readiness Review (
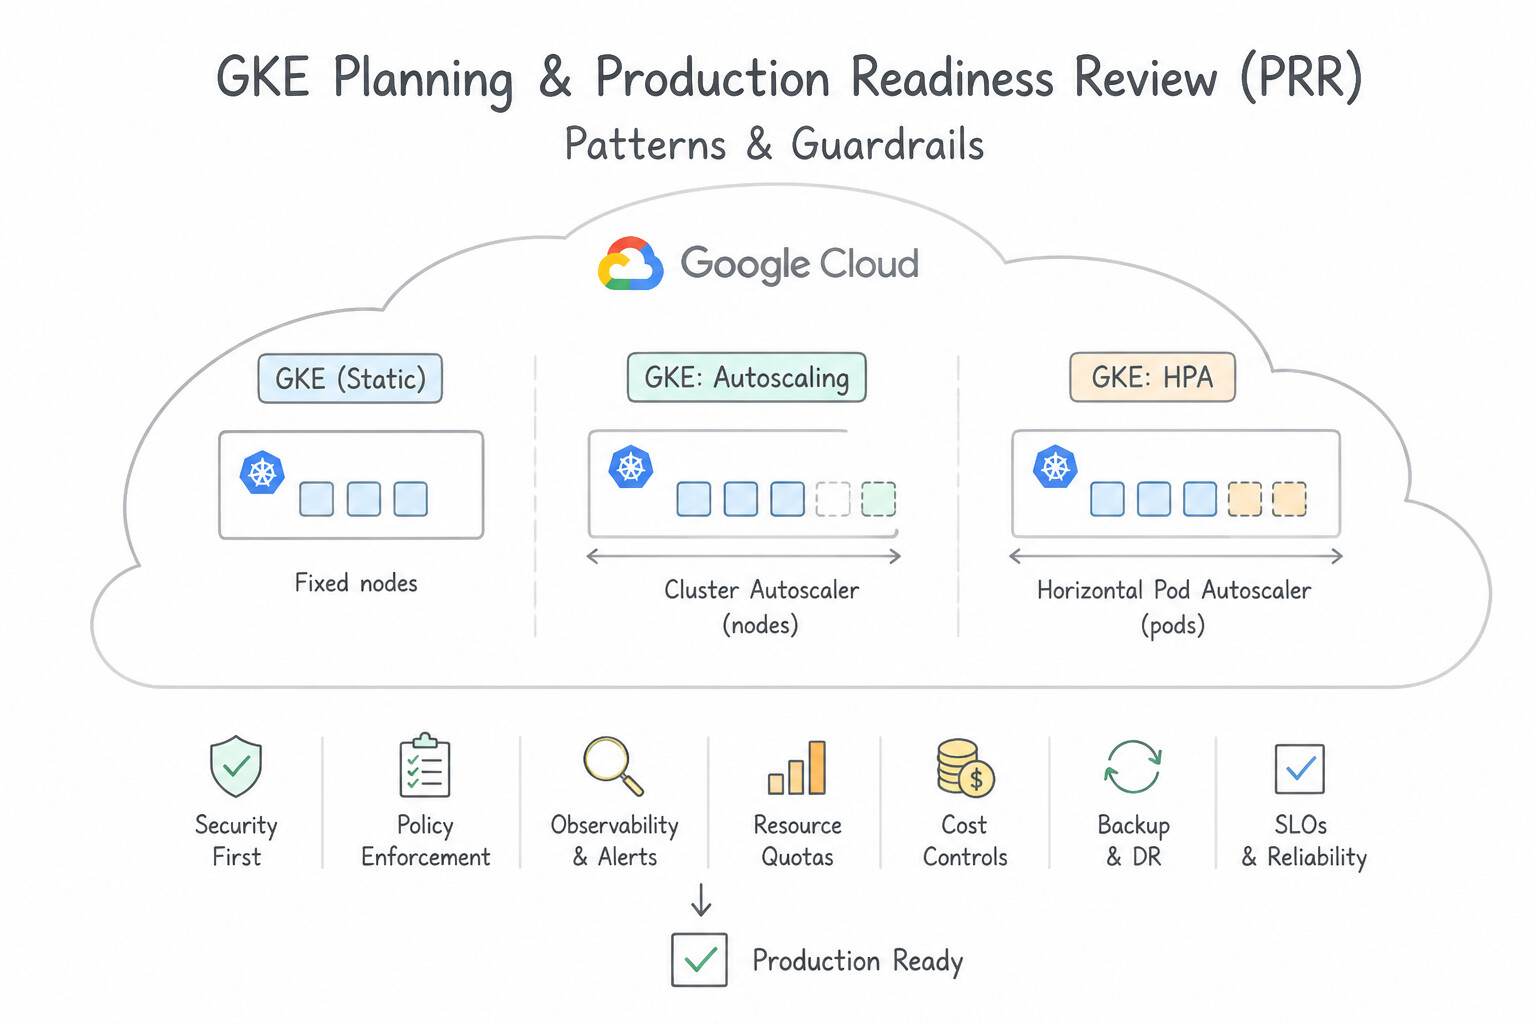
PRR): Before a service graduates to SRE support or production traffic, validate its Launch Checklist: architecture diagram, elimination of single points of failure (SPOFs), defined SLIs/SLOs/Error Budget Policy, automated CI/CD with rollback, capacity/load test results, security review, and actionable on-call playbooks. - Maintenance & Eliminating Toil: Toil is work that is manual, repetitive, automatable, tactical, devoid of enduring value, and scales linearly with service growth (
$O(N)$). Google SRE mandates keeping toil below 50% so engineers spend at least 50% of their time on engineering projects that permanently reduce toil and improve reliability. - Safe Service Retirement (Decommissioning): Never delete a legacy API or service abruptly. Follow a phased retirement: (1) audit caller logs/metrics to identify remaining consumers, (2) send deprecation notices and migrate callers, (3) run scheduled brownouts (temporarily returning errors for 5–15 minutes to flush out hidden callers that ignored emails), (4) drain traffic to zero, and (5) snapshot/archive required compliance data before tearing down infrastructure via IaC.
Key Implementation Patterns
- Capacity Planning for Launch: Use Increase the minimum replica count in the HPA configuration before the event. Pre-scaling by increasing the minimum replica count ensures capacity is ready before the known traffic spike hits. (Avoid alternative: HPA is reactive and may scale too slowly for a sudden, massive spike, causing temporary unavailability.)
- Canary Deployment Validation: Use Compare the HTTP 500 error rate and request latency of both versions. Error rates and latency are rate-based metrics that directly measure service health and user experience. (Avoid alternative: Raw transaction counts are not comparable because the traffic distribution is uneven.)
- Deprecation Strategy with Brownouts: Use Schedule short, temporary service brownouts to return errors to clients. Brownouts are temporary, planned outages used to signal end-of-life and uncover hidden dependencies without causing permanent service disruption. (Avoid alternative: Immediate decommissioning causes a hard outage, and automatic redirection can break clients due to API contract changes.)
Key Takeaways (3.2a)
- HPA is reactive and may lag behind sudden, steep traffic spikes.
- For known events, use proactive scaling (pre-warming) to ensure availability.
- Increase the minimum replica count (minReplicas) to force capacity expansion before a launch.
- Cluster autoscaler scales nodes, while HPA scales application pods; both must work together.
Consideration 3.2b: Capacity planning (e.g., quotas, limits, reservations, Dynamic Workload Scheduler)
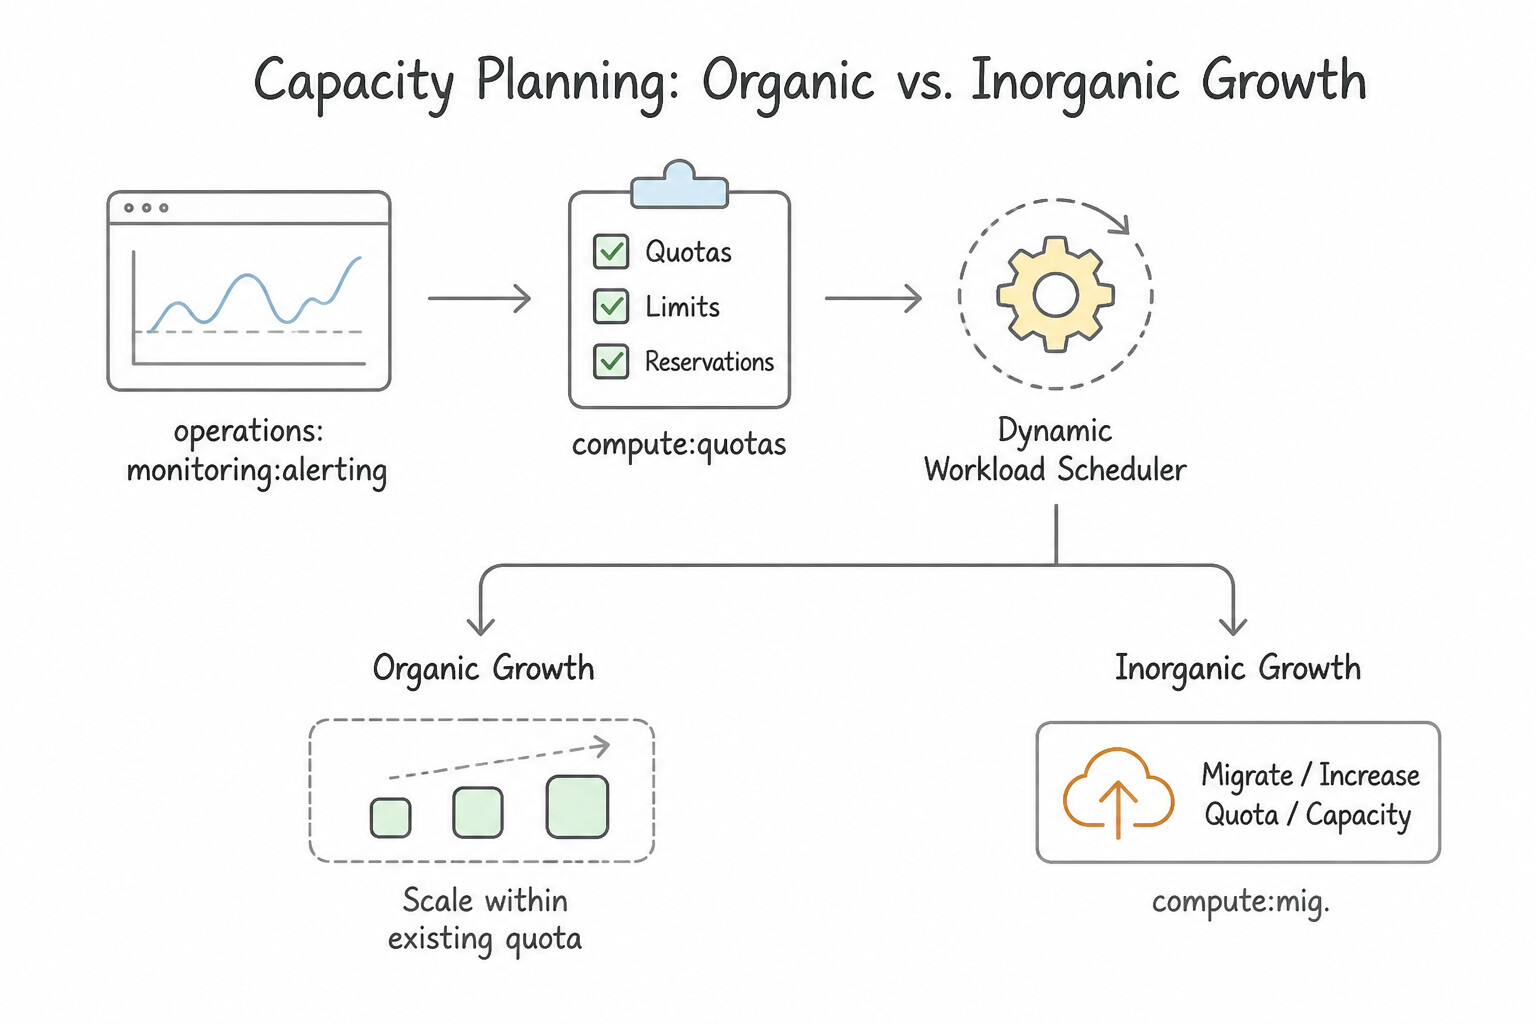
- Capacity Planning: Organic vs. Inorganic Growth (3.2b):
- Organic Growth: Gradual traffic expansion driven by natural user adoption (forecasted via historical time-series trends).
- Inorganic Growth: Sudden step-change spikes driven by product launches, Super Bowl ads, Black Friday sales, or enterprise migrations (requires load testing at $2\times$ expected peak + pre-warming capacity).
- Quotas, Reservations, and Dynamic Workload Scheduler (
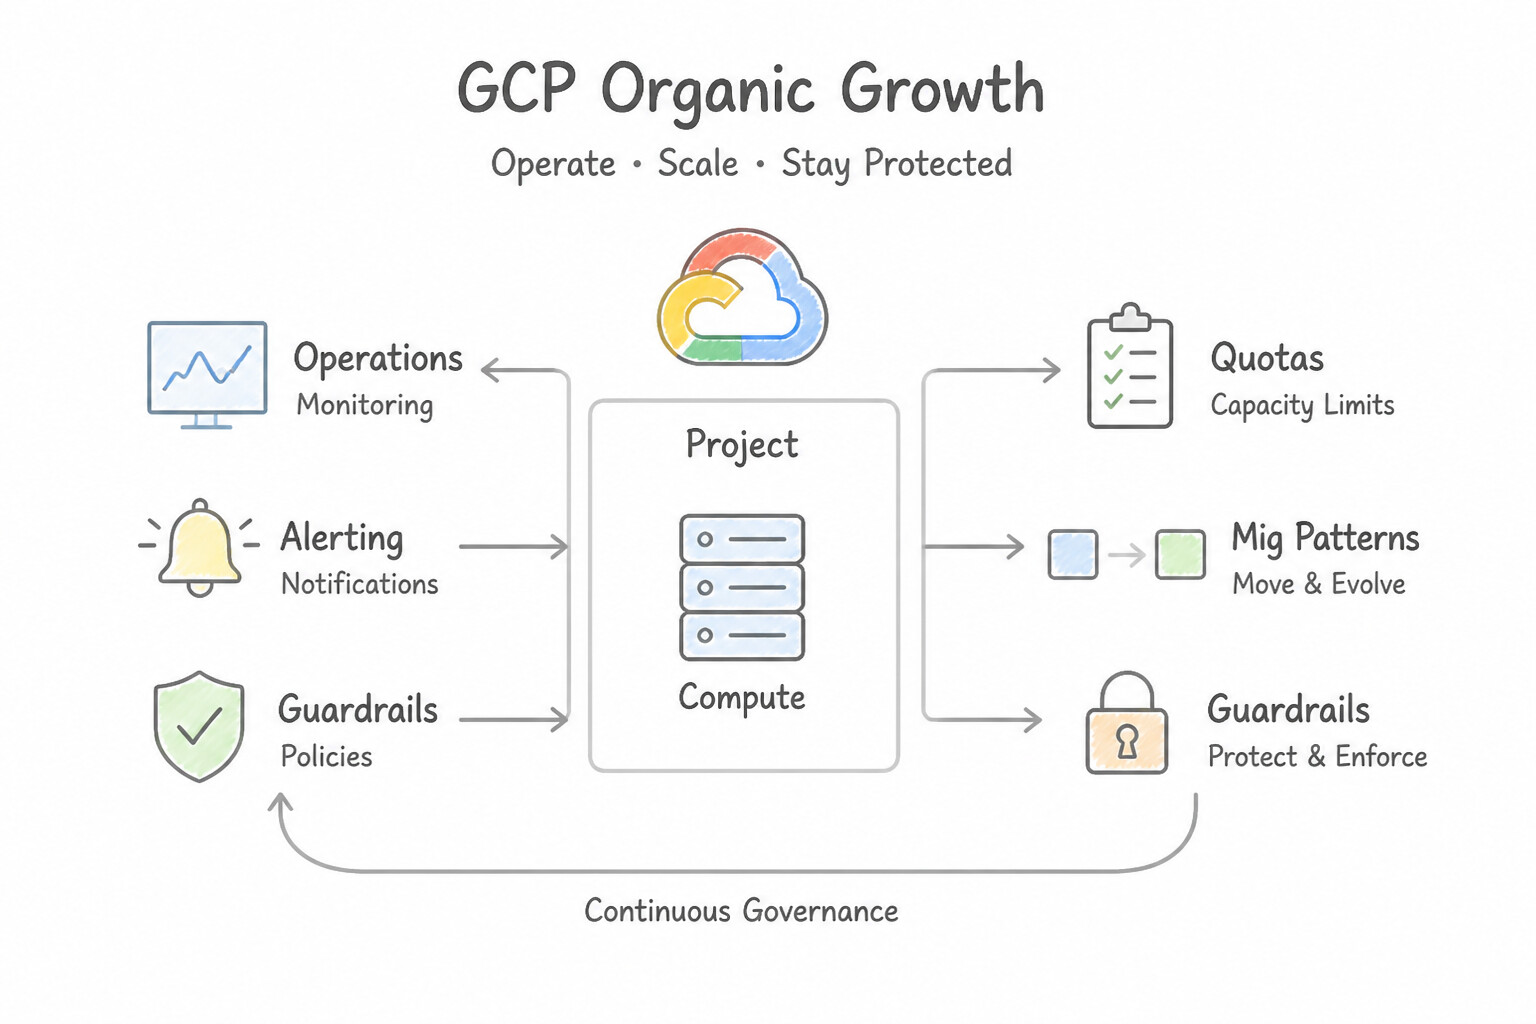
DWS): - Quotas vs. System Limits: Quotas (rate quotas and allocation quotas like
CPUS,IN_USE_ADDRESSES,SSD_TOTAL_GB) are soft project/region guardrails that can be increased via the Console/API; monitor them proactively with Cloud Monitoring alerting policies (e.g., alert when quota usage > 80%). - Compute Engine Capacity Reservations: Guarantee that physical hardware exists in a specific zone when your MIG or GKE cluster scales out during a critical event (can be consumed automatically by any matching VM in the zone or targeted explicitly via
reservationAffinity, and paired with CUDs for discounts). - Dynamic Workload Scheduler (
DWS): Purpose-built for high-demand GPU and TPU workloads (AI training, fine-tuning, batch HPC). Instead of failing withZONE_RESOURCE_POOL_EXHAUSTEDwhen requesting 64 H100 GPUs one node at a time, DWS (in Flex Start or Calendar mode with GKE custom compute classes / queued provisioning) queues the request and provisions all required accelerator nodes simultaneously once capacity becomes available, so you never pay for half-allocated idle GPUs.
Key Implementation Patterns
- Proactive Quota Monitoring: Use Create an Alert Policy in Cloud Monitoring based on the consumer quota usage metric. Set a threshold condition to trigger when usage exceeds 80%. Cloud Monitoring natively supports quota metrics, allowing proactive alerting before limits are reached.
- Handling Spot VM Preemption Capacity: Use Recreate the workload as a regional MIG and set the target distribution shape to Any. A regional MIG with the 'Any' distribution shape can find available Spot capacity across all zones in the region. (Avoid alternative: Standard VMs are much more expensive than Spot VMs, violating the cost requirement.)
- Guaranteed Capacity for Launch Events: Use Create a Compute Engine zonal reservation for the n2-standard-16 machine type in us-central1-a. Reservations allow you to lock in physical hardware capacity in a specific zone to guarantee availability. (Avoid alternative: Quotas increase your permission to create resources but do not guarantee physical hardware availability.)
Key Takeaways (3.2b)
- Quotas are hard limits: They prevent resource creation when reached, causing outages.
- Monitor proactively: Do not wait for "Quota Exceeded" errors. Monitor usage trends.
- Use built-in tools: Cloud Monitoring has native support for quota metrics; avoid custom scripts for standard operational tasks.
- Plan ahead: Alerting at 80-90% gives time for the manual process of requesting a quota increase.
Consideration 3.2c: Autoscaling (e.g., managed instance groups, Cloud Run, GKE)
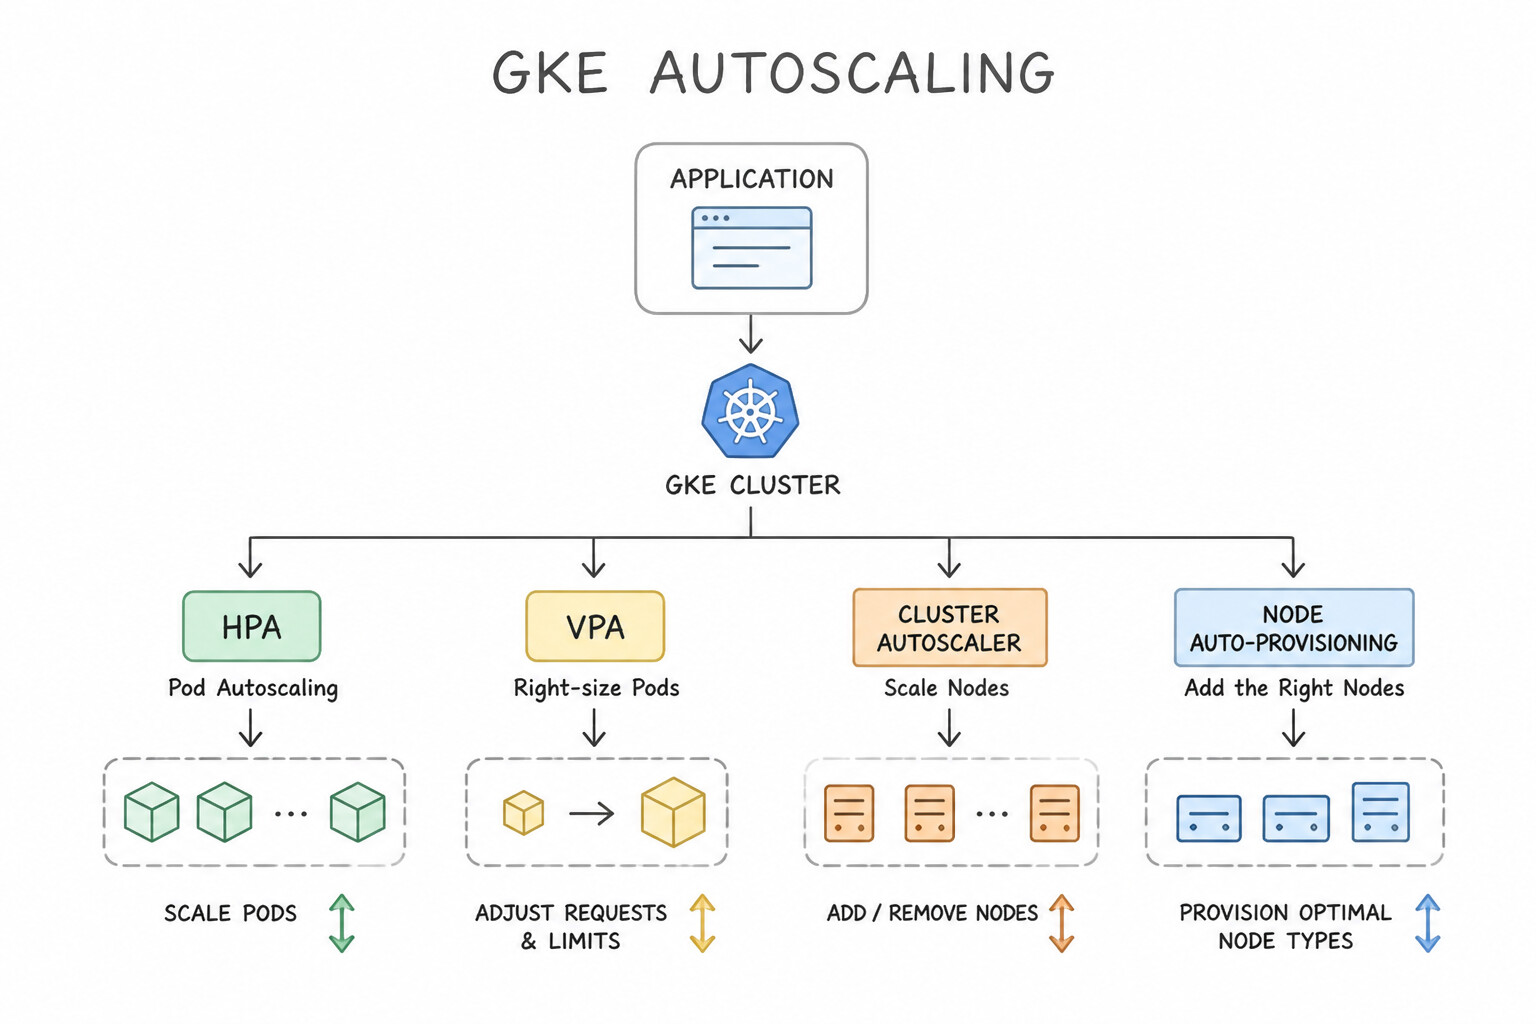
- GKE Autoscaling (
HPA,VPA,Cluster Autoscaler,Node Auto-Provisioning—3.2c): - Horizontal Pod Autoscaler (
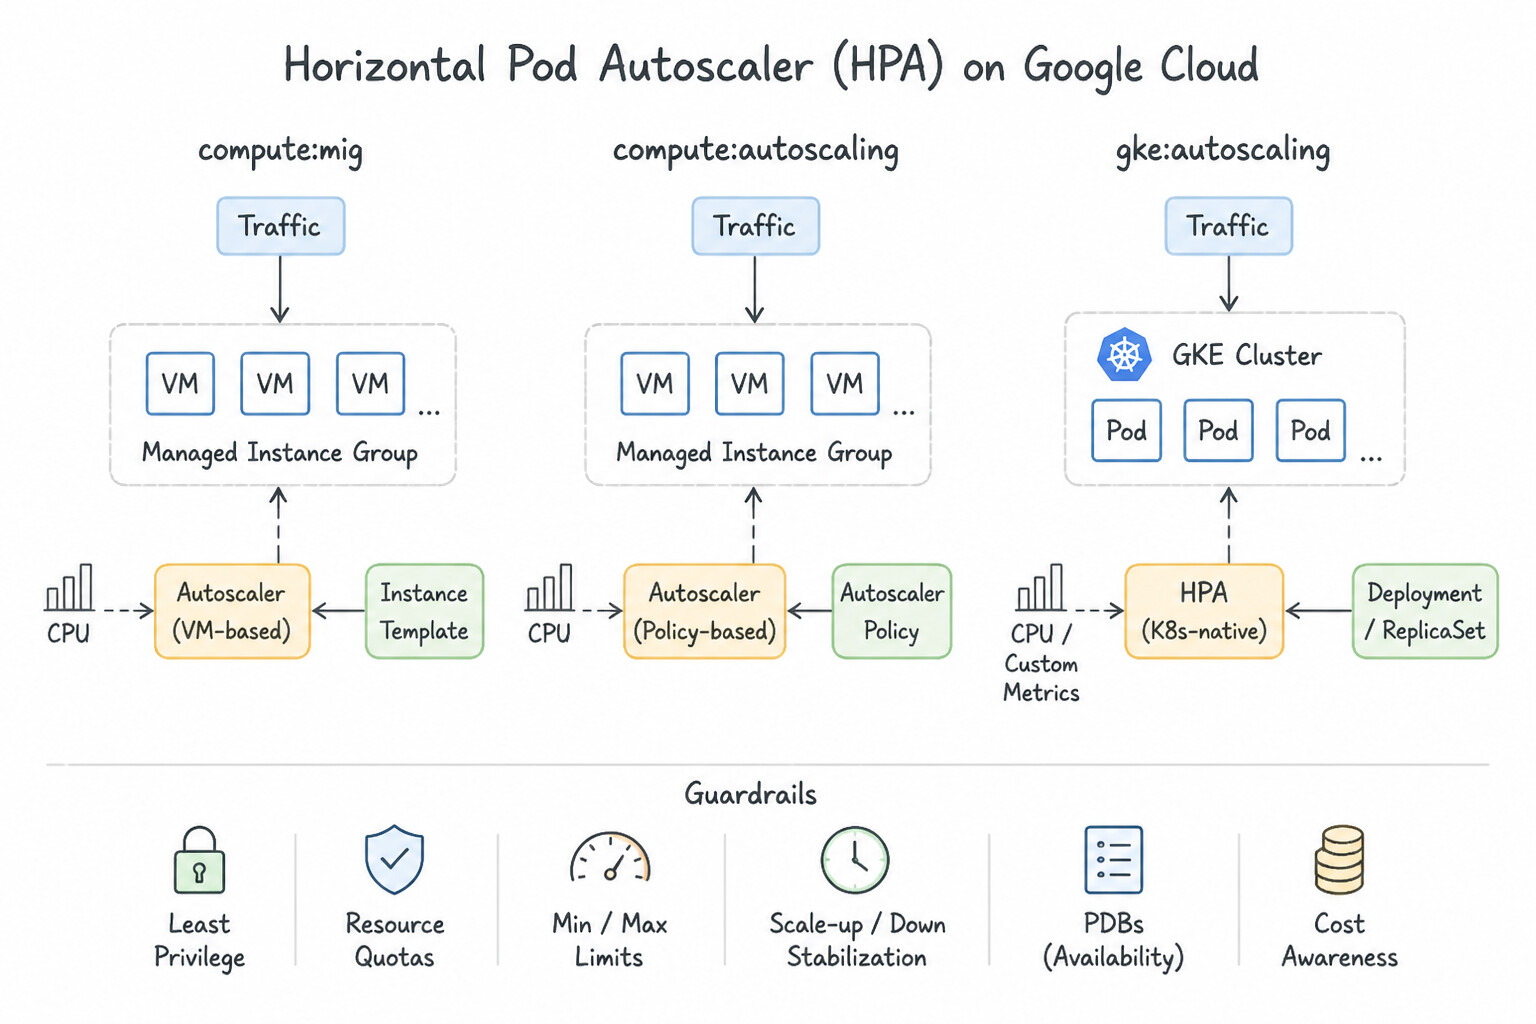
HPA): Adds/removes Pod replicas based on CPU, memory, or External/Custom Metrics from Cloud Monitoring (e.g.,pubsub.googleapis.com/subscription/num_undelivered_messagesfor queue workers!). - Vertical Pod Autoscaler (
VPA): Adjusts Podrequestsandlimits. Critical Production Rule: Never run VPA inAuto/Recreatemode on CPU alongside an HPA scaling on CPU! Instead, set VPA toOff(Recommendation-only mode) to inspect rightsizing recommendations, or use GKE Multidimensional Pod Autoscaler (MPA) to scale horizontally on CPU and vertically on memory simultaneously. - Cluster Autoscaler (
CA) & Node Auto-Provisioning (NAP):CAwatches forUnschedulablePods (Pendingdue to insufficient node CPU/memory) and adds nodes to existing node pools (and scales down underutilized nodes).NAPextends CA by automatically creating brand-new node pools with optimal machine types/GPUs tailored to pending pods. - Kubernetes Probes (
startupProbe,readinessProbe,livenessProbe): UsestartupProbeto protect slow-starting apps during boot;readinessProbeto remove overloaded pods from Load Balancer endpoints without killing them; andlivenessProbeonly to restart genuinely deadlocked containers. - Compute Engine MIGs & Cloud Run Autoscaling (3.2c):
- MIG Predictive Autoscaling: Analyzes historical daily/weekly traffic cycles to pre-launch VMs ahead of predicted load spikes—ideal when VMs take 3–5 minutes to initialize!
- MIG Scaling Policy Stabilization: Always configure an Initialization Period on MIG autoscalers so the autoscaler ignores high boot-time CPU spikes on newly created VMs.
- Cloud Run: Scales from 0 to
$N$ container instances based on concurrent requests and CPU. Configuremin-instances >= 1and Startup CPU Boost (cpu-boost) on latency-sensitive production APIs to eliminate cold-start latency.
Key Implementation Patterns
- Predictive Autoscaling for Periodic Spikes: Use Enable predictive autoscaling in the autoscaling policy. Predictive autoscaling uses historical metrics to forecast load and scale out in advance of traffic spikes. (Avoid alternative: Scheduled scaling requires manual schedule definition and does not automatically leverage historical data analysis.)
- Scaling GKE Pods on Queue Depth: Use Configure the Horizontal Pod Autoscaler (HPA) using an external metric for the Pub/Sub subscription backlog. Using external metrics allows HPA to scale based on the Pub/Sub queue length, which accurately reflects the workload. (Avoid alternative: CPU scaling will not work because the CPU utilization metric does not increase with the message backlog.)
Key Takeaways (3.2c)
- Reactive autoscaling responds to current metrics and may lag during sharp spikes.
- Predictive autoscaling leverages historical data to scale out resources before anticipated load.
- Scheduled scaling is useful for known events but is static compared to dynamic predictive models.
- Horizontal Pod Autoscaler (HPA) scales the number of pods.
Quick Decision Cheat Sheet (Subsection 3.2)
If the Scenario Requires... | Choose This Google Cloud Pattern | Avoid This Common Mistake |
|---|---|---|
"SRE team spends 75% of every week manually restarting stuck jobs and fulfilling routine access tickets" | Classify this as excessive Toil (violating the 50% cap) and prioritize engineering sprints to automate those tasks permanently | Hiring more engineers to do the manual tickets without automating them |
"Guarantee that 100 n2-standard-16 VMs can definitely scale out in us-central1-a on Black Friday" | Purchase a Compute Engine Capacity Reservation in us-central1-a and verify regional CPU Quota | Relying solely on Committed Use Discounts ( CUDs are a billing discount only and do not reserve physical capacity unless attached to a Reservation!) |
"Prevent a MIG from scaling out to 50 VMs immediately while the first 5 newly launched VMs are spiking CPU at 100% during boot" | Increase the MIG Autoscaler Initialization Period to match the VM boot/warm-up duration | Deleting the CPU autoscaling policy |
"Eliminate 4-second cold starts on a latency-critical Java/Python microservice running on Cloud Run" | Configure min-instances (≥ 1) and enable Startup CPU Boost | Migrating the stateless API to a manually managed Compute Engine VM |
"Safely decommission a legacy v1 microservice when server logs still show occasional unknown internal traffic" | Execute scheduled brownouts (temporarily returning errors in short windows) to identify and migrate remaining callers before final teardown | Deleting the production cluster immediately and waiting to see who files a P0 ticket |
Further Reading (Subsection 3.2)
- Horizontal Pod Autoscaling — Documentation on how HPA works, including the lag time involved in metric collection and scaling.
- View cost-related optimization metrics — Discusses scaling strategies and mentions that HPA is useful for scaling based on metrics but implies the need for tuning based on traffic patterns.
- Canary analysis: Lessons learned and best practices from Google and Waze | Google Cloud Blog — This chapter explains the process of canarying releases and how to analyze metrics to determine if a release is safe to proceed.
- Deprecation Policy - Google Cloud APIs — Describes the standard lifecycle for API versions, including the need for a reasonable migration period.
- Site Reliability Engineering - Managing Critical State — While focused on state, the SRE book discusses the philosophy of reliable changes and the importance of safety during migration or deprecation events.
- Monitor and Alert on Quota Usage — This guide explains how to use Cloud Monitoring to view and alert on quota metrics, specifically mentioning how to set up alerts before limits are reached.
Subsection 3.3: Mitigating incident impact on users
The Big Picture
When a P0 pager alert fires at 2:30 AM because checkout error rates just spiked to 45%, novice engineers instinctively open the source code repo, read stack traces line by line, and try to write a "fix-forward" patch while thousands of customers fail to check out every minute. Google SRE Incident Response Rule #1 is uncompromising: Stop the bleeding first; investigate root cause later.
Every production incident mitigation falls into one of three immediate levers—governed by a structured Incident Command System (ICS) and followed by a Blameless Postmortem:
- Immediate Rollback (
3.3c— When Triggered by a Recent Change): Over 70% of production outages are triggered by a recent code deployment, configuration push, or flag toggle. Do not debug whyv2.4.1is failing in production—immediately roll back tov2.4.0via Cloud Deploy (gcloud deploy targets rollback), Cloud Run (--to-revisions), or GKE (kubectl rollout undo). - Draining & Redirecting Traffic (
3.3a— When Triggered by a Zonal/Regional or Dependency Failure): If a single zone, GKE cluster, or backend MIG becomes unhealthy, gracefully drain in-flight connections (Connection Draining Timeouton the Load Balancer +preStoplifecycle hooks on GKE) and redirect user traffic to healthy regions using Global External Application Load Balancing, Multi-Cluster Ingress (MCI), or Cloud Armor rate-limiting/blocking if the spike is a DDoS/bot attack. - Adding Emergency Capacity & Load Shedding (
3.3b— When Triggered by Legitimate Traffic Surge): Scale out horizontal replicas/nodes, enable Cloud CDN / Memorystore caching to shield the database, or activate load shedding / graceful degradation (dropping low-priority recommendations so core checkout survives).
Consideration 3.3a: Draining/redirecting traffic
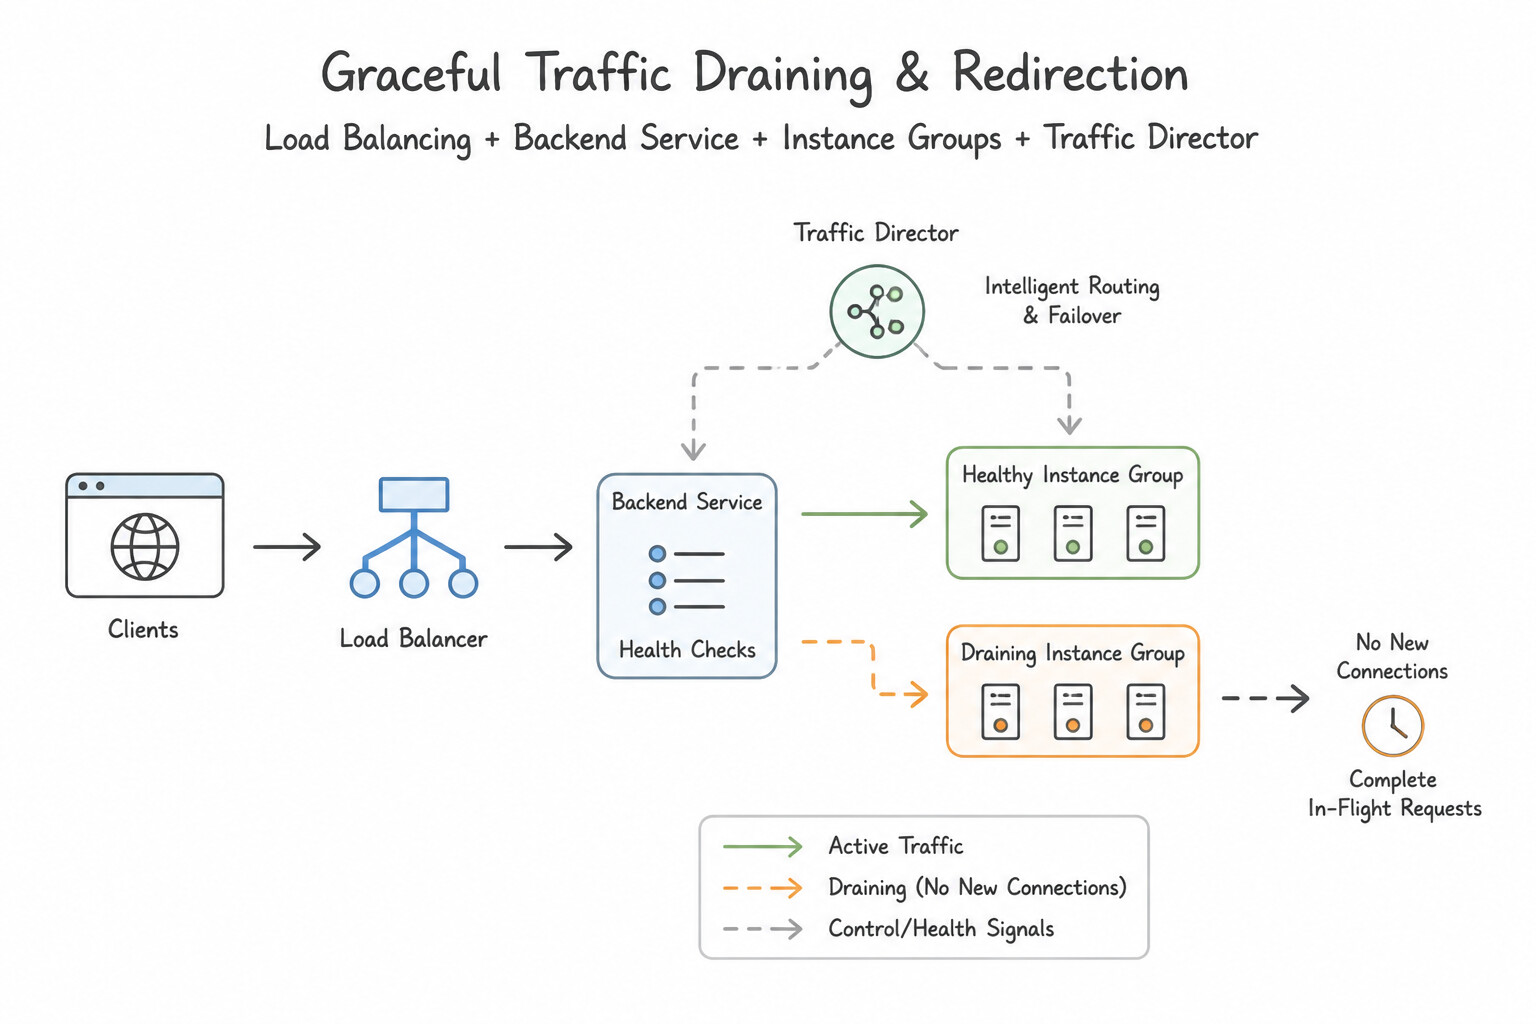
- Graceful Traffic Draining & Redirection (3.3a):
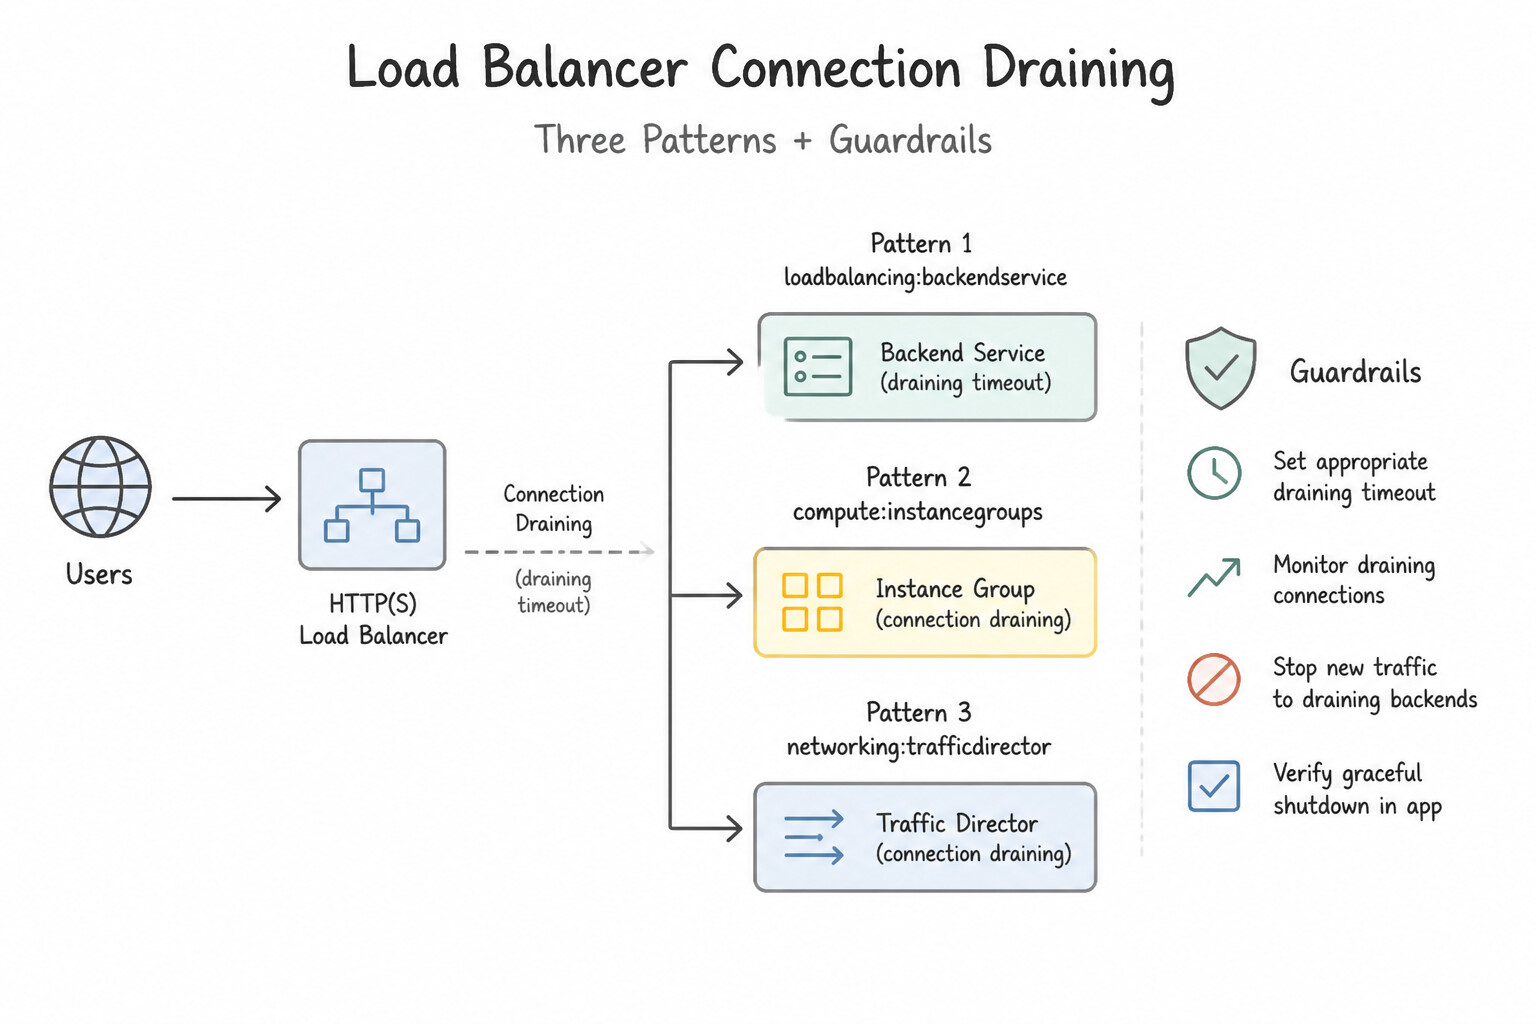
- Load Balancer Connection Draining: Enable Connection Draining Timeout (up to 3,600s, typically 60–300s) on Backend Services so when an instance or zonal backend is removed or marked for evacuation, the Load Balancer stops sending new requests immediately while allowing in-flight HTTP/RPC requests to complete without
HTTP 502 Bad Gatewayresets. - Kubernetes Pod Termination Lifecycle (
preStop+terminationGracePeriodSeconds): When Kubernetes terminates a Pod,SIGTERMand endpoint removal fromkube-proxy/ Load Balancer NEGs happen asynchronously in parallel! To prevent a Pod from shutting down its HTTP listener 2 seconds before the Load Balancer stops sending traffic to its IP, configure apreStoplifecycle hook (sleep 5orsleep 10), handleSIGTERMgracefully in app code, and ensureterminationGracePeriodSeconds(default 30s) exceeds your longest request duration. - Regional / Multi-Cluster Traffic Failover: Use Global External Application Load Balancing (or Multi-Cluster Ingress [
MCI] for GKE Fleets) with multi-region backend services/NEGs; if one region's health checks fail (or if you manually set capacity scaler to0.0to drain a region), global anycast automatically routes users to the nearest healthy region. - Protecting Against Malicious Traffic Spikes: If an outage is caused by a L7 DDoS attack or runaway scraper, deploy Google Cloud Armor edge security policies (rate-based banning, adaptive protection, geo/IP blocking) at the Load Balancer to drop malicious traffic at Google's edge before it reaches your compute backends.
Key Implementation Patterns
- Immediate Regional Traffic Cutover: Use Edit the backend service to set the capacity scaler to 0 for the
us-west1instance group. Setting the capacity scaler to 0 immediately drains traffic from a backend, forcing the load balancer to redirect traffic to other healthy regions. - Internal Microservice Flapping: Use Configure an outlier detection policy on the backend service. Outlier detection monitors real traffic responses and ejects instances returning errors, covering gaps left by active health checks. (Avoid alternative: Faster checks will not detect application-layer errors if the check type only verifies network connectivity.)
- Graceful Termination of WebSocket Connections: Use Configure connection draining on the backend service with a specific timeout. Connection draining allows existing connections to persist for a set duration while preventing new traffic to instances being removed. (Avoid alternative: Max unavailable settings control capacity during updates, not the graceful handling of individual connections on terminating instances.)
Key Takeaways (3.3a)
- Capacity Scaler is the preferred mechanism to drain traffic from a backend service for maintenance or incident response.
- Setting capacity scaler to 0 forces an immediate fail over to other healthy regions in a Global Load Balancer setup.
- Avoid relying on health check failures for intentional draining as they introduce latency and user errors.
- Global Load Balancers automatically redirect traffic to the nearest healthy region with available capacity.
Consideration 3.3b: Adding capacity
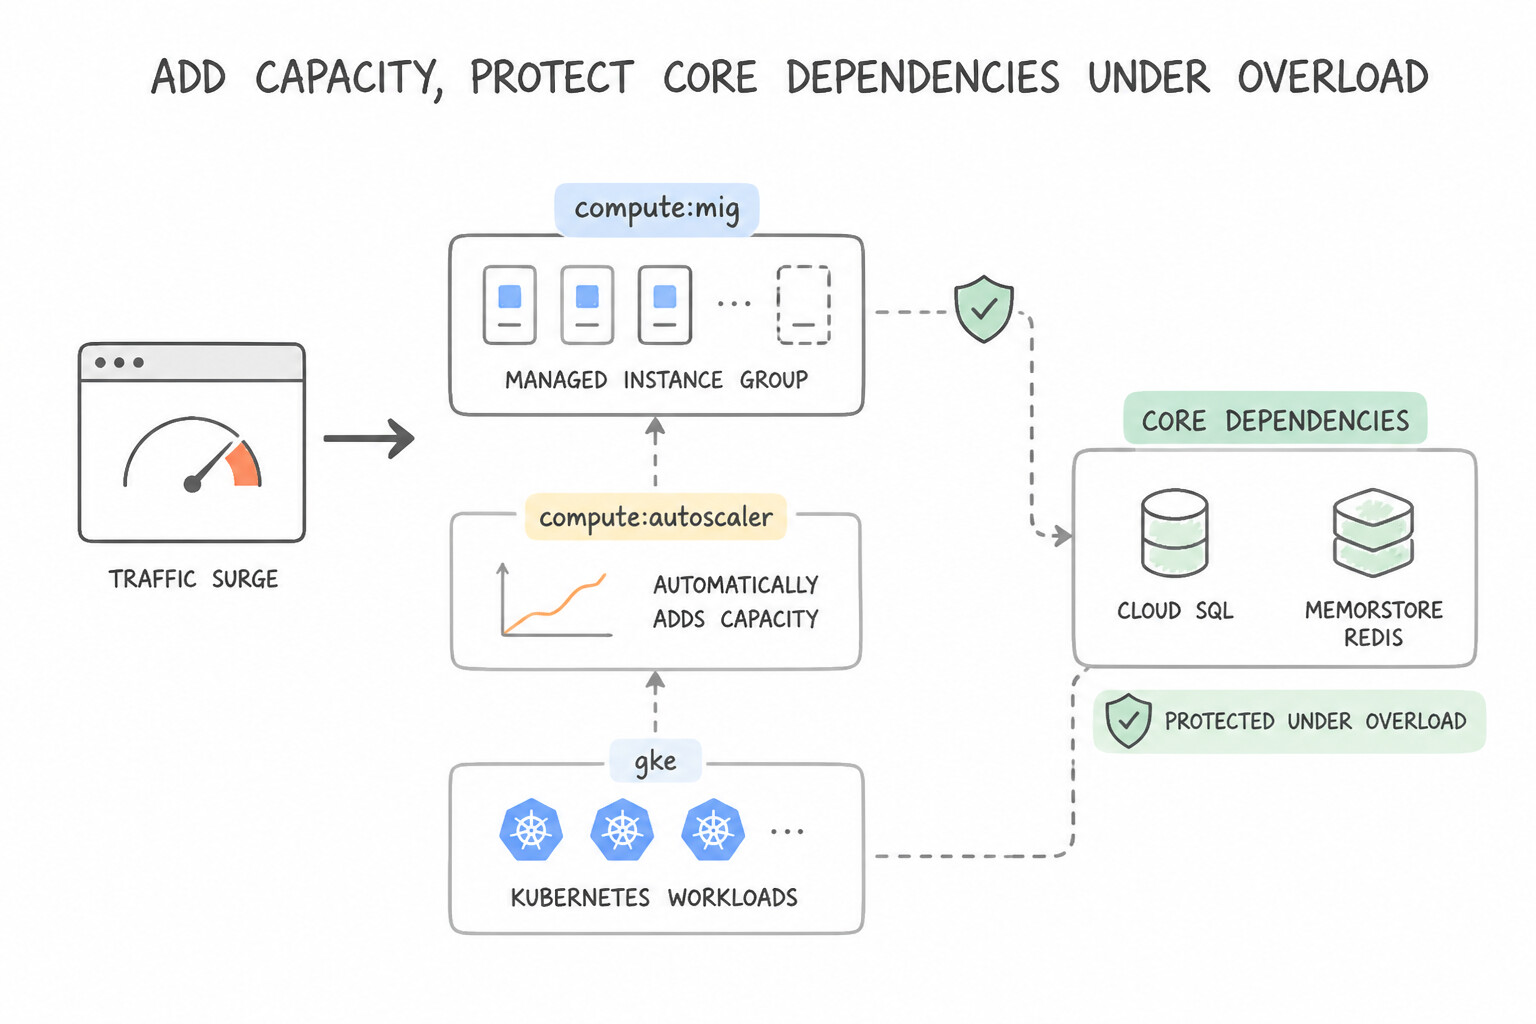
- Adding Capacity & Protecting Core Dependencies Under Overload (3.3b):
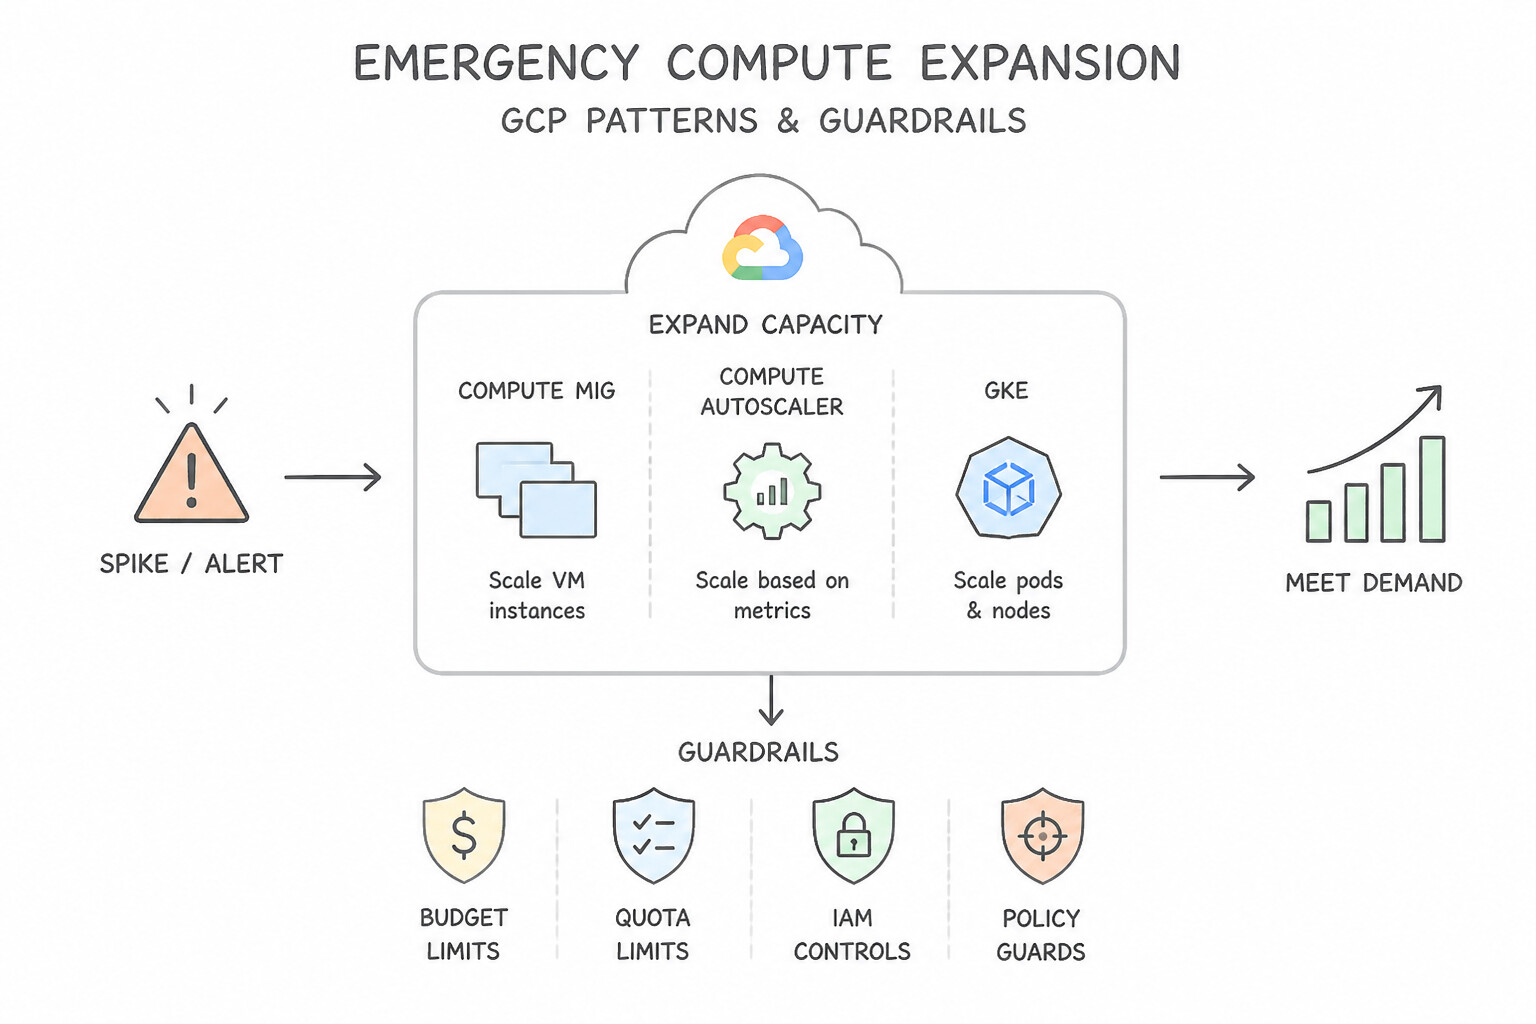
- Emergency Compute Expansion: Temporarily increase GKE HPA / Cluster Autoscaler, MIG, or Cloud Run (
--max-instances) upper limits, or switch GKE/Compute Engine instances to larger machine types—while immediately checking downstream bottlenecks (such as Cloud SQLmax_connections!). Scaling Cloud Run from 50 to 1,000 instances without connection pooling (PgBouncer / Cloud SQL Auth Proxy pooling) will instantly exhaust database connections and turn a compute spike into a total database outage. - Caching, Load Shedding & Graceful Degradation:
- Enable Cloud CDN on the Load Balancer for cacheable static/semi-static responses and Memorystore for Redis for hot database queries.
- Implement Load Shedding (prioritizing critical checkout/login requests while returning fast
HTTP 503/ fallback defaults on low-priority analytics or recommendation widgets) and Circuit Breakers (via Cloud Service Mesh outlier detection) paired with exponential backoff and jitter on clients to prevent cascading failures and retry storms.
Key Implementation Patterns
- Resolving MIG Saturation: Use Increase the maximum number of instances in the MIG autoscaling configuration. The autoscaler hit its upper limit; increasing the maximum number of instances allows it to scale out and reduce load. (Avoid alternative: Raising the target utilization allows higher load per instance but does not add the necessary capacity to reduce latency.)
- GKE Pending Pods: Use Enable the Cluster Autoscaler on the existing node pool. The Cluster Autoscaler automatically adds nodes when pods cannot be scheduled due to lack of resources. (Avoid alternative: Reducing replicas stops scaling and fails to handle the traffic spike.)
- Cloud Spanner CPU scaling: Use Edit the instance to increase the number of nodes or processing units. Spanner supports horizontal scaling by adding nodes or processing units without downtime. (Avoid alternative: Migrating to a new instance is slow and complex, not suitable for immediate mitigation.)
Key Takeaways (3.3b)
- Autoscalers are bounded by minimum and maximum instance counts.
- If scaling stops despite high load, check if the maximum instance limit has been reached.
- Increasing the maximum instance limit is a primary mitigation strategy for capacity-related incidents.
- Target utilization determines when to scale, while max instances determines how much scaling is allowed.
Consideration 3.3c: Rollback strategies
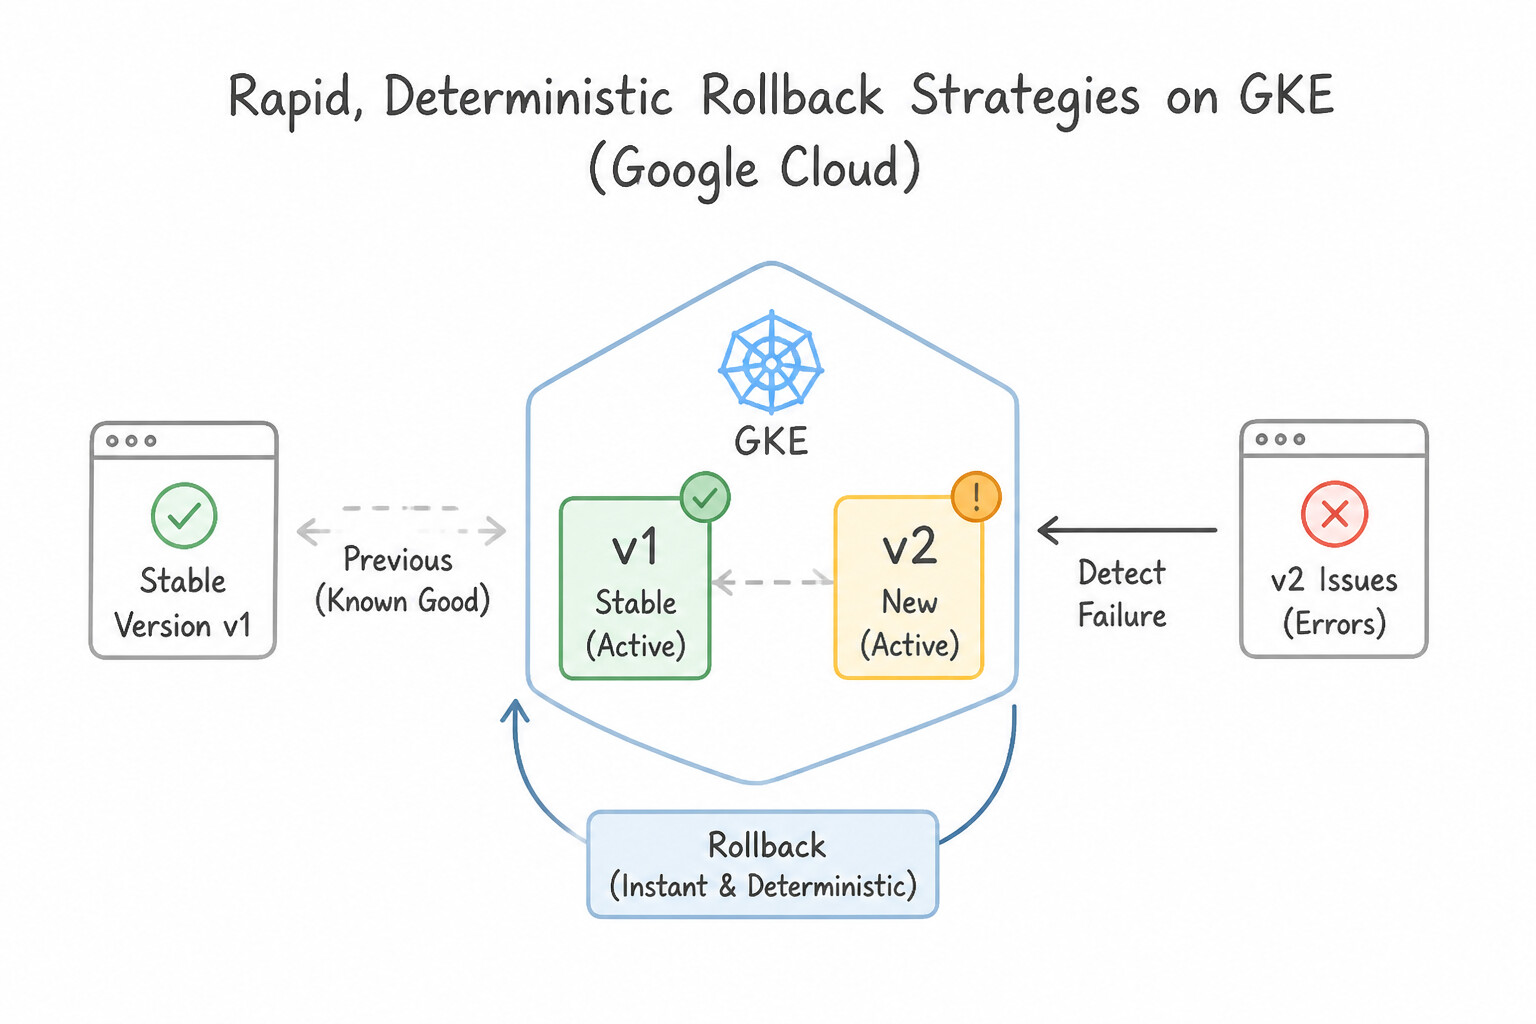
- Rapid, Deterministic Rollback Strategies (3.3c):
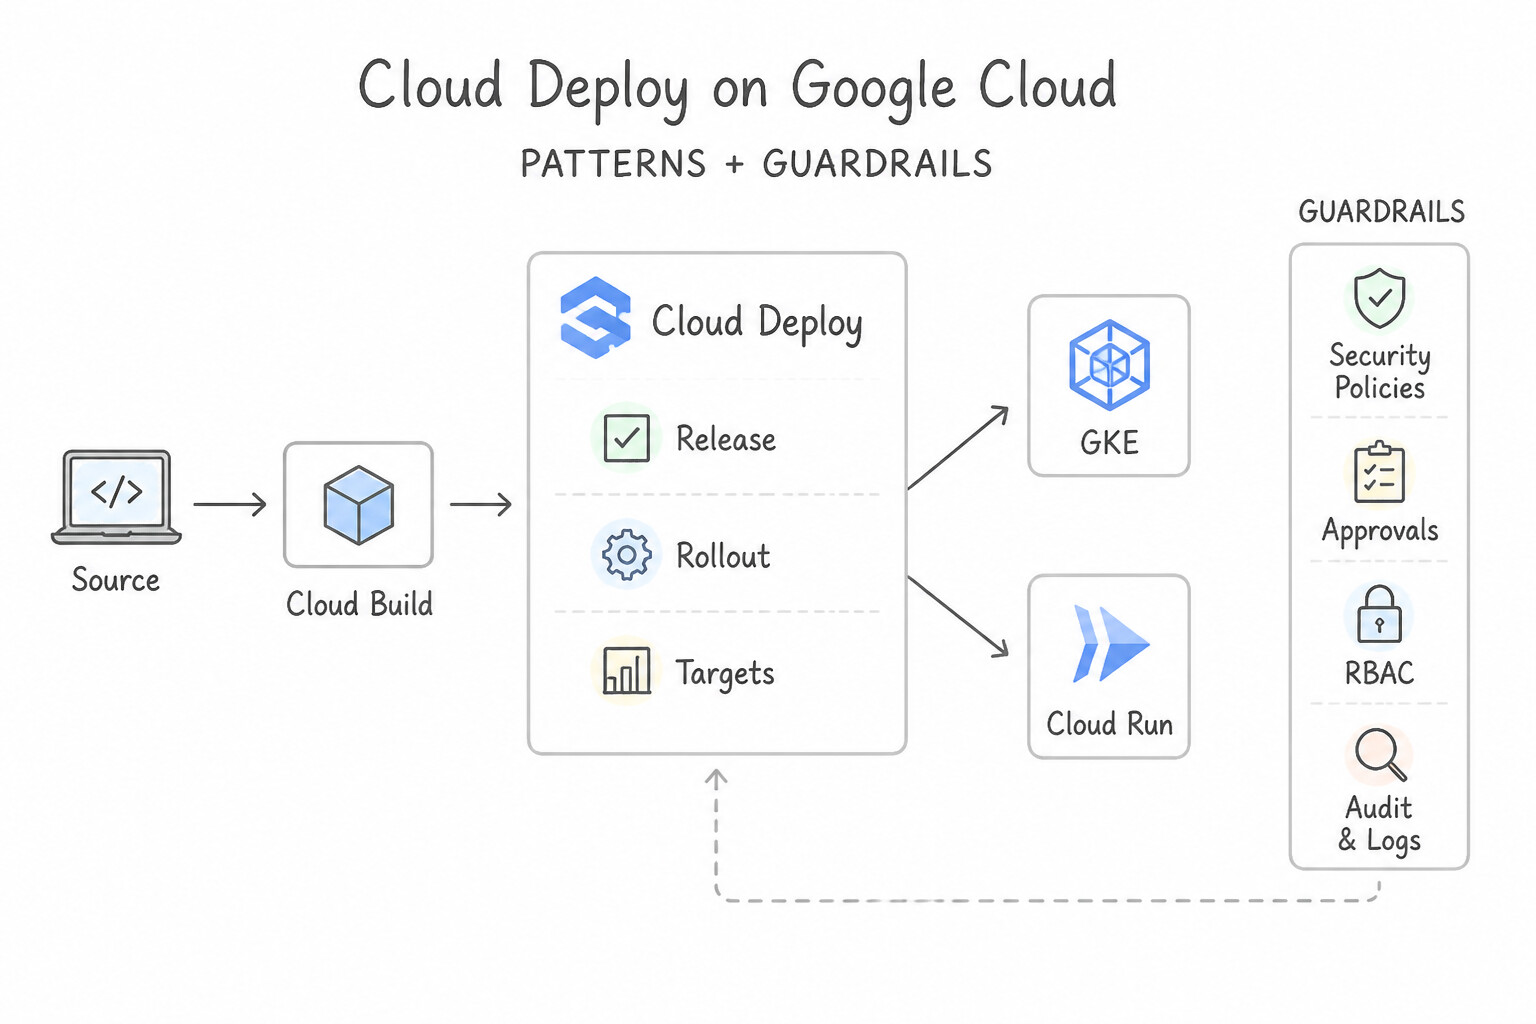
- Cloud Deploy: Run
gcloud deploy targets rollback(or click Rollback in the Console), which automatically creates a new rollout deploying the last successful Release (@sha256digest + rendered manifests) to the target environment. - Cloud Run: Because Cloud Run revisions are immutable and remain warm/available, execute
gcloud run services update-traffic SERVICE --to-revisions=PREVIOUS_REVISION=100for an instantaneous (< 5 second) 100% traffic rollback without rebuilding or redeploying containers. - GKE (
Deployment): Runkubectl rollout undo deployment/<name>(or let Config Sync revert by runninggit reverton the config repository if managed via strict GitOps). - Database Schema Rollback Compatibility (Expand-and-Contract Pattern): A container rollback will fail catastrophically if
v2ran a destructive SQL migration (ALTER TABLE DROP COLUMNor renaming a column) thatv1still expects! Always enforce backward-compatible (Expand-and-Contract) database migrations: Step 1 (Expand): add nullable column; Step 2: deployv2dual-writing/reading; Step 3 (Contract): drop old column only in a later release afterv2is proven stable. - SRE Incident Management (
ICS) & Blameless Postmortems: - Incident Commander (
IC): Holds overall authority, coordinates the response strategy, and delegates tasks—the IC should never get buried writing code or debugging logs personally when others are available. - Communications Lead (
Comms): Sends timely status updates to stakeholders and always commits to a specific "Next Update by [Timestamp]" so executives and support teams do not interrupt the engineering bridge for status checks. - Operations Lead (
Ops): Executes the actual technical mitigations (rollback,traffic drain,scaling) under IC direction. - Blameless Postmortem: Focuses strictly on systemic technical root causes and missing guardrails (never naming or blaming individuals), and produces prioritized, tracked engineering action items.
Key Implementation Patterns
- Feature Flag Toggles vs. Code Rollback: Use Update the feature flag configuration to disable the affected module. Feature flags allow instant disabling of features without waiting for deployments or restarts. (Avoid alternative: Reverting code and running the pipeline is too slow (20 minutes) for the required mitigation time.)
- Cloud Run Traffic Splitting: Use Update the traffic settings to route 100% of traffic to the previous stable revision. Cloud Run traffic management allows instant routing changes to stable revisions. (Avoid alternative: Deleting an active revision causes errors rather than a clean rollback.)
- Database Schema Backward Compatibility: Use Adopt the expand and contract pattern. Add the new column while keeping the old column, deploy the code, and remove the old column in a separate, later release. Use the expand and contract pattern to ensure the database schema remains backward compatible during the deployment.
Key Takeaways (3.3c)
- Feature Flags allow for instant rollback of specific features without redeploying code.
- Decoupling deployment from release reduces risk and accelerates mitigation.
- Binary rollbacks (reverting container images) are slower than configuration changes because they require pod restarts.
- Cloud Run Revisions are immutable snapshots of your code and configuration.
Quick Decision Cheat Sheet (Subsection 3.3)
If the Scenario Requires... | Choose This Google Cloud Pattern | Avoid This Common Mistake |
|---|---|---|
"New deployment causes spike in latency or 5xx errors; what should you do FIRST?" | Roll back immediately ( gcloud deploy targets rollback, kubectl rollout undo, or Cloud Run traffic split to previous revision) | Starting a Cloud Profiler session or reading source code before rolling back |
"Drain all user traffic away from one regional backend behind a Global Application Load Balancer without dropping active requests" | Configure Connection Draining Timeout on the Backend Service and set the regional backend's capacity scaler to 0 (or remove it) | Abruptly deleting the Compute Engine VM instances while requests are in flight |
"Stakeholders keep interrupting the engineering incident bridge every 3 minutes asking for status updates" | Appoint a dedicated Communications Lead who posts periodic updates to a status channel and always includes a committed 'Next Update Time' | Inviting 50 executives into the active technical debugging Slack/Meet channel |
"500 microservice pods restart after a transient outage and immediately DDoS the backend auth service with synchronized retries" | Implement Exponential Backoff with Random Jitter + Circuit Breakers | Retrying failed requests immediately in a tight while(true) loop |
"Ensure a code rollback on GKE never fails due to a database schema change applied during the deployment" | Decouple schema migrations from app rollouts using the Expand-and-Contract (backward-compatible) migration pattern | Running destructive DROP COLUMN SQL statements inside the application container startup script |
Further Reading (Subsection 3.3)
- Backend services overview - Capacity Scaler — This documentation explains how the capacity scaler setting controls the target capacity for a backend instance group and how setting it to 0 drains the backend.
- Set up traffic management for global external Application Load Balancers — Documentation explaining how to configure outlier detection (circuit breaking) to handle unhealthy hosts based on response codes.
- Enable connection draining — This official documentation explains how to enable connection draining on backend services to ensure existing requests have time to complete when an instance is removed.
- Understanding autoscaler decisions — Documentation explaining how the autoscaler calculates the recommended size and how constraints like maximum replicas affect the final decision.
- Cluster Autoscaler — Overview of how Cluster Autoscaler works in GKE, specifically how it adds nodes when pods cannot be scheduled.
- Monitoring Cloud Spanner - CPU Utilization — Explains the recommended CPU utilization thresholds (65% for regional instances) and when to scale up.
Book TOC · Previous · Chapter 3 of 6 · Next
AwesomeGCP.com Learning
The approach taken is a question-led learning approach: you explore realistic project scenarios where you need to make decisions or take actions to achieve business goals within specific constraints. Instead of passive learning, you are challenged to think and work through the options to master the Professional Cloud DevOps Engineer (PDOE) certification!