Book TOC · Previous · Chapter 4 of 6 · Next
Chapter 4: Implementing Cloud Observability: OpenTelemetry, Cloud Logging, PromQL, SLO Burn Alerts & Trace
Chapter Focus: Ops Agent, OpenTelemetry Collector, Google Cloud Managed Service for Prometheus (GMP), Log Router exclusion filters/sinks/redaction, Multi-Window Multi-Burn-Rate SLO alerts, Cloud Trace, and production debugging.
Subsection 4.1: Instrumenting and collecting telemetry
The Big Picture
In modern cloud architectures, observability fails at the collection layer for three predictable reasons:
- Legacy Split Agents & Unparsed Log Files (4.1a): Running deprecated
google-fluentdandstackdriver-agentdaemons on Compute Engine VMs—or letting containerized applications write logs to local/var/log/app.logfiles instead ofstdout/stderr—creates high memory overhead and orphaned logs. Google Cloud standardizes VM telemetry on the single unified Ops Agent (Fluent Bit for logs + OpenTelemetry Collector for metrics/traces), and standardizes container/serverless logging on structured JSON written tostdout/stderr. - Ingesting 100% of Verbose Debug & Health-Check Logs (4.1b): When a high-traffic HTTP(S) Load Balancer, VPC subnet (
VPC Flow Logs), orDEBUG-level microservice emits 50,000 log entries per second into Cloud Logging, observability costs skyrocket. Because Cloud Logging bills per GiB ingested at the Log Router, filtering logs in the Logs Explorer UI saves $0! You must optimize volume before or at ingestion via Log Router Exclusion Filters, percentage-based log sampling, and VPC Flow Log sampling/filtering. - Self-Managed Prometheus Scaling Bottlenecks & Reactive Outage Detection (
4.1c,4.1d,4.1e): Running self-managed Prometheus servers on GKE leads to local persistent disk exhaustion, lost high-availability shards, and painful upgrades. Switching to Google Cloud Managed Service for Prometheus (GMP) provides globally scalable, zero-maintenance PromQL storage—paired with Synthetic Monitors / Uptime Checks to catch external availability regressions before customers do, and Log-Based Metrics to turn unstructured log patterns into alertable time series.
Consideration 4.1a: Collecting and importing logs (e.g., Ops Agent, OpenTelemetry, Cloud Audit Logs, VPC Flow Logs, Cloud Service Mesh)
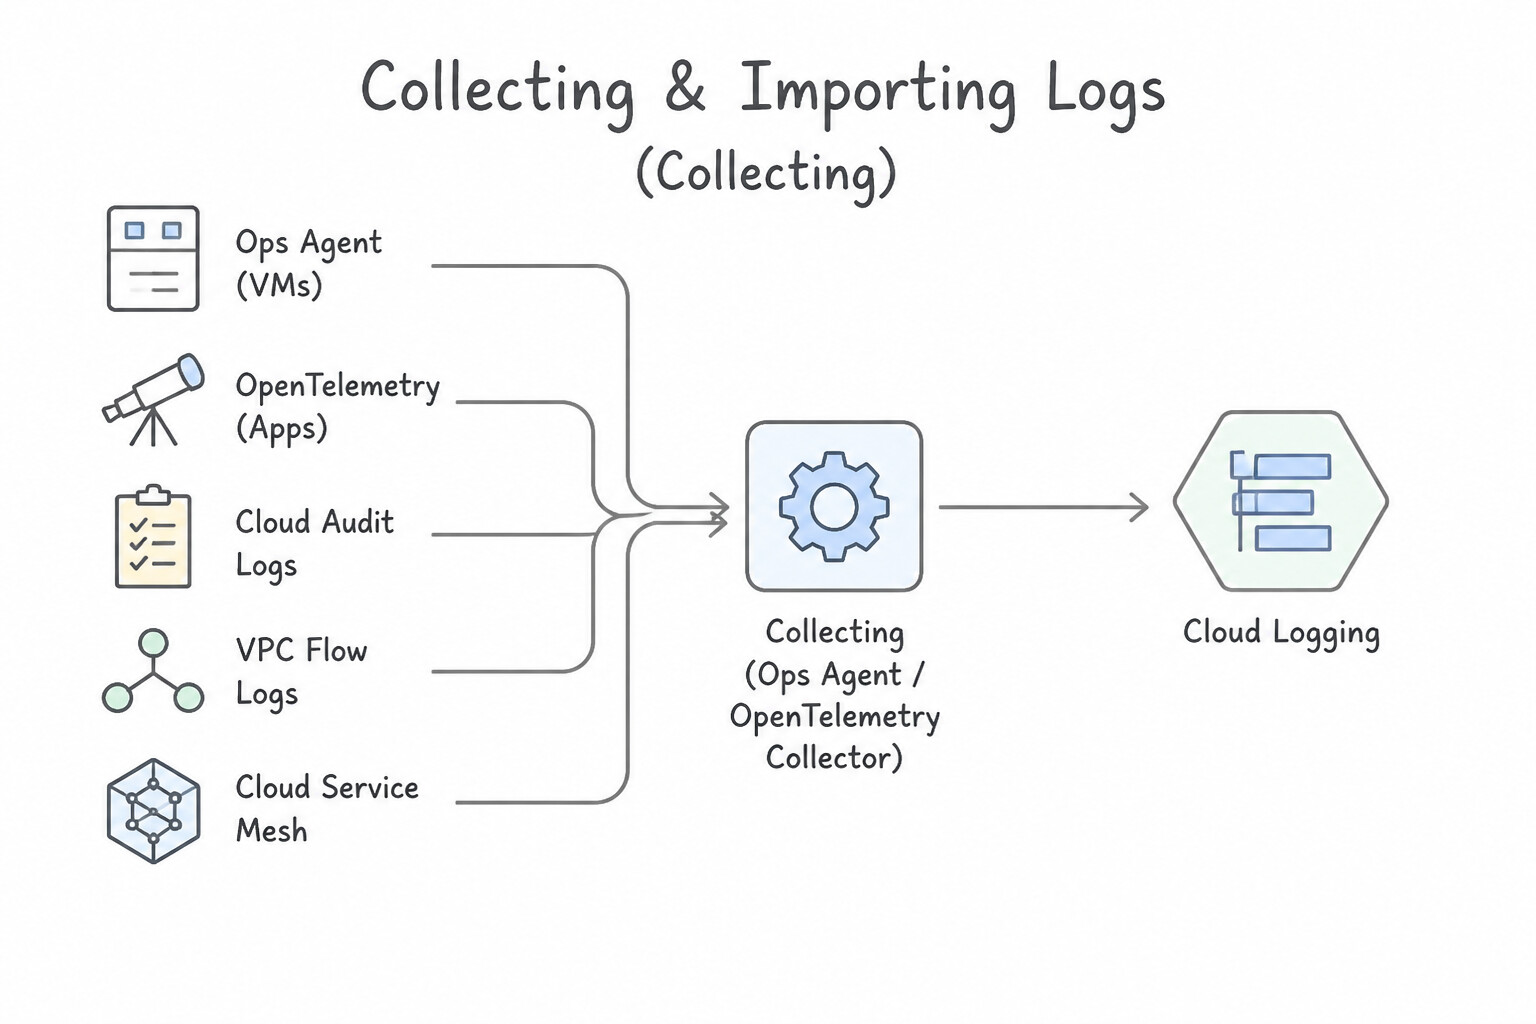
- Collecting and Importing Logs (
Ops Agent,stdout/stderr,OpenTelemetry,VPC Flow Logs—4.1a): - Compute Engine (
Ops Agent): The single recommended agent for Linux and Windows VMs. Configured via/etc/google-cloud-ops-agent/config.yaml(logging.receiversto tail custom files like/var/log/legacy.log,logging.processorsto parse JSON/regex or modify fields, andlogging.service.pipelines). Deploy at scale across VM fleets using VM Manager OS Policy Assignments, Packer golden images, or Terraform (google-cloud-ops-agent-policy). - GKE & Cloud Run (
stdout/stderr): Never install the Ops Agent inside a Cloud Run container or GKE application pod! Write single-line structured JSON directly tostdoutorstderr; the built-in GKE logging agent / Cloud Run runtime automatically captures it and parsesseverity,httpRequest, andlogging.googleapis.com/trace. - VPC Flow Logs & Cloud Service Mesh: Enable VPC Flow Logs at the Subnet level to capture sampled TCP/UDP/ICMP connection metadata for network forensics and egress cost analysis without any guest VM agent overhead.
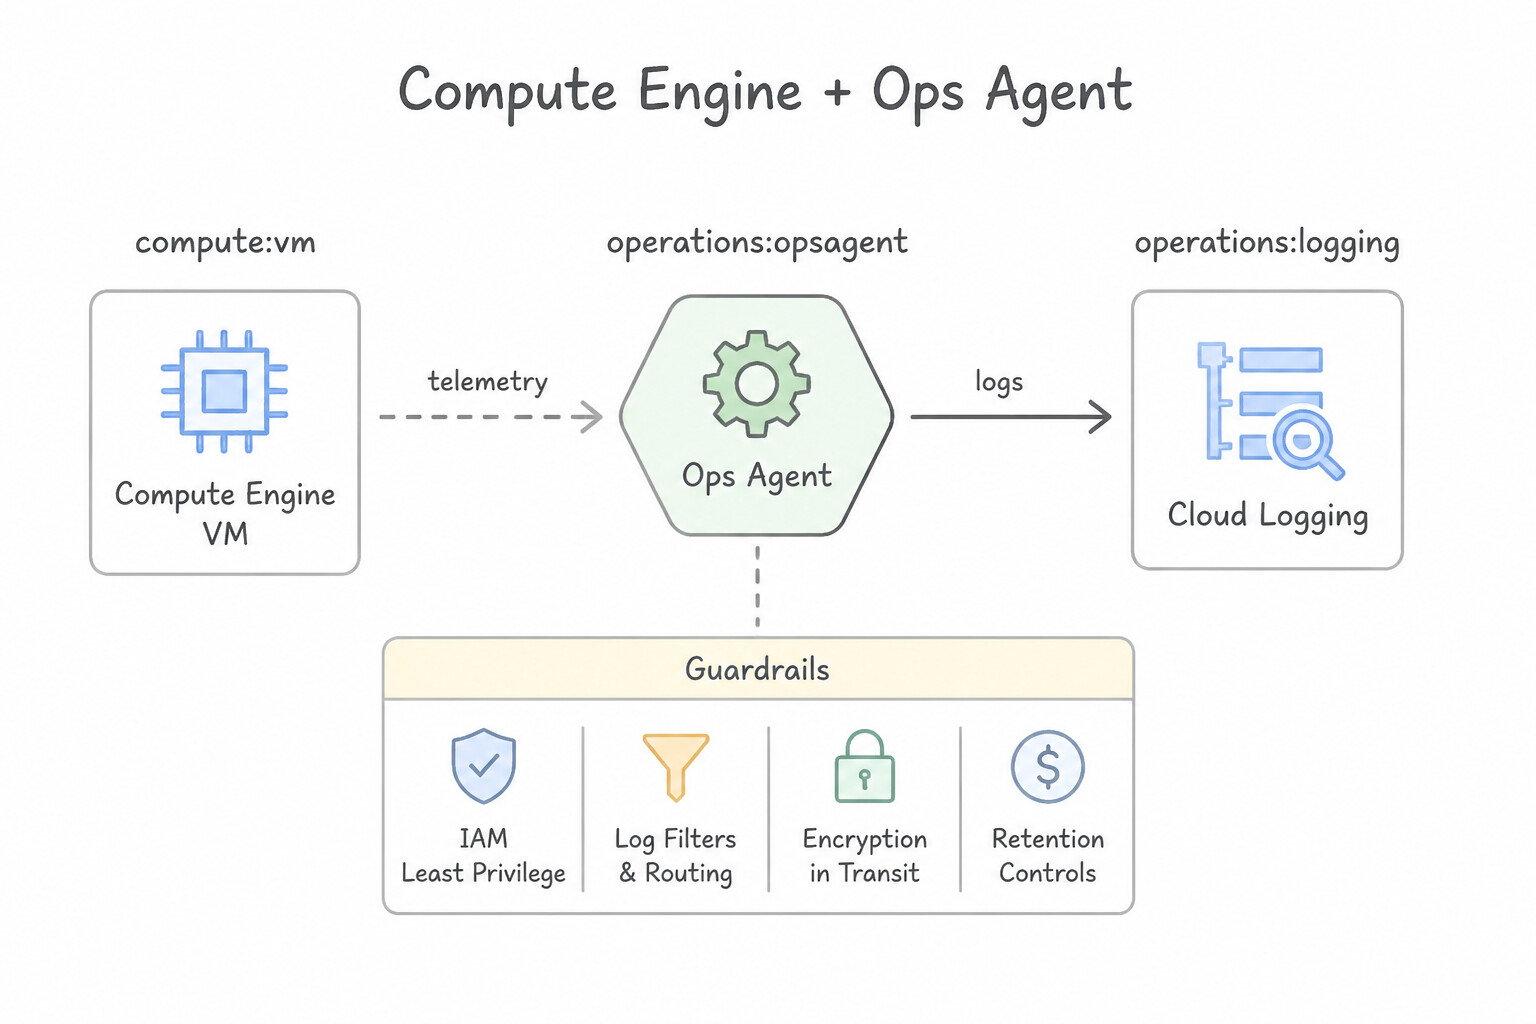
Key Implementation Patterns
- Configuring Ops Agent for Structured Logging: Use In the Ops Agent
config.yaml, define afilesreceiver for the log path. Create a pipeline that uses this receiver and adds ajsonprocessor. Use afilesreceiver to read the file and ajsonprocessor to parse the structured data. - Troubleshooting Network Latency with VPC Flow Logs: Use Enable VPC Flow Logs on the subnet used by the GKE cluster nodes. Query the logs in Cloud Logging for denied traffic. VPC Flow Logs provide agentless visibility into network traffic metadata and firewall rule decisions (ALLOW/DENY).
- Enabling Data Access Audit Logs for Compliance: Use In the IAM & Admin console, locate the Audit Logs configuration for BigQuery and enable the Data Read log type. Data Access logs (specifically Data Read) record user queries and must be enabled in the IAM Audit Logs configuration.
Key Takeaways (4.1a)
- The Ops Agent uses a pipeline architecture consisting of Receivers, Processors, and Exporters (implied).
- The
filesreceiver reads logs as raw text.- To ingest structured logs (JSON), you must attach a
jsonprocessor to the pipeline.- Structured logging allows for richer querying capabilities in Cloud Logging compared to raw text.
Consideration 4.1b: Optimizing logs (e.g., filtering, sampling, exclusions, cost management, source considerations)
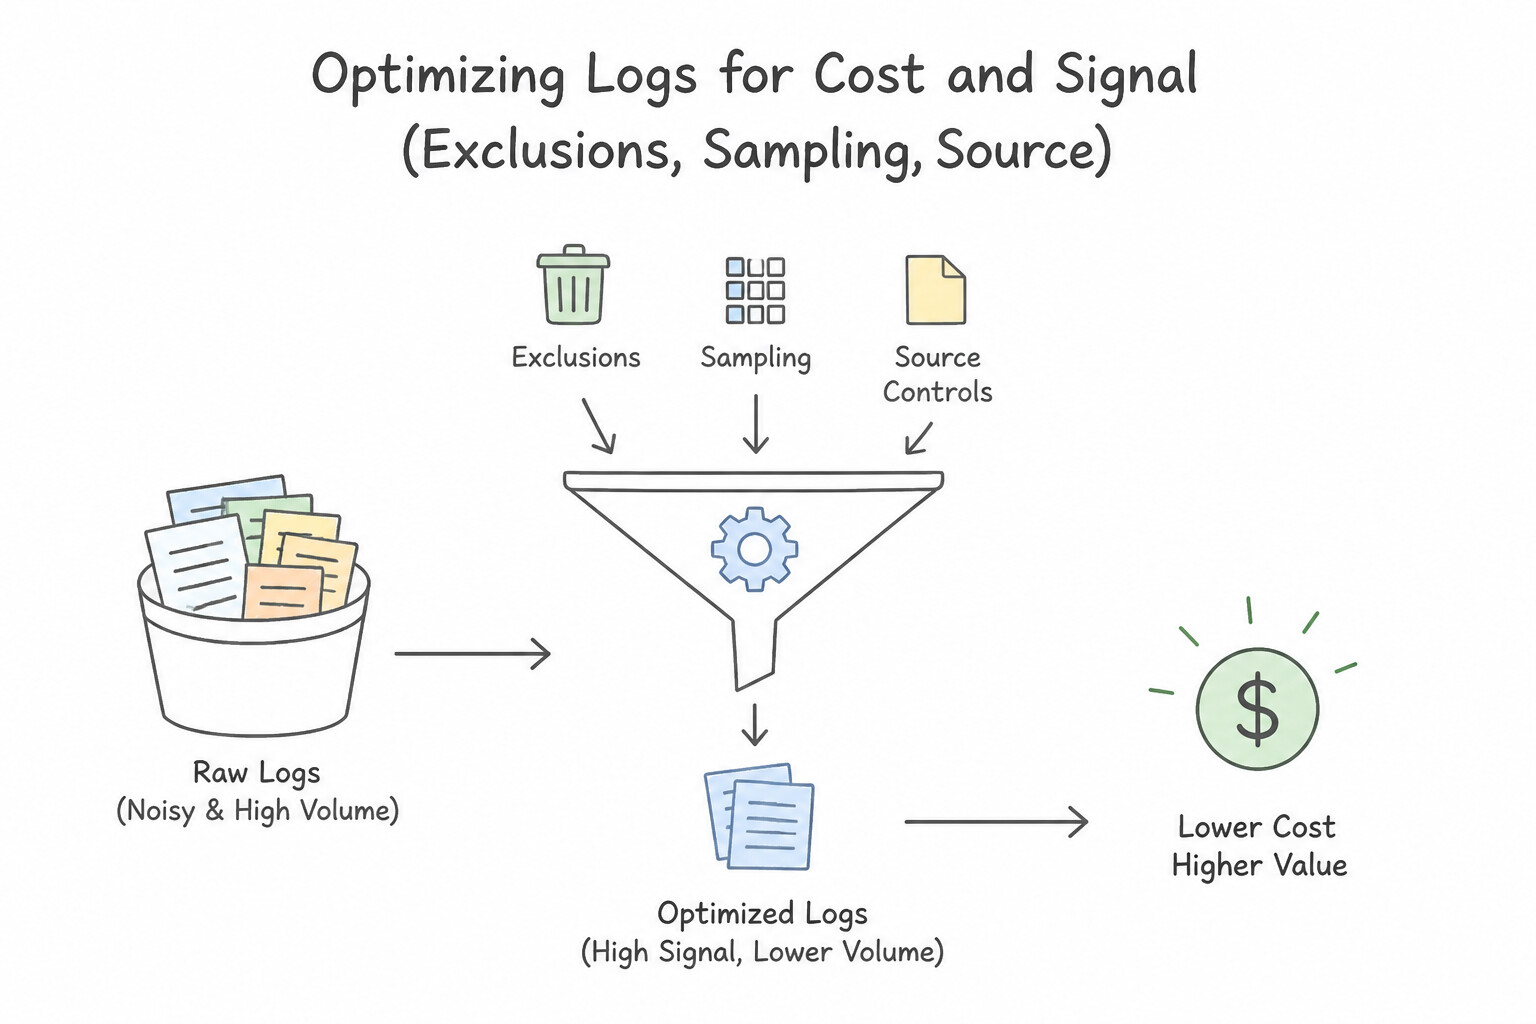
- Optimizing Logs for Cost & Signal (
Exclusions,Sampling,Source Controls—4.1b): - Log Router Exclusion Filters (
_DefaultSink): The primary architectural pattern for cutting Cloud Logging bills without changing application code! Add an Exclusion Filter on the_Defaultsink in the Log Router—for example: - Drop noisy GKE/LB health checks:
resource.type="http_load_balancer" AND httpRequest.userAgent:"GoogleHC" - Drop
DEBUGlogs in non-prod:severity < INFO - Sample 90% of high-volume
200 OKaccess logs while keeping 100% of errors:httpRequest.status=200 AND NOT sample(insertId, 0.1)(excludes 90%, ingests 10%). - VPC Flow Log Optimization: Reduce VPC Flow Log ingestion volume by adjusting the Sampling Rate (e.g.,
0.1instead of1.0), increasing the Aggregation Interval (INTERVAL_5_MINorINTERVAL_15_MINinstead ofINTERVAL_5_SEC), selecting Metadata Annotations (Exclude all metadataor custom fields), and applying a Log Filter (e.g., only log rejected packets or external IPs).
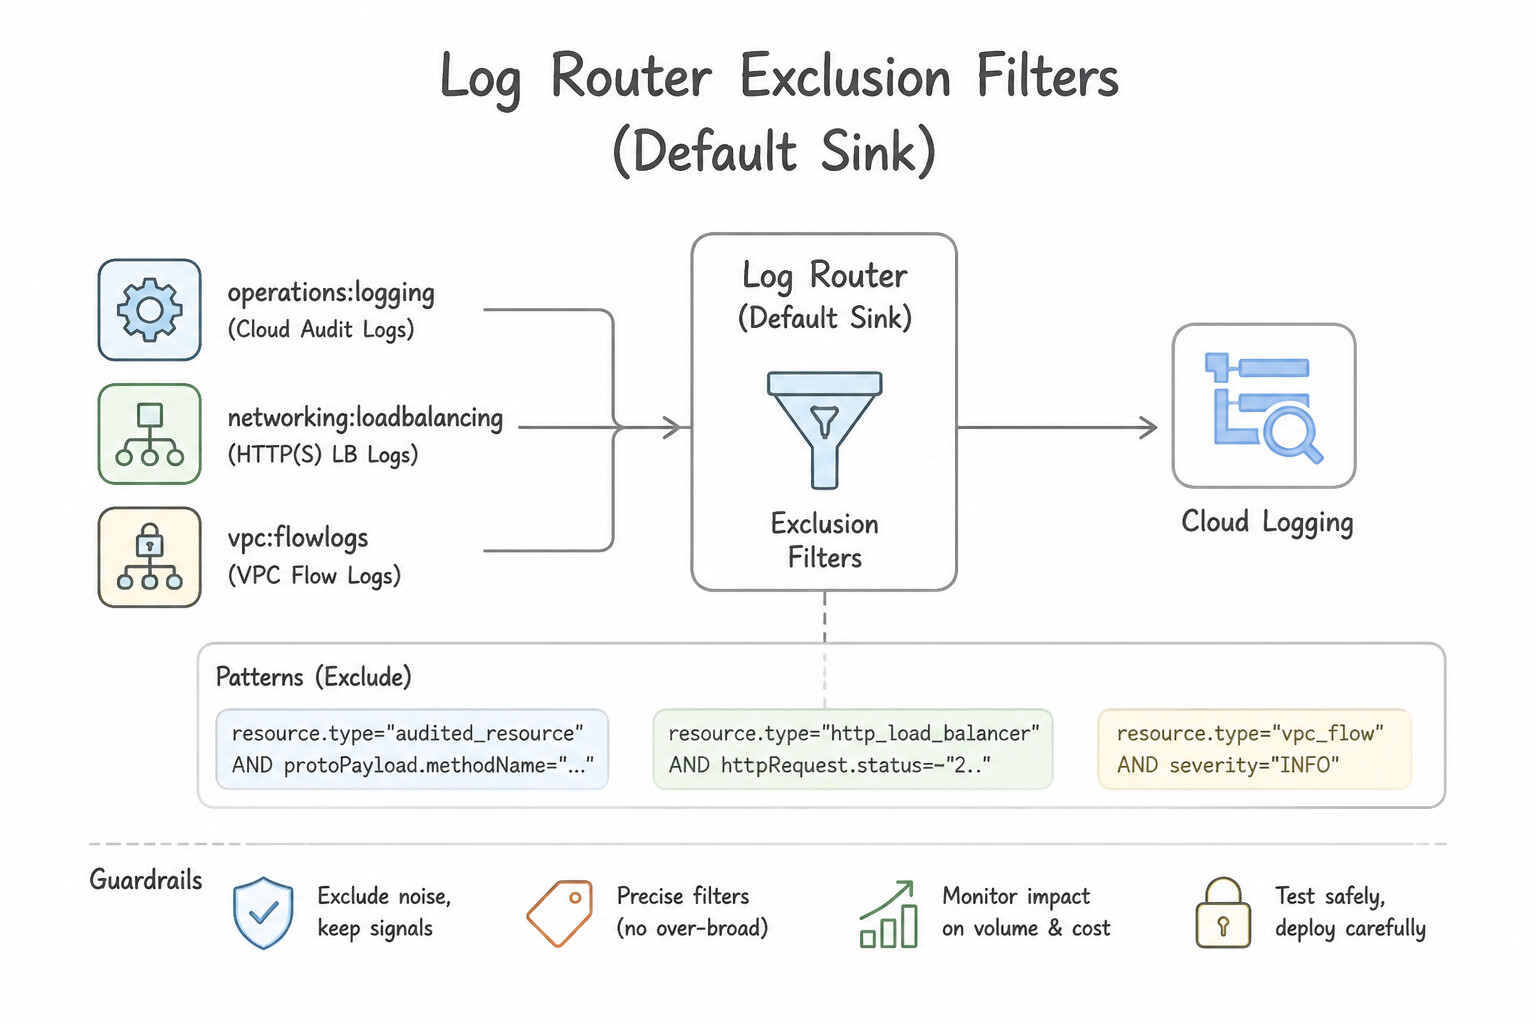
Key Implementation Patterns
- Reducing Costs for High-Volume Load Balancer Logs: Use Update the
_Defaultlog sink to add an exclusion filter forhttpRequest.status=200. Exclusion filters prevent specific logs from being ingested into the log bucket, saving money while keeping other relevant logs. - Optimizing VPC Flow Logs for Cost and Utility: Use Enable VPC Flow Logs with a sampling rate of 0.5 (50%) and an aggregation interval of 15 minutes. Lowering the sampling rate and increasing the aggregation interval reduces log volume and cost while maintaining statistical trends.
Key Takeaways (4.1b)
- The
_Defaultsink routes logs to the main Log Bucket for storage and analysis.- Ingestion costs are based on the volume of data stored in Log Buckets.
- Exclusion filters on sinks allow you to discard specific logs (like HTTP 200 successes) to save money.
- Exclusion filters are preferred over sampling when you need to ensure 100% of specific important logs (like errors) are kept.
Consideration 4.1c: Collecting metrics (e.g., from applications, platforms, networking, Cloud Service Mesh, Google Cloud Managed Service for Prometheus, hybrid/multi-cloud environments)
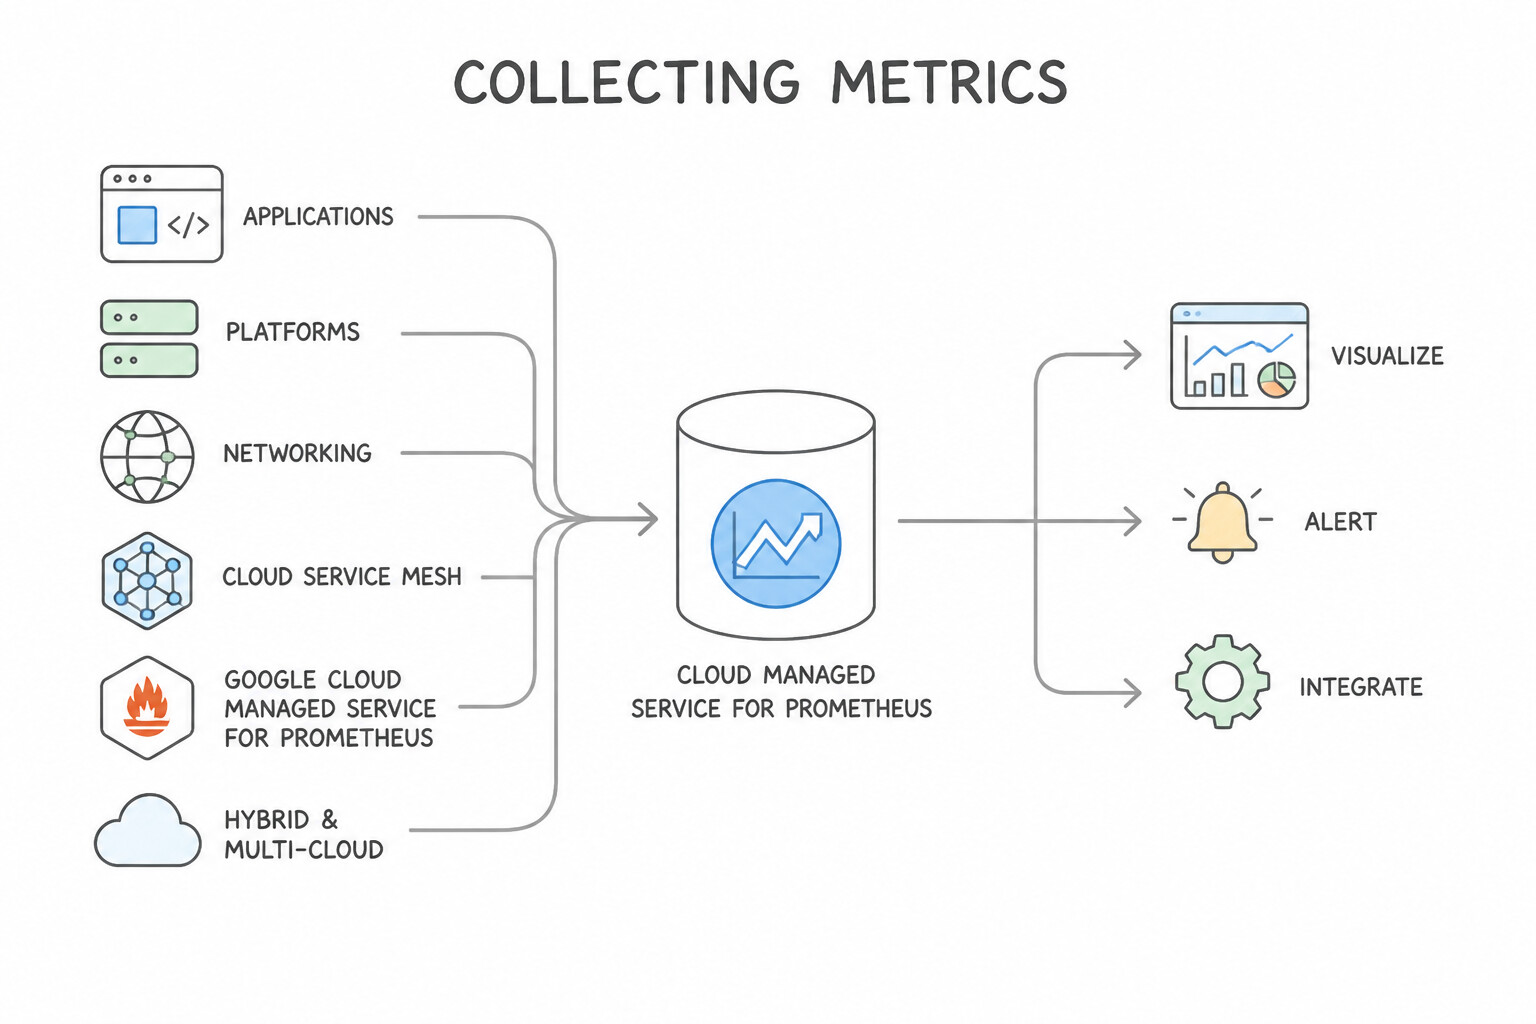
- Collecting Metrics (
GMP,OpenTelemetry,Cloud Service Mesh—4.1c): - Google Cloud Managed Service for Prometheus (
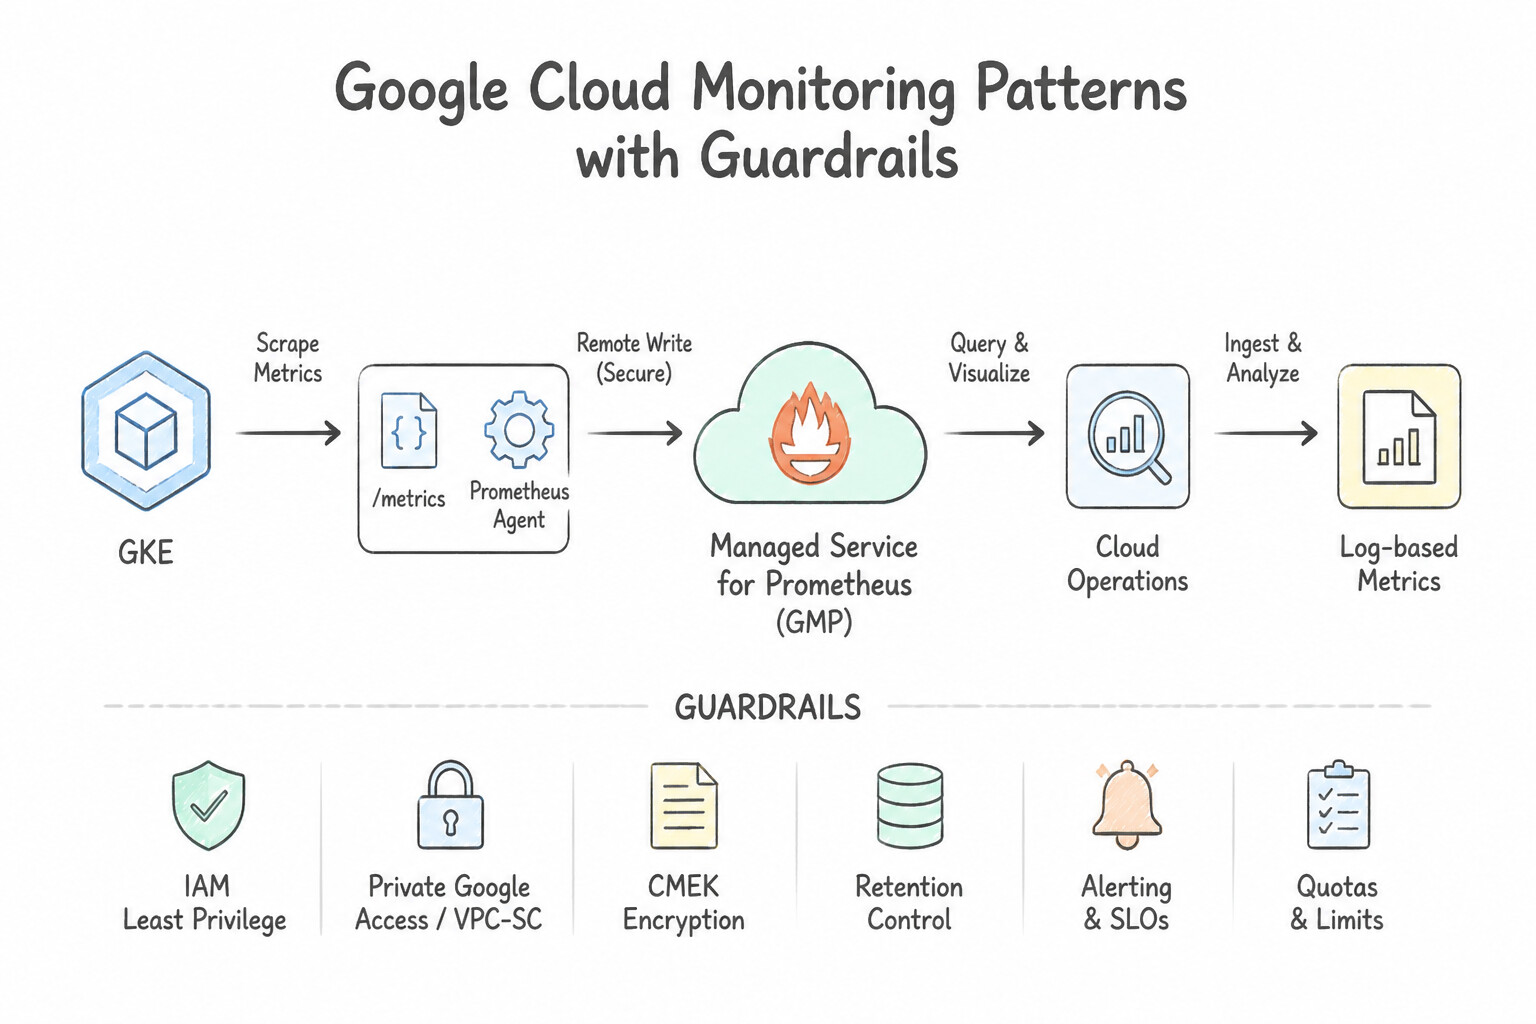
GMP): Drop-in managed replacement for self-hosted Prometheus on GKE and hybrid/multi-cloud Kubernetes clusters. EnableManaged Prometheuson the GKE cluster and deploy aPodMonitoring(namespace-scoped) orClusterPodMonitoringCRD specifying the pod label selector, port, and/metricsscrape interval—metrics flow directly into Cloud Monitoring where existing Grafana dashboards and PromQL alerts query them unchanged! - OpenTelemetry (
OTel): The vendor-neutral open-source standard for instrumenting applications once (OpenTelemetry SDK→OTLPexporter →OpenTelemetry Collectoror direct to Google Cloud Telemetry API). Avoids proprietary SDK lock-in across hybrid and multi-cloud environments. - Cloud Service Mesh (
CSM): Automatically emits Golden Signal metrics (request rate, error rate, latency distributions) and mTLS telemetry for every microservice hop without modifying application code.
Key Implementation Patterns
- GKE Prometheus Integration: Use Enable Google Cloud Managed Service for Prometheus with managed collection on the GKE cluster. Managed Service for Prometheus provides a serverless experience for Prometheus metrics. (Avoid alternative: Self-hosting Prometheus increases operational overhead.)
- Log-based Metrics for Legacy Apps: Use Create a distribution log-based metric. Use a regular expression to extract the numeric latency value. Distribution metrics extract numeric values from log data, enabling the calculation of histograms and percentiles. (Avoid alternative: Counter metrics only count occurrences and cannot extract numerical values for distribution analysis.)
- Custom Application Metrics via Ops Agent: Use Edit the Ops Agent configuration file to add a receiver with type prometheus that points to the local metrics endpoint. The Ops Agent natively supports scraping OpenMetrics data via the prometheus receiver configuration. (Avoid alternative: Pushing metrics directly requires code changes and creates vendor lock-in, rather than using the standard agent-based collection.)
Key Takeaways (4.1c)
- Google Cloud Managed Service for Prometheus eliminates the need to manage Prometheus servers and storage.
- It supports existing Prometheus client libraries and PromQL queries.
- Managed collection in GKE creates a set-and-forget scraping pipeline using Kubernetes Custom Resources.
- Use Log-based Metrics to monitor applications without modifying source code.
Consideration 4.1d: Creating synthetic monitors to proactively probe application endpoints and workflows
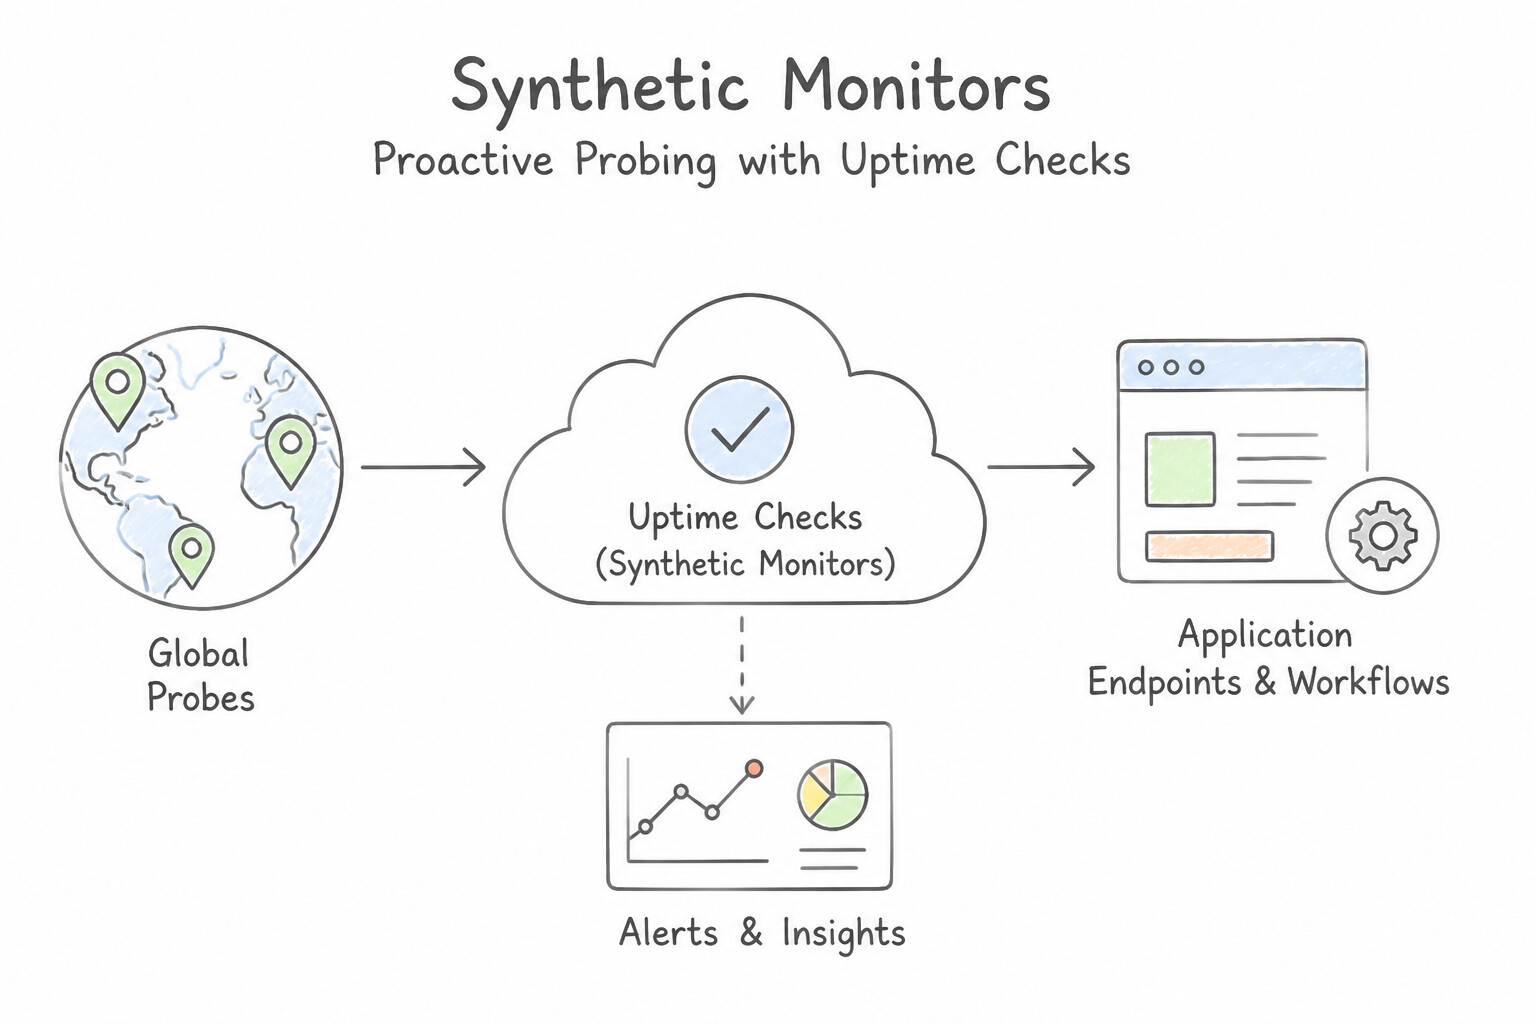
- Proactive Probing with Uptime Checks & Synthetic Monitors (4.1d):
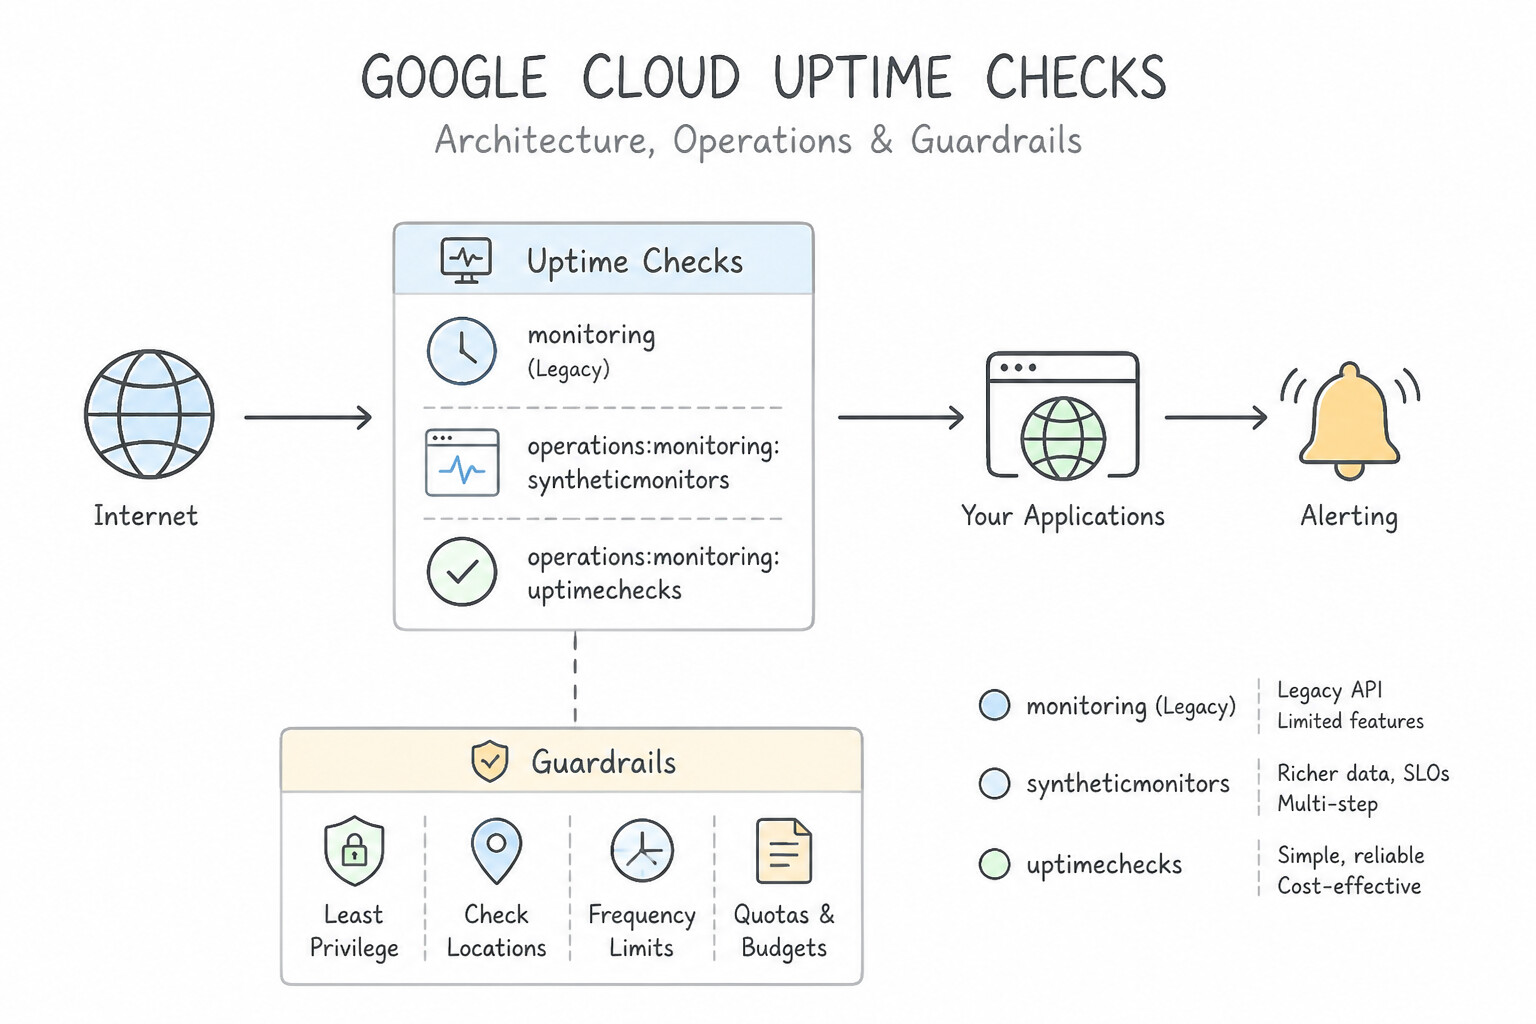
- Uptime Checks: Lightweight periodic HTTP/HTTPS/TCP requests sent from globally distributed Google Cloud locations (or against private internal IPs via Service Directory / Private VPC) to verify status codes (
200 OK), response latency, SSL certificate expiration days, and response body regex matches. - Synthetic Monitors (Powered by Cloud Run functions + Mocha/Playwright/Puppeteer): Go beyond simple single-URL pings by executing stateful, multi-step headless browser or API user journeys (e.g., Load homepage → Log in with test user → Add item to cart → Verify checkout button renders) and alerting immediately if any step in the workflow breaks.
Key Implementation Patterns
- Verifying Critical User Workflows: Use Create a synthetic monitor in Google Cloud Monitoring that runs a Node.js script to simulate the user steps. Synthetic monitors allow you to script complex user interactions to verify multi-step workflows proactively. (Avoid alternative: A standard uptime check only tests if a single URL loads, failing to test the complex logic of the checkout workflow.)
- Validating Application Version Deployment: Use Create an HTTP uptime check. In the Response Validation section, enable Content matching and specify the build hash. Content matching allows an uptime check to validate that a specific substring appears in the response body.
- Monitoring Internal VPC Endpoints: Use Configure a Private Uptime Check in Cloud Monitoring targeting the internal IP addresses of the services. Private Uptime Checks are designed specifically to probe internal IP addresses within a VPC. (Avoid alternative: Public uptime checks cannot route to private internal IP addresses.)
Key Takeaways (4.1d)
- Use Uptime Checks for simple availability monitoring (Is it up?).
- Use Synthetic Monitors for complex workflow validation (Does it work?).
- Proactive monitoring generates test traffic; reactive monitoring analyzes real traffic.
- Prioritize managed services over self-managed VMs for operational tools.
Consideration 4.1e: Creating custom metrics, including log-based metrics
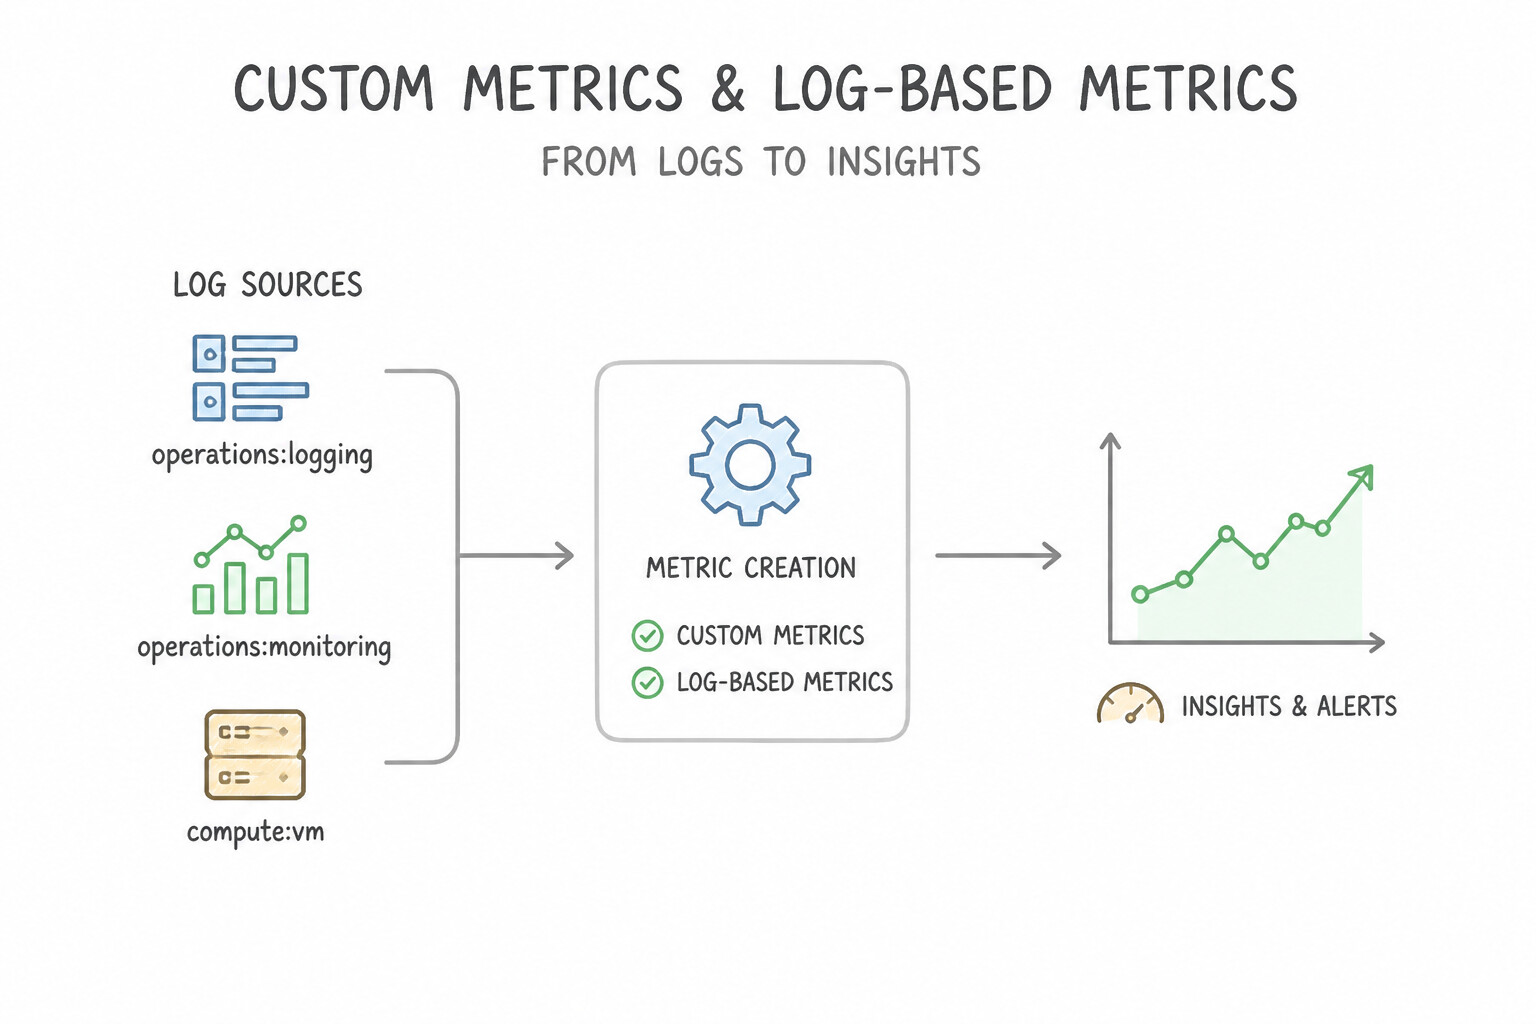
- Custom Metrics & Log-Based Metrics (4.1e):
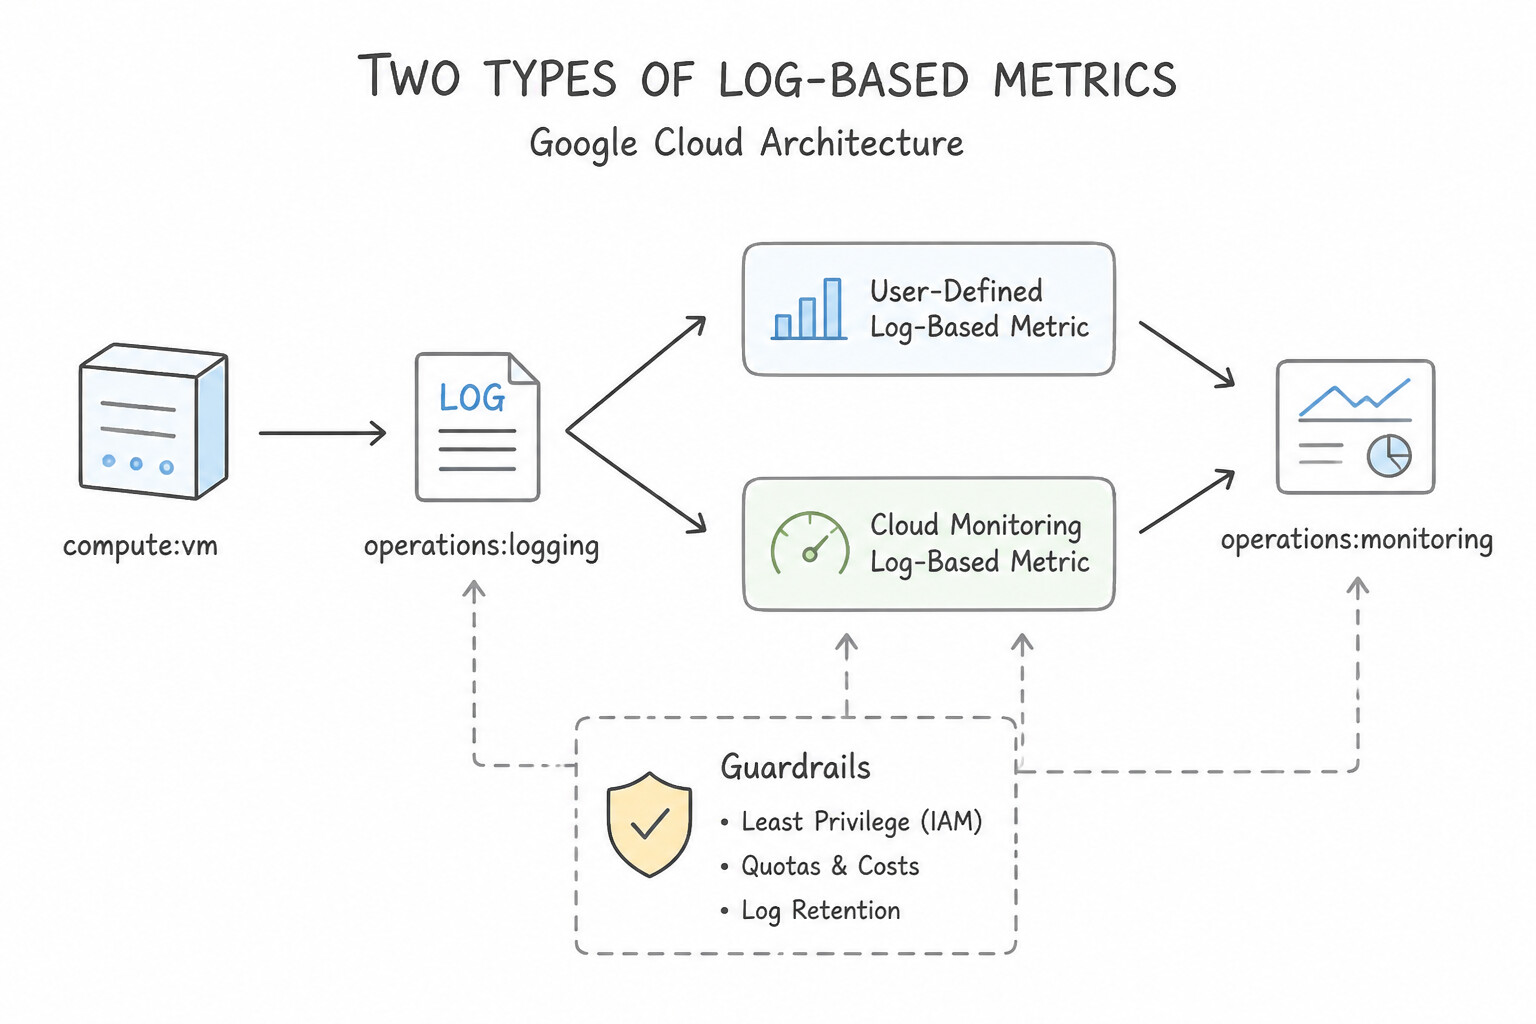
- Two Types of Log-Based Metrics:
- Counter Metric: Counts the number of log entries matching a filter (e.g., counting
ERRORentries containing"PaymentGatewayTimeout"). - Distribution Metric: Extracts a numeric value from a log field (using a regular expression) and builds a statistical histogram (
p50,p95,p99)—for example, extractingprocessing_time_ms=(\d+)from a legacy application's unstructured text log! - Crucial Ordering Rule in Log Router: User-defined Log-Based Metrics are evaluated at the Log Router before
_Defaultsink Exclusion Filters! This means you can extract a lightweight Log-Based Metric (counting200 OKrequests or measuring latency distributions) and simultaneously exclude the raw verbose log entries from_Defaultstorage to save 95% on log ingestion costs! - Cardinality Guardrail: Never use unbounded high-cardinality fields (such as
user_id,request_id,ip_address, orsession_token) as custom metric labels—high label cardinality explodes time-series counts and degrades query performance.
Key Implementation Patterns
- Monitoring Legacy Applications Without Code Changes: Use Create a log-based counter metric in Cloud Logging with a filter for "Connection Reset". Log-based counter metrics count the number of log entries matching a filter. (Avoid alternative: This requires modifying the application source code, which contradicts the scenario requirements.)
- Handling High Cardinality in Custom Metrics: Use Advise against using "user_id" as a label. Suggest writing the "user_id" to the structured logs instead. Metric labels must have low cardinality. Store high-cardinality data like user IDs in logs, not metric labels. (Avoid alternative: Cloud Monitoring does not automatically fix high-cardinality issues; the data might be dropped or costs will spike.)
- Extracting Latency Data from Text Logs: Use Create a log-based distribution metric. Configure a regular expression extractor to parse the numeric latency value. Distribution metrics extract numeric values from logs to create histograms, enabling percentile calculations like p99.
Key Takeaways (4.1e)
- Log-based metrics bridge the gap between logs (text) and monitoring (numbers).
- Use Counter metrics to count the occurrences of specific log entries.
- Use Distribution metrics to track numeric values extracted from log data (like latency).
- Log-based metrics are ideal for legacy applications where source code modification is not possible.
Quick Decision Cheat Sheet (Subsection 4.1)
If the Scenario Requires... | Choose This Google Cloud Pattern | Avoid This Common Mistake |
|---|---|---|
"Collect both system metrics (CPU/memory/disk) and custom log files from Compute Engine VMs using a single supported agent" | Install the unified Ops Agent | Installing both legacy stackdriver-agent and google-fluentd |
"Measure p95 and p99 latency from a legacy VM application that only writes duration=142ms inside plain-text log lines" | Create a Distribution Log-Based Metric with a regex extractor duration=(\d+)ms | Creating a Counter log-based metric (counters only count log lines, not numeric value distributions) |
"Reduce VPC Flow Logs cost by 80% while still retaining visibility into blocked or external network traffic" | Increase the Aggregation Interval, lower the Sampling Rate, strip unnecessary metadata, and apply a Flow Log Filter | Disabling VPC Flow Logs completely across production subnets |
"Instrument microservices across GKE, Cloud Run, and AWS EKS using a single vendor-agnostic SDK for traces, metrics, and logs" | Instrument with OpenTelemetry ( OTel) exporting via OTLP | Hardcoding three separate cloud-vendor proprietary SDKs inside application business logic |
"Custom metric creation fails or causes massive Cloud Monitoring billing spike after adding customer_uuid and trace_id as labels" | Remove high-cardinality labels ( customer_uuid, trace_id) from the metric descriptor (keep high-cardinality IDs in Cloud Logging / Cloud Trace instead!) | Requesting a quota increase for 10 million active time series |
Further Reading (Subsection 4.1)
- Ops Agent Configuration - Logging Processors — Documentation describing the
jsonprocessor, which parses JSON-formatted fields. - Ops Agent Configuration - Logging Receivers — Details on how to configure the
filesreceiver to read from disk. - Use VPC Flow Logs — Official documentation explaining how to enable VPC Flow Logs, what data they contain, and how to view them in Cloud Logging.
- Cloud Audit Logs overview — Explains the different types of audit logs (Admin Activity vs. Data Access) and their default enablement states.
- Configure Data Access audit logs — Provides step-by-step instructions on how to use the Google Cloud console to enable Data Access audit logs.
- Route log entries — Documentation explaining how to configure exclusion filters to prevent logs from being ingested into log buckets.
Subsection 4.2: Managing and analyzing logs
The Big Picture
Storing all enterprise logs in the default _Default bucket with default settings works for a small prototype, but fails three critical production requirements in production:
- Retention Mismatch & Wrong Export Sink Destinations (4.2b): The
_Defaultlog bucket retains logs for 30 days (and_Requiredretains Admin Activity/System Event logs for 400 days). When financial or healthcare auditors require 7-year immutable retention at minimum cost, or when the security operations center (SOC) needs to stream logs in real time to Splunk / Chronicle SIEM, or when data analysts want to join application logs with BigQuery customer billing tables, you must configure Log Router Sinks pointing to the exact right destination (Cloud Storage, Pub/Sub, BigQuery, or custom Log Buckets). - PII / PHI Leakage into Observability Stores (4.2c): If a developer accidentally logs a JSON request body containing a patient's Social Security Number (
SSN), credit card number, or email address, everyone withroles/logging.viewercan see that sensitive PII/PHI in Logs Explorer! Sensitive data must be redacted at the source (via Ops Agentmodify_fields/ regex processors or OpenTelemetry redaction processors) or de-identified via Sensitive Data Protection (Cloud DLP) before landing in long-term analytics stores, and restricted via fine-grained Log Views. - Slow Regex Hunting Across Terabytes of Logs (
4.2a,4.2d): Searching across billions of log lines using inefficient substring scans instead of indexed Logging Query Language (LQL) fields, Log Analytics (BigQuery SQL), and Gemini Cloud Assist wastes critical minutes during P0 triage.
Consideration 4.2a: Analyzing logs using the Logs Explorer and the Logging query language
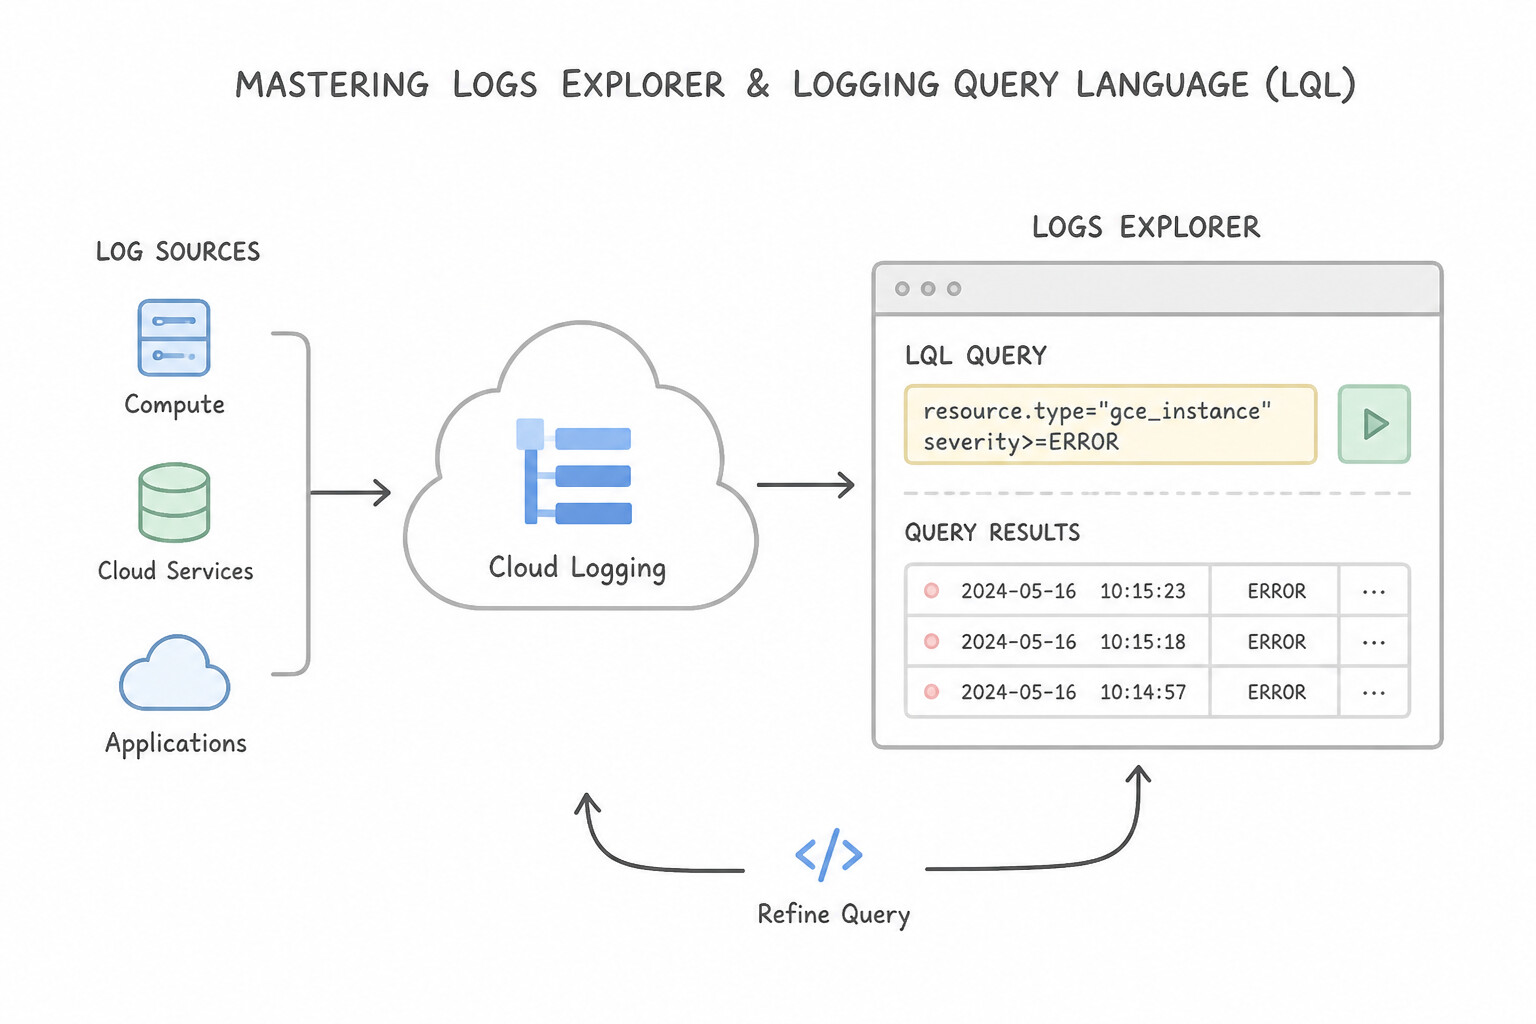
- Mastering Logs Explorer & Logging Query Language (
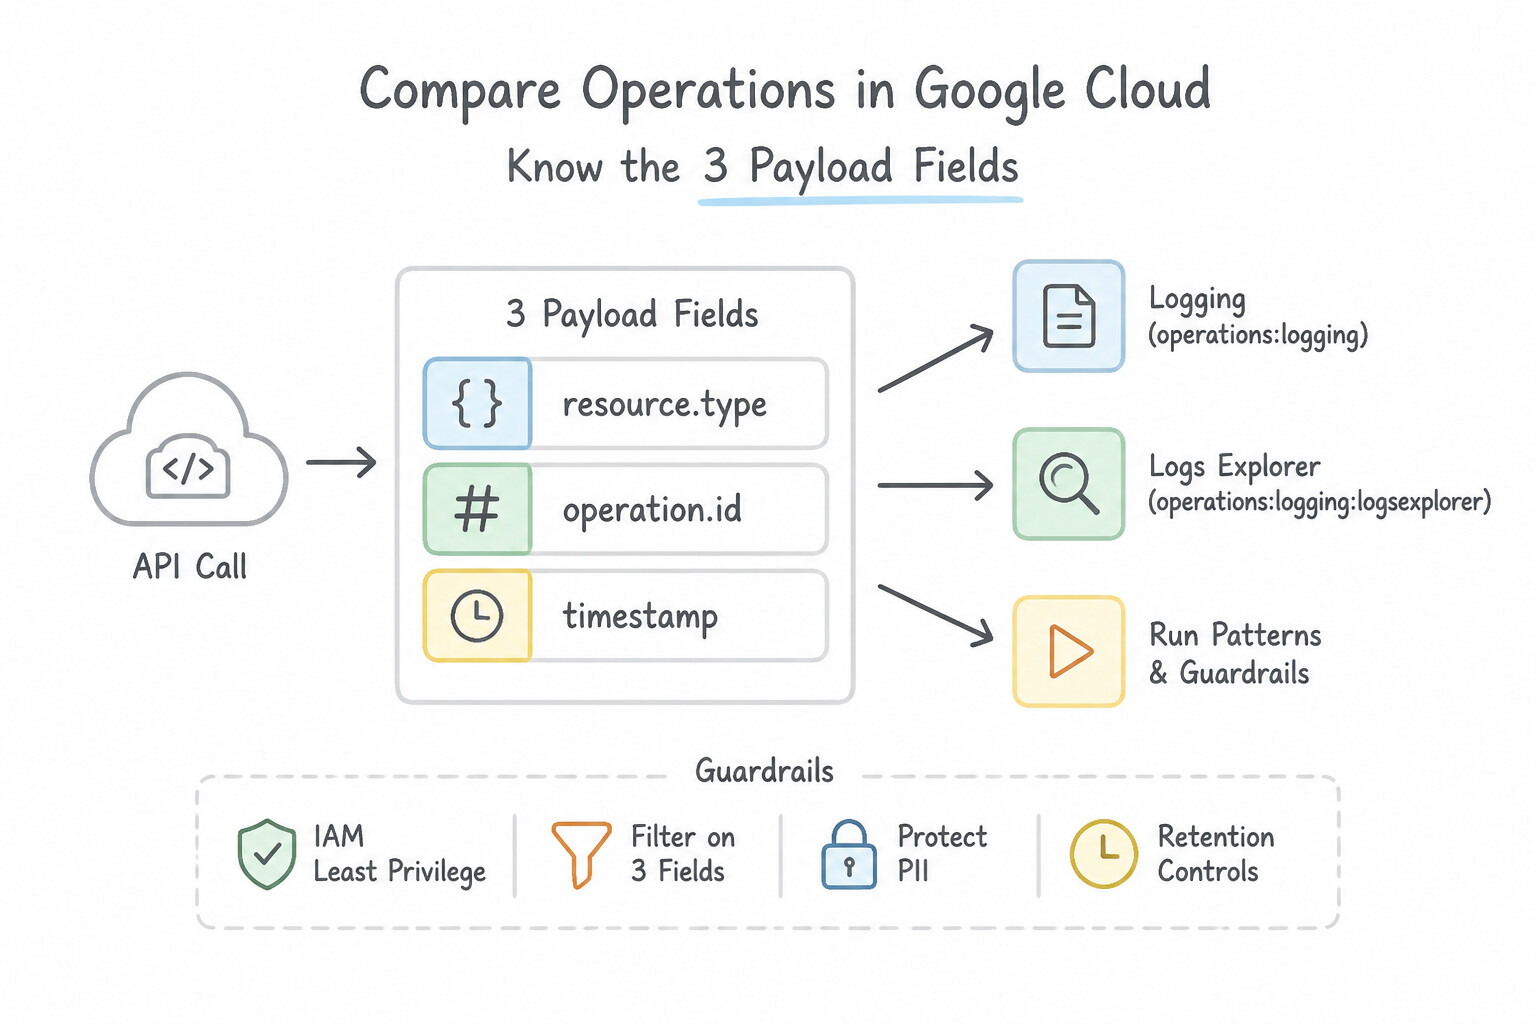
LQL—4.2a): - Know the 3 Payload Fields:
textPayload: Unstructured plain-text string (slowest to parse; avoid in production).jsonPayload: Structured application JSON object—allows fast dot-notation field queries likejsonPayload.order_id="ORD-99"orjsonPayload.latency_ms > 500.protoPayload: Structured Protocol Buffer payload used by Cloud Audit Logs (e.g.,protoPayload.methodName="io.k8s.core.v1.pods.create",protoPayload.authenticationInfo.principalEmail).- High-Speed LQL Performance Rules: Always filter on indexed fields first (
resource.type,resource.labels.*,logName,severity,timestamp) before running regular expression (=~) or substring (:) searches on payload fields. Use exact equality (=) over substring (:) whenever possible. - Log Analytics (Powered by BigQuery): Upgrading a Log Bucket to Log Analytics allows querying logs directly with Standard SQL inside the Cloud Console (and optionally linking the bucket as a read-only BigQuery dataset with zero extra storage cost or duplicate export sinks!).
Key Implementation Patterns
- Filtering Structured Logs by Nested Fields: Use In the Logs Explorer, run the query: jsonPayload.payment_info.status="DECLINED". Structured logs populate the
jsonPayloadfield; use dot notation to query nested fields. (Avoid alternative:textPayloadis used for unstructured text logs, not structured JSON logs.) - Using Regular Expressions for Pattern Matching: Use Use the query textPayload =~ "ERR-[0-9]+" in the Logs Explorer. The =~ operator enables Regular Expression matching, which is required to identify specific patterns like 'ERR-' followed by numbers. (Avoid alternative: The colon operator searches for text containment, not pattern matching with wildcards.)
- Correlating Microservices with Trace IDs: Use In Logs Explorer, run a query filtering by
trace="projects/[PROJECT_ID]/traces/abc12345". Filtering by the unique trace field aggregates all logs across distributed services for a single transaction. (Avoid alternative: Filtering by status code only reveals the error itself, not the related events leading up to it.)
Key Takeaways (4.2a)
- jsonPayload is the container for structured application logs in Cloud Logging.
- Use dot notation (e.g.,
parent.child.field) to filter by nested fields in the Logs Explorer.- textPayload is for unstructured logs; protoPayload is for Audit logs.
- labels are for metadata, not the log content itself.
Consideration 4.2b: Exporting and retaining logs (e.g., routing to BigQuery, Pub/Sub, Cloud Storage)
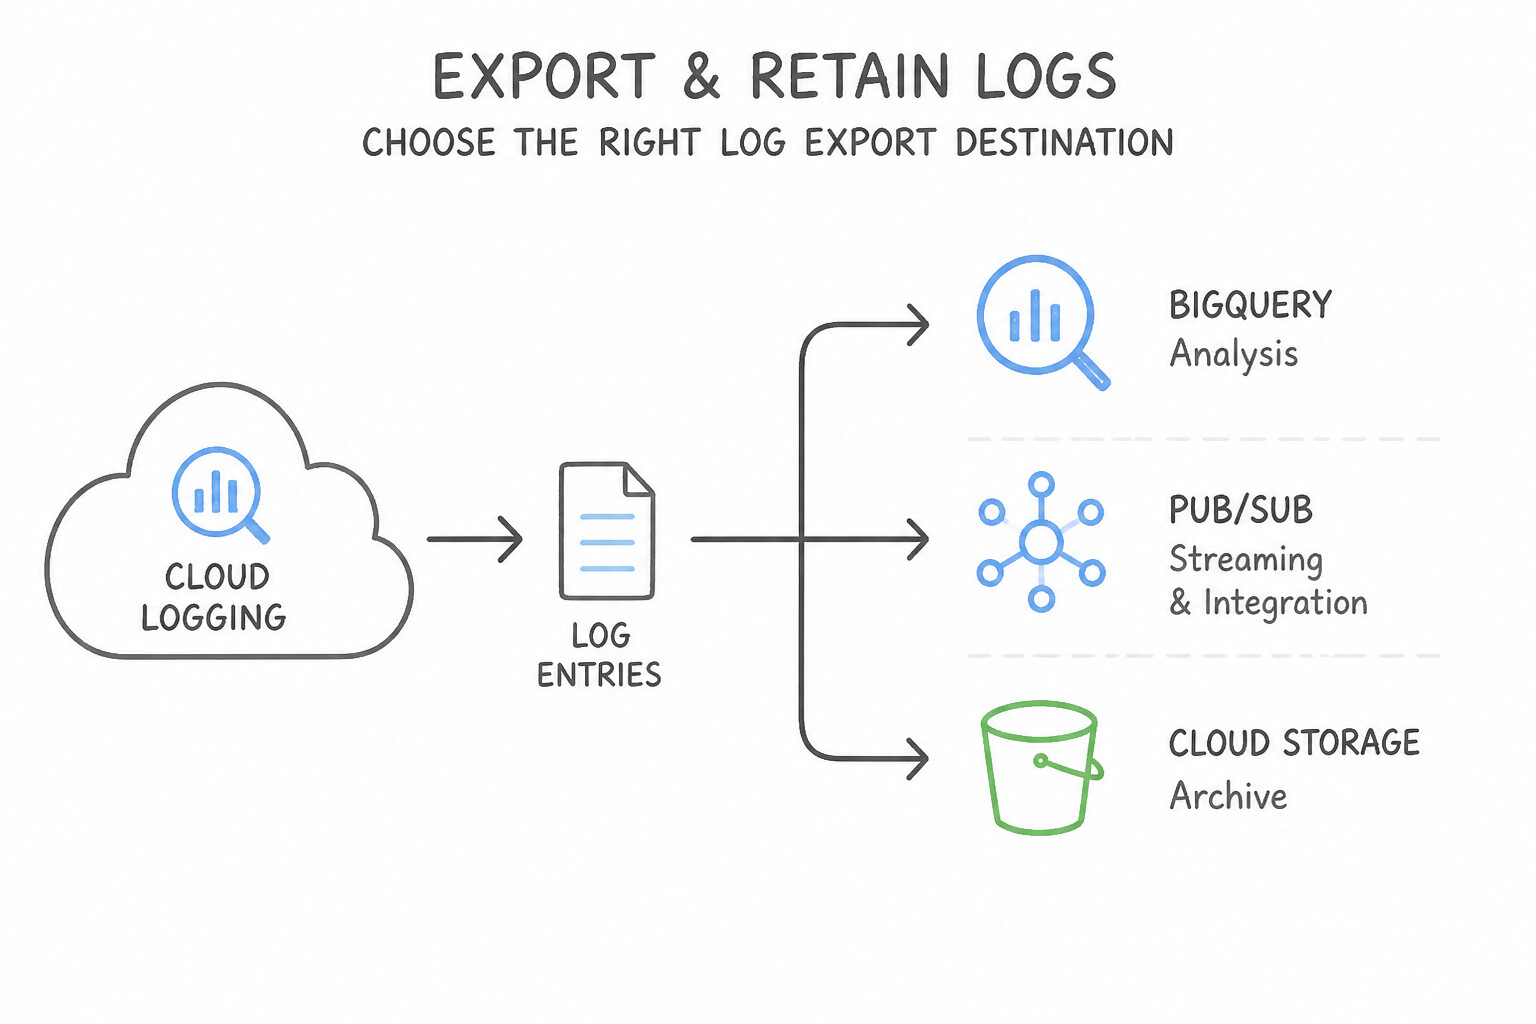
- Choosing the Right Log Export Destination & Retention Strategy (4.2b):
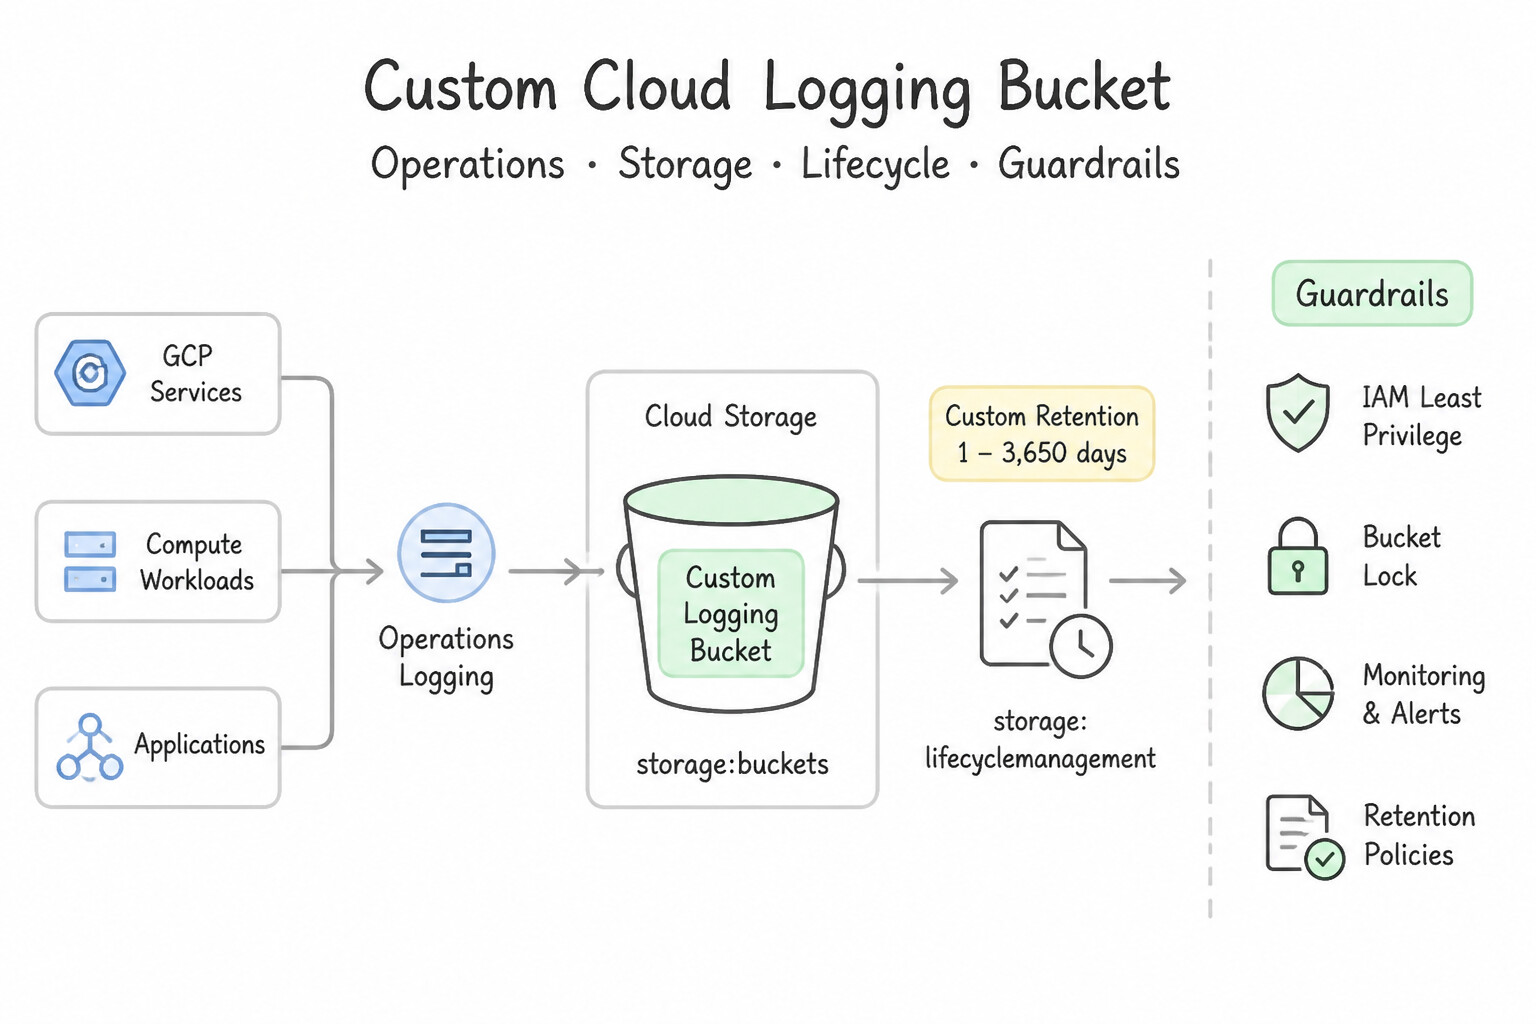
- Custom Cloud Logging Bucket (with Custom Retention 1–3,650 days): Best when you want to keep logs searchable inside Logs Explorer / Log Analytics for longer than 30 days, store logs in a specific compliant region, or isolate access via Log Views.
- Cloud Storage (
GCS) Sink: Best for low-cost, long-term archival compliance (e.g., 5–10 years of audit logs). Pair with Archive / Coldline storage class, Object Lifecycle Management, and Bucket Lock (Retention Policy) for immutable WORM compliance. (Note: GCS sinks write logs in hourly batches, not real time). - BigQuery Sink (or Log Analytics Linked Dataset): Best for SQL analytics, security hunting, and joining logs with enterprise data warehouse tables.
- Cloud Pub/Sub Sink: Best for real-time streaming to third-party SIEMs (Splunk, Datadog, Elastic), triggering automated incident remediation via Cloud Run functions, or passing logs through a Dataflow + Sensitive Data Protection (DLP) redaction pipeline.
Key Implementation Patterns
- Cost-Effective Long-Term Compliance Archival: Use Create a log sink to a Cloud Storage bucket. Configure an Object Lifecycle Management rule to move the logs to Archive Storage. Cloud Storage is best for long-term archival, and the Archive class is the most cost-effective for rarely accessed data.
- Real-time Log Analysis with SQL: Use Create a sink to export the logs to a BigQuery dataset. BigQuery supports standard SQL queries and joins, making it the correct choice for complex log analysis. (Avoid alternative: Cloud Storage is for archival and backup, not for real-time SQL analysis.)
Key Takeaways (4.2b)
- Use Cloud Storage log sinks for long-term, low-cost compliance archival.
- BigQuery log sinks are for analytics, not pure backup.
- Pub/Sub is for streaming and integration, not storage.
- Use Object Lifecycle Management to transition data to cheaper storage classes (like Archive) automatically.
Consideration 4.2c: Handling sensitive data (e.g., using log processors to redact personally identifiable information [PII], protected health information [PHI])
!Handling sensitive data (e.g., using log processors to redact personally identifiable information [PII], prote Handling sensitive data (e.g., using log processors to redact personally identifiable information [PII], protected health information [PHI]).
![Handling sensitive data (e.g., using log processors to redact personally identifiable information [PII], prote](images/pdoe-4.2c-1-redacting-pii-phi.jpg)
- Redacting PII/PHI & Controlling Log Access (4.2c):
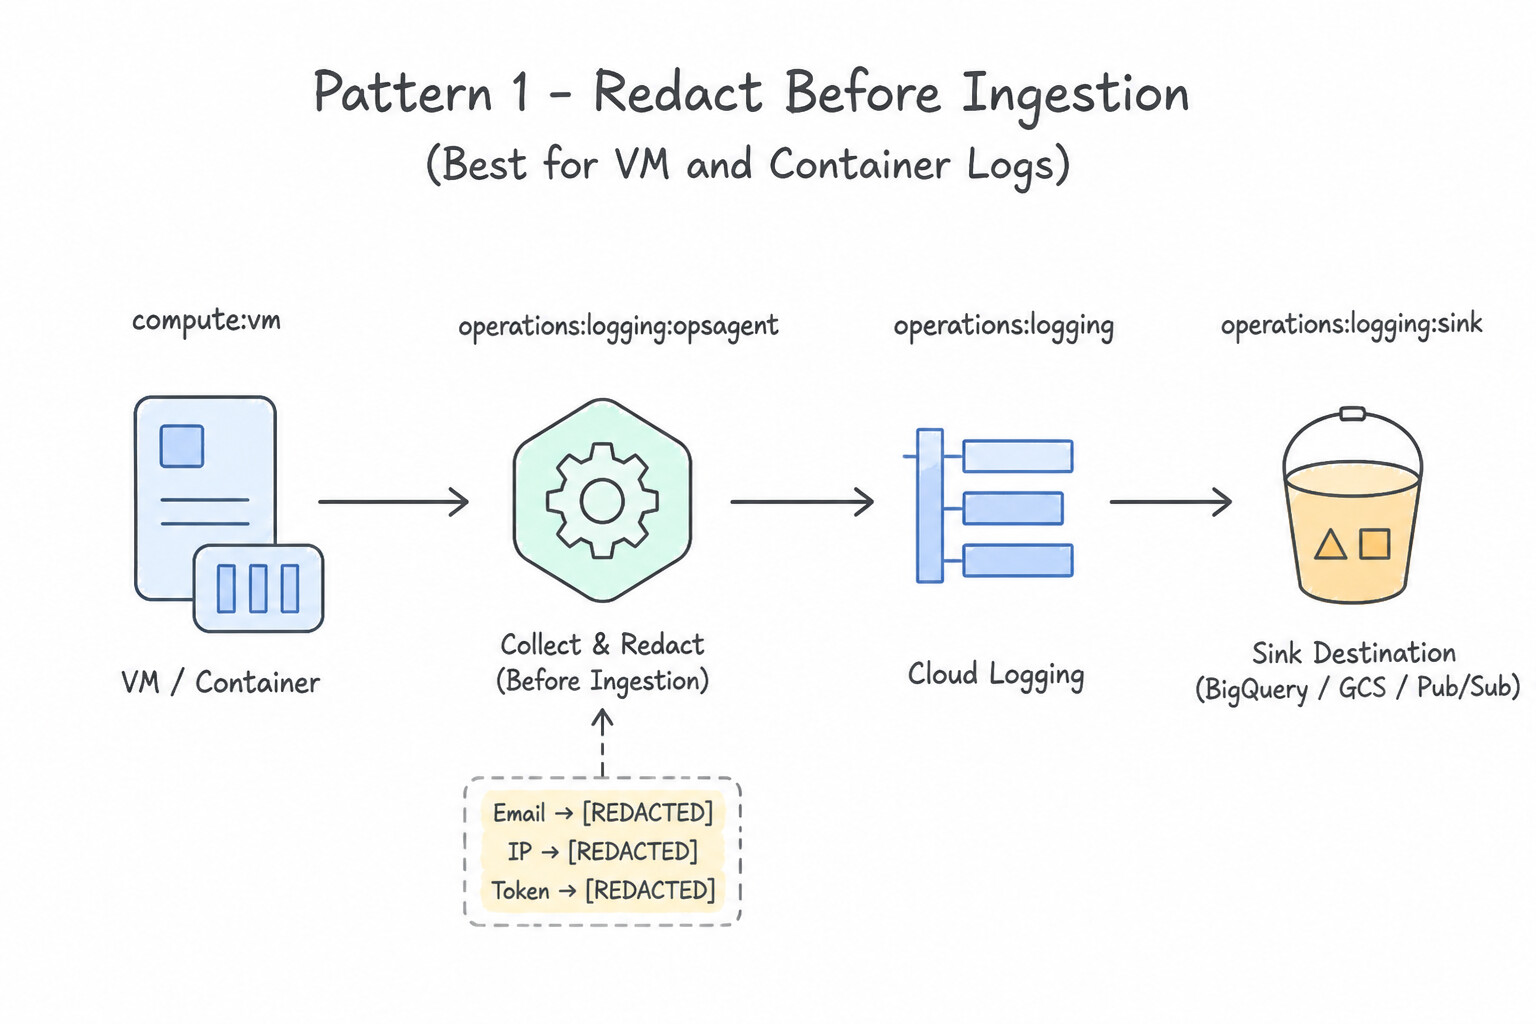
- Pattern 1 — Redact Before Ingestion (Best for VM/Container Logs):
- In the Ops Agent (
/etc/google-cloud-ops-agent/config.yaml) or OpenTelemetry Collector, configure a processor (modify_fields/transform) with a regular expression replacement to mask credit card numbers, SSNs, or Bearer tokens with[REDACTED]before the log entry ever leaves the VM/cluster! - In GKE, use a Fluent Bit / OTel sidecar or DaemonSet filter (or sanitize in the application logger middleware) before writing to
stdout. - Pattern 2 — Streaming De-Identification with Sensitive Data Protection (
Cloud DLP): - When logs come from managed services where you cannot install an agent, route the logs via a Log Router Sink to Pub/Sub (excluding them from
_Defaultstorage) → process via Cloud Dataflow calling Sensitive Data Protection (deidentifyContent/ InfoType masking or crypto-tokenization) → write the sanitized logs to BigQuery / Cloud Storage / Custom Log Bucket. - Pattern 3 — Fine-Grained Read Isolation with
Log Views: - Instead of granting
roles/logging.viewer(which grants read access to all logs in_Default), create a custom Log View on a Log Bucket filtered to a specific namespace or excluding sensitive audit logs, and grantroles/logging.viewAccessorconstrained via an IAM Condition to that specific Log View!
Key Implementation Patterns
- Ops Agent Redaction Configuration: Use Configure the Ops Agent config.yaml file. Add a processor that uses regex to replace the sensitive patterns in the log entries. The Ops Agent allows you to configure processors on the VM to mask data using regex before the logs are sent to Cloud Logging.
- De-identification Pipeline with Dataflow: Use Create a Log Sink to export the logs to a Pub/Sub topic. Create a Dataflow job that reads from the topic, uses the Cloud Data Loss Prevention (DLP) API to tokenize the email addresses, and writes the results to BigQuery. Using Pub/Sub and Dataflow allows you to transform and tokenize data in flight before it reaches storage.
- Log Router Exclusion Filters: Use Create an exclusion filter on the
_Defaultsink in the Log Router to match the DEBUG log entries. Exclusion filters in the Log Router allow you to discard specific log entries before they are stored in a bucket. (Avoid alternative: Redeploying the application takes time and does not stop the logs immediately during the build process.)
Key Takeaways (4.2c)
- The Ops Agent is the primary tool for collecting logs from Compute Engine VMs.
- Processors in the Ops Agent
config.yamlallow you to modify, parse, and redact log data locally.- Redacting data at the source (on the VM) is a best practice for handling PII/PHI to prevent leaks.
- Exclusion filters in Cloud Logging only prevent storage, not transmission.
Consideration 4.2d: Using Gemini Cloud Assist for AI-powered log analysis
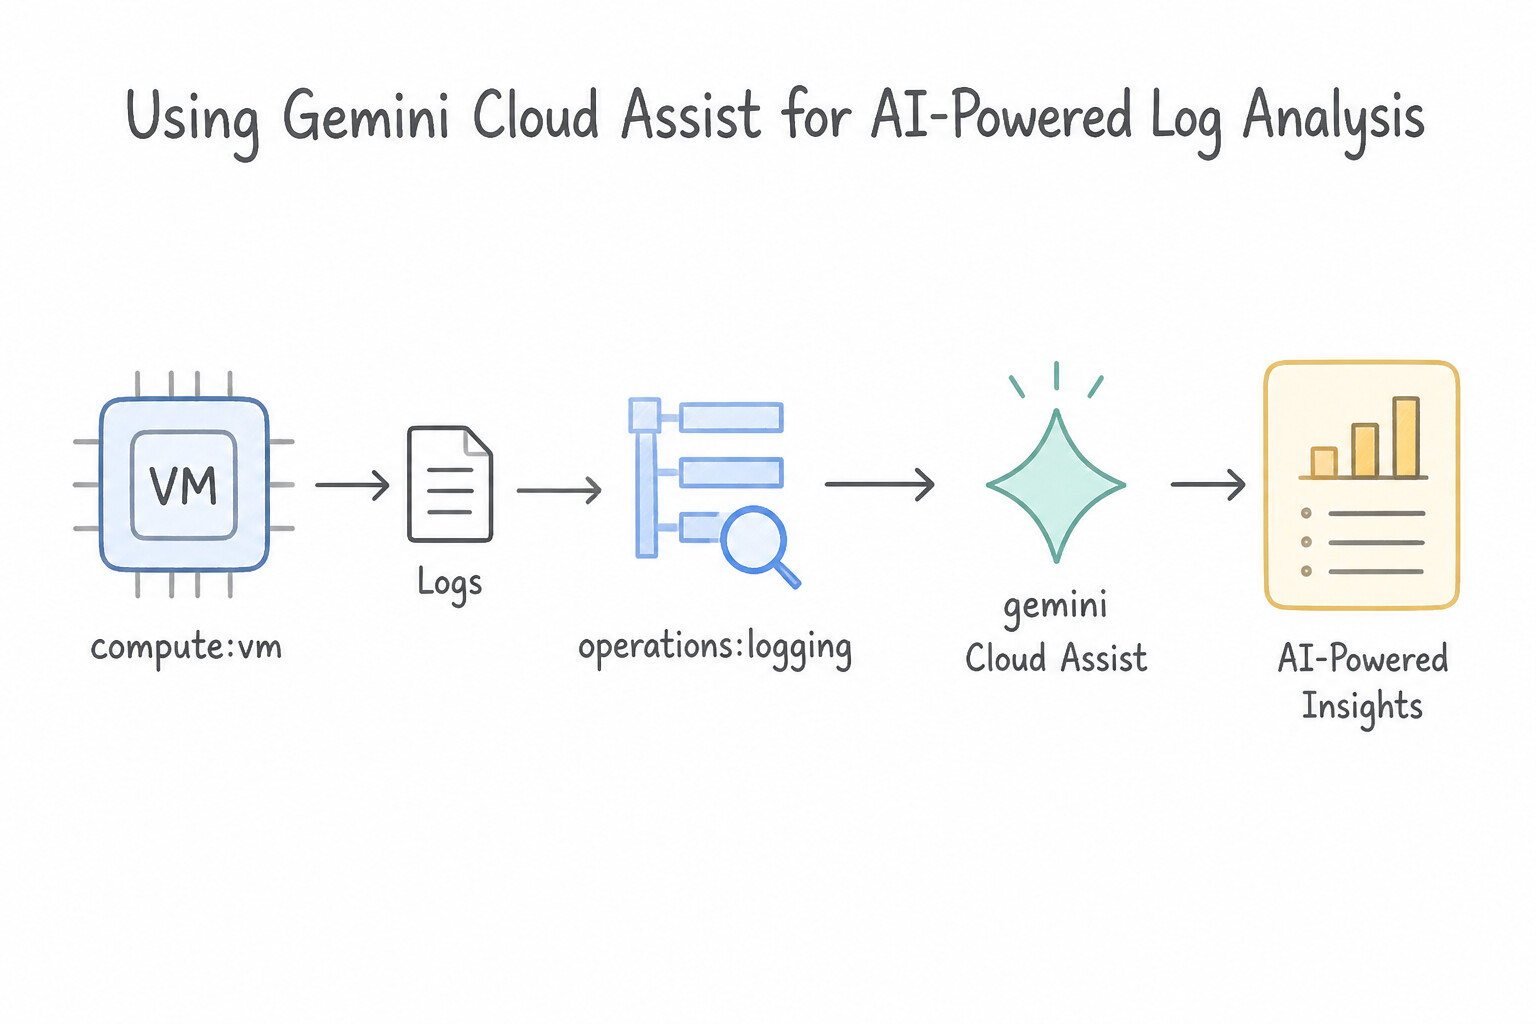
- Using Gemini Cloud Assist for AI-Powered Log Analysis (4.2d):
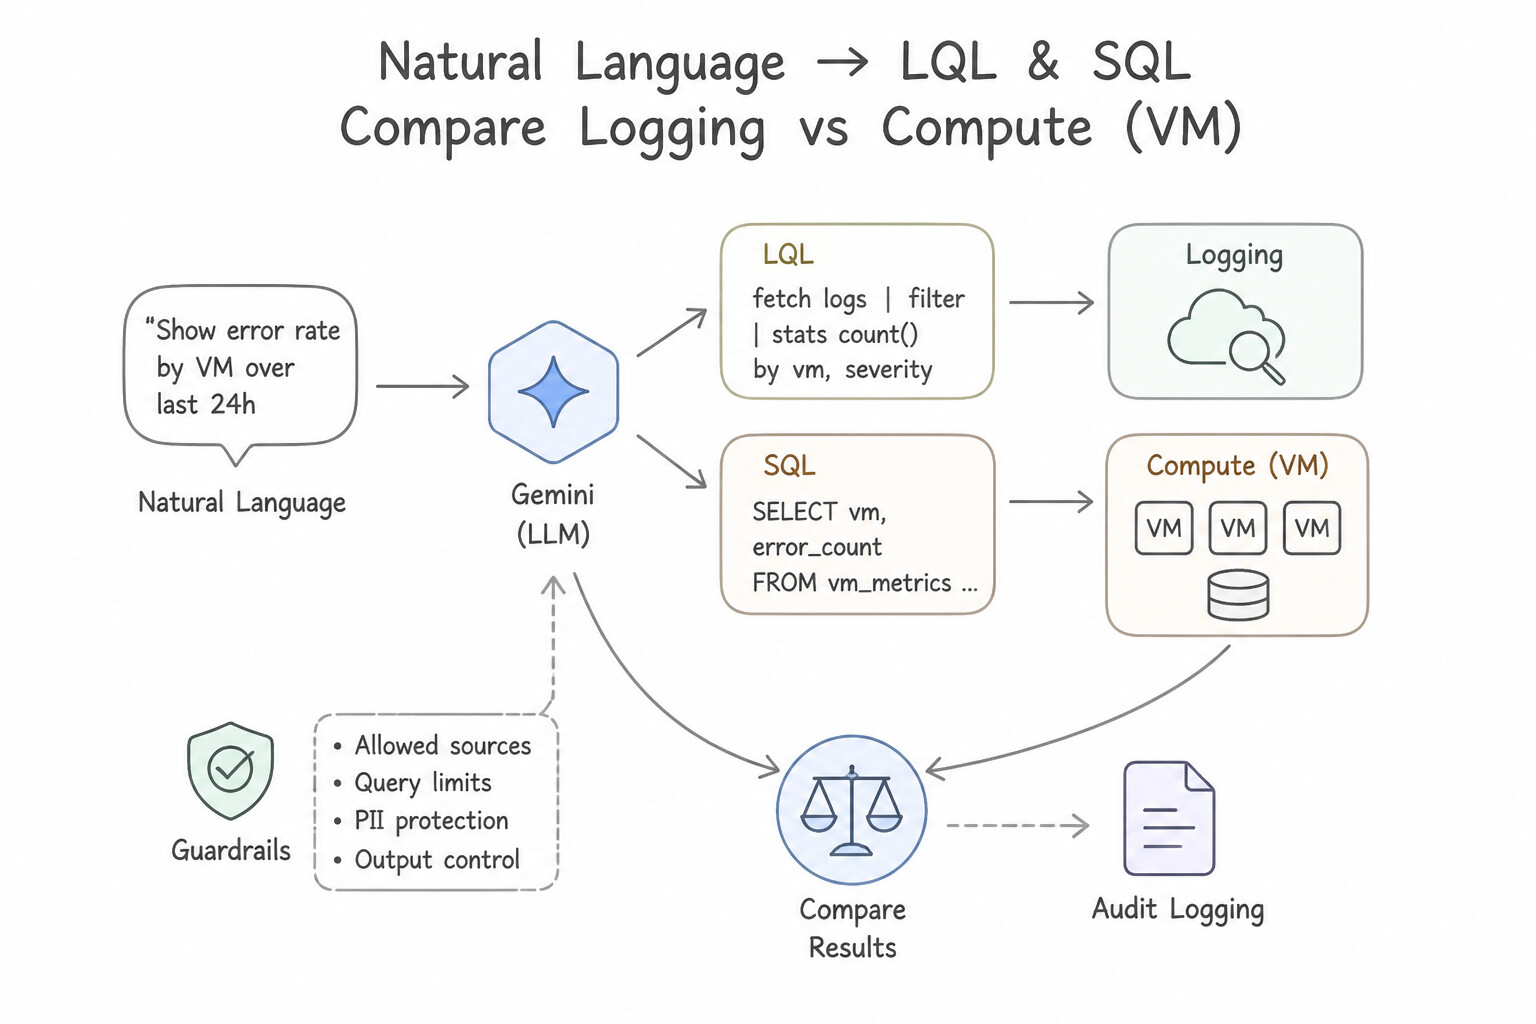
- Natural-Language to LQL & SQL: Instead of memorizing complex nested
protoPayloadpaths or regex syntax during an outage, describe your filter in plain English in Logs Explorer or Log Analytics (e.g., "Show me all failed GKE pod scheduling events in prod-cluster over the last hour") and Gemini Cloud Assist generates the exact LQL or BigQuery SQL query. - Instant Log Entry & Stack Trace Summarization: Click Explain this log entry in Logs Explorer to have Gemini Cloud Assist decode cryptic error codes, IAM permission denials, or multi-frame stack traces and suggest concrete remediation steps backed by Google Cloud documentation.
Key Implementation Patterns
- Deciphering Cryptic Stack Traces: Use Select the log entry in Logs Explorer and click the "Explain this log entry" button to generate an analysis using Gemini. Gemini in Logs Explorer can instantly analyze and explain complex log entries, offering summaries and actionable advice.
- Remediation Suggestions for GKE Errors: Use Select the log entry, click "Explain this log entry", and review the "Suggested remediation" section in the Gemini pane. Gemini in Cloud Logging provides a "Suggested remediation" section that offers actionable fixes for common errors like OOMKilled.
- Generating SQL for Log Analytics: Use In the Log Analytics interface, open the Gemini assistance pane and type a prompt describing your query goals. Gemini in Log Analytics converts natural language prompts into executable SQL queries. (Avoid alternative: Manual construction does not utilize natural language generation features.)
Key Takeaways (4.2d)
- Integrated AI Analysis: Use the 'Explain this log entry' feature in Logs Explorer to quickly decipher complex or cryptic errors.
- Security First: Avoid copying internal logs to public AI tools to maintain data privacy.
- Efficiency: AI assistance reduces the need to manually cross-reference source code for every error, speeding up troubleshooting.
- Gemini in Cloud Logging can interpret complex log entries and explain them in simple terms.
Quick Decision Cheat Sheet (Subsection 4.2)
If the Scenario Requires... | Choose This Google Cloud Pattern | Avoid This Common Mistake |
|---|---|---|
"Query application logs using Standard SQL and join them with BigQuery tables without setting up a duplicate BigQuery export sink" | Upgrade the Log Bucket to Log Analytics and enable a Linked BigQuery Dataset | Exporting logs to Cloud Storage and manually loading CSVs into BigQuery |
"Redact PII/PHI ( SSN, EMAIL_ADDRESS) from managed-service logs before storing in BigQuery for analytics" | Route logs via Log Router → Pub/Sub → Dataflow with Sensitive Data Protection ( Cloud DLP) → BigQuery (and exclude raw logs from _Default) | Running a nightly SQL UPDATE statement in BigQuery after raw PII was already stored and queried |
"Which LogEntry field holds Cloud Audit Log details like principalEmail and methodName?" | protoPayload | textPayload or jsonPayload |
"Which LogEntry field holds structured JSON emitted by your microservice to stdout?" | jsonPayload | textPayload |
"Quickly generate a complex LQL filter or summarize a cryptic Cloud Audit Log permission error in the Console" | Use Gemini Cloud Assist inside Logs Explorer | Exporting 10 GB of logs locally to grep through them on a laptop |
Further Reading (Subsection 4.2)
- Logging query language — Refer to the section on 'Values' and 'Conversions' to understand how to query jsonPayload fields specifically.
- Logging query language regular expressions — Documentation describing how to use regular expressions in the Logs Explorer using the comparison operator (=~).
- Correlate log entries — Documentation on how Cloud Run automatically captures traces and how to use them to correlate container logs.
- View logs by trace — General guide on finding and viewing log entries associated with a specific trace in the Logs Explorer.
- Route and store logs — Provides an overview of the Log Router, Sinks, and supported destinations for exporting logs.
- Storage classes — Details the different Cloud Storage classes, including Archive storage, and their intended use cases for cost optimization.
Subsection 4.3: Managing metrics, dashboards, and alerts
The Big Picture
In poorly engineered observability setups, on-call engineers receive 60 noisy Slack/email alerts every day ("Node 14 CPU > 80% for 1 minute", "Pod restarted once"), none of which indicate actual user impact. Inevitably, the team starts ignoring or muting notifications (Alert Fatigue)—and when a real P0 outage strikes at 3:00 AM, either nobody wakes up or the alert fires 45 minutes too late:
- Alerting on Causes Instead of Symptoms (4.3c): High CPU on one VM behind a 20-VM load balancer is not an outage if user requests still succeed in < 100 ms. Conversely, a slow burn of $1.5\%$ HTTP
500errors may never trigger a coarse static threshold (> 5% error rate), yet it will quietly exhaust your entire 30-day 99.9% SLO Error Budget in under 3 days! Google SRE solves this with Multi-Window, Multi-Burn-Rate SLO Alerting. - Misconfigured Charts & Alignment Functions (
4.3a,4.3b): Plotting a latencyDistributionmetric using a line chart of averages hides bimodal tail spikes (always use a Heatmap orp95/p99percentile lines!), and plotting a cumulative counter withoutALIGN_RATEsimply draws an ever-rising diagonal line. - Single-Channel Notification Silos & Missing Playbooks (
4.3d,4.3e): Sending P0 alerts only to email—or paging an on-call engineer without attaching a diagnostic Playbook / Runbook and resource labels in the alert documentation block—delays triage and inflates MTTR.
Consideration 4.3a: Analyzing metrics using the Metrics Explorer
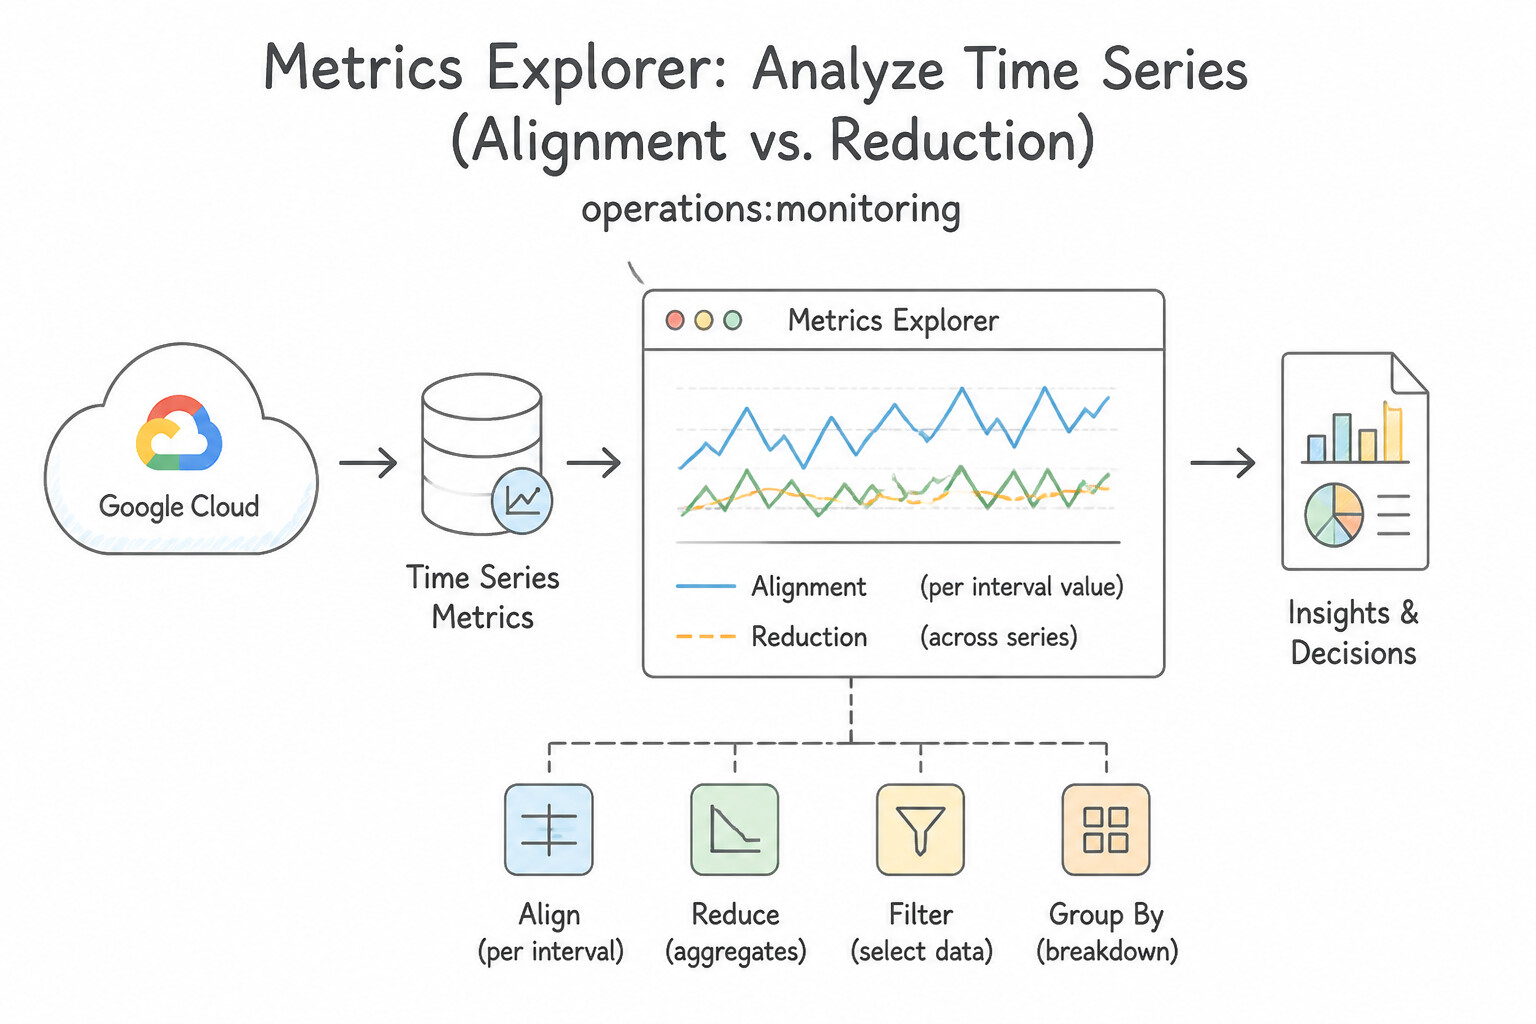
- Analyzing Time Series in Metrics Explorer (
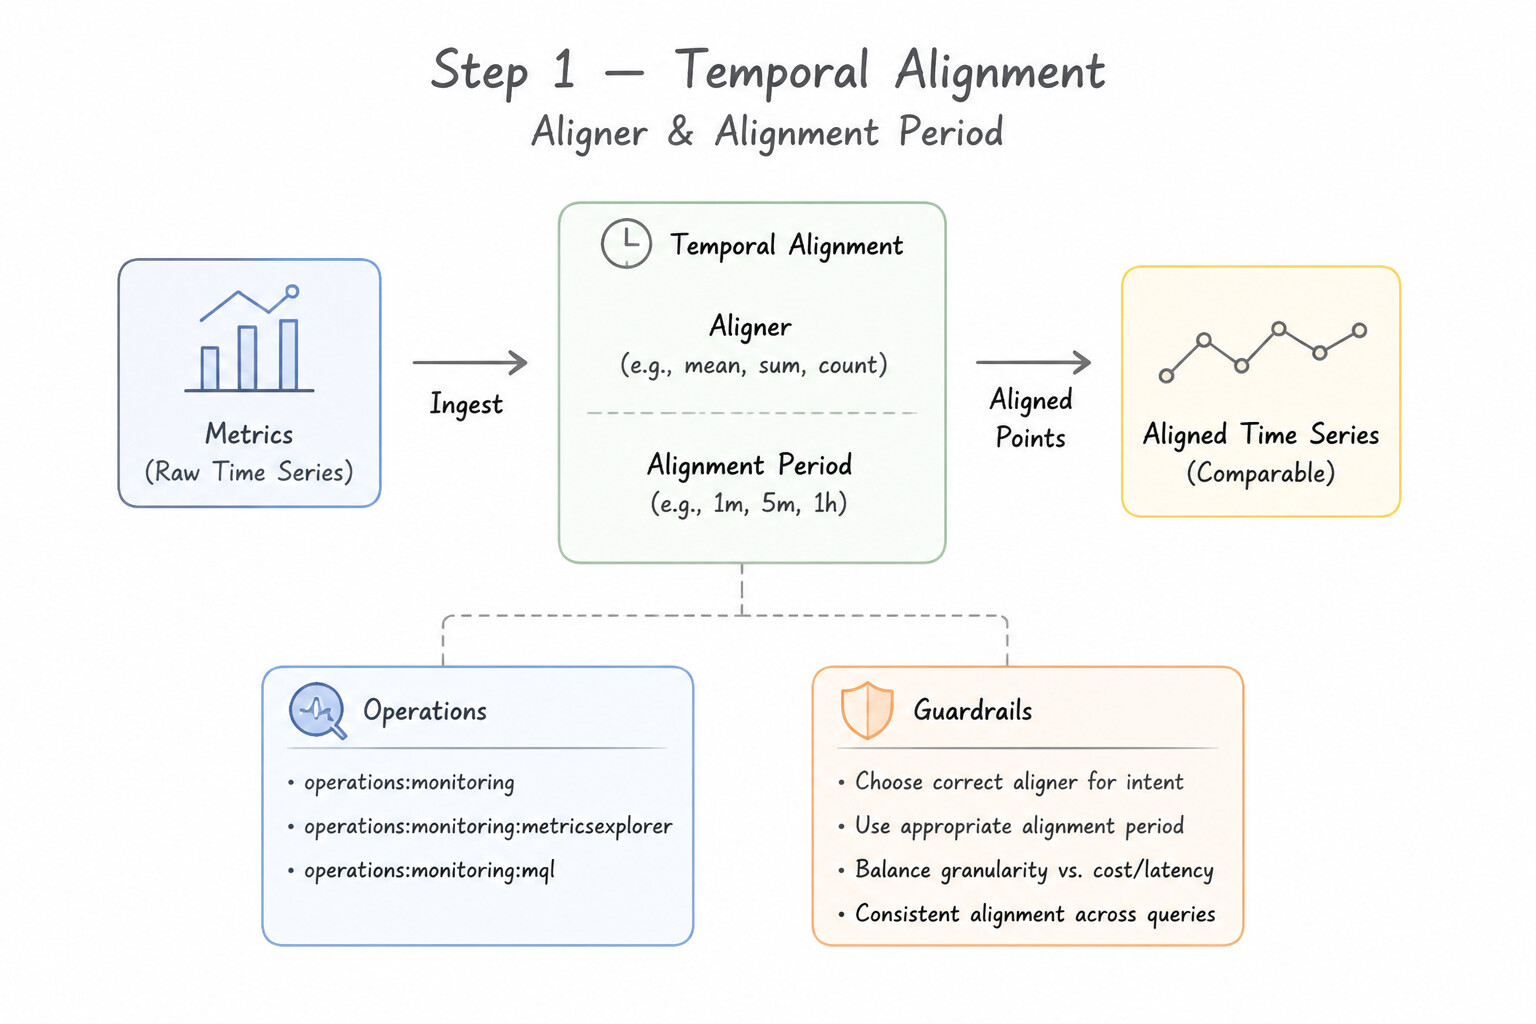
Alignmentvs.Reduction—4.3a): - Step 1 — Temporal Alignment (
Aligner/Alignment Period): Normalizes raw data points within a single time series over a time bucket (e.g., 1 minute): - Use
ALIGN_RATE(orALIGN_DELTA) for Cumulative / Counter metrics (converting total requests since boot intorequests/second). - Use
ALIGN_MEANorALIGN_MAXfor Gauge metrics (like CPU or memory utilization). - Use
ALIGN_PERCENTILE_99/95/50(orALIGN_DELTAfor heatmaps) for Distribution metrics (like HTTP latency histograms). - Step 2 — Cross-Series Aggregation (
Reducer/Group By): Combines multiple aligned time series across instances/zones (e.g.,REDUCE_SUMgrouped byresource.zoneto see total RPS per zone).
Key Implementation Patterns
- Detecting Transient Spikes with Alignment: Use Change the Aligner setting to max. The 'max' aligner displays the highest data point within each time interval, revealing brief spikes that averaging would hide. (Avoid alternative: Increasing the alignment period widens the data window, causing more averaging and smoothing, which hides spikes further.)
- Visualizing Latency Distribution: Use Select the latency distribution metric and configure the visualization type as a Heatmap. Heatmaps visualize distribution metrics to reveal the spread of data and identify outliers. (Avoid alternative: The median metric often hides outliers in the same way an average does.)
- Calculating Error Ratios with MQL: Use Use the Monitoring Query Language (MQL) editor. Fetch the request count metric, filter for the 500 response code, join it with the total request count, and apply the division function. MQL allows you to join two metric streams and perform arithmetic operations like division to calculate ratios directly in Metrics Explorer.
Key Takeaways (4.3a)
- Alignment creates regular data points from irregular raw data for visualization.
- The Mean aligner smooths data and is good for general trends but hides bursts.
- The Max aligner preserves peak values, making it essential for troubleshooting resource exhaustion or crashes.
- Always question the alignment settings if the graph contradicts reported system behavior.
Consideration 4.3b: Managing dashboards (e.g., creating, filtering, sharing, playbooks, PromQL)
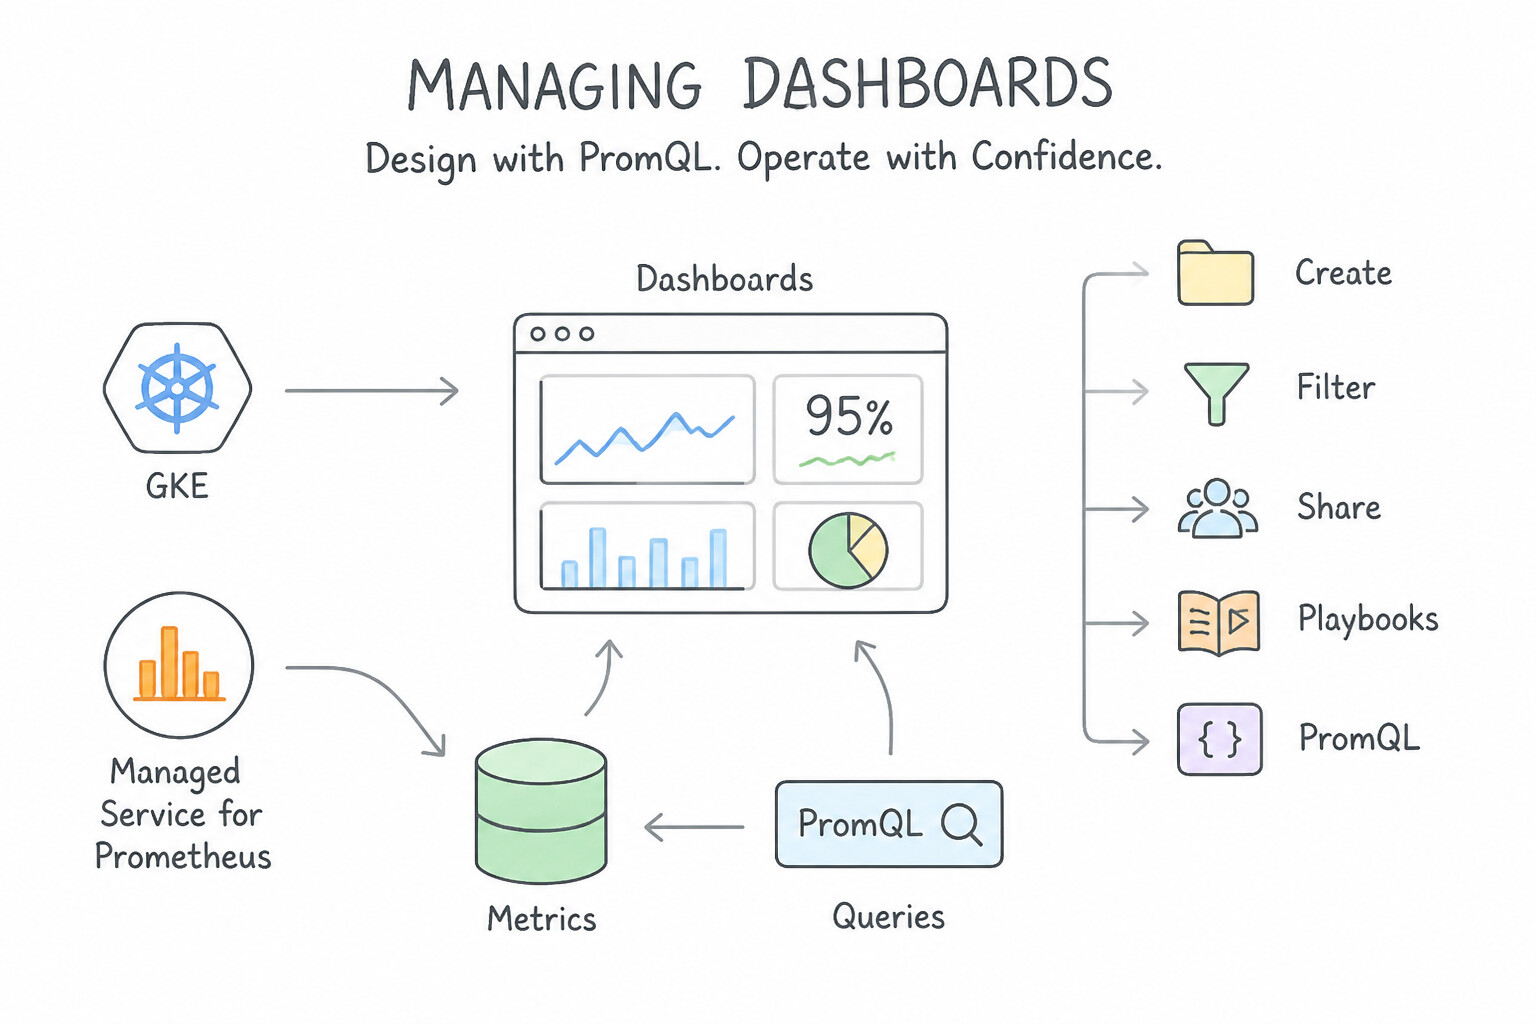
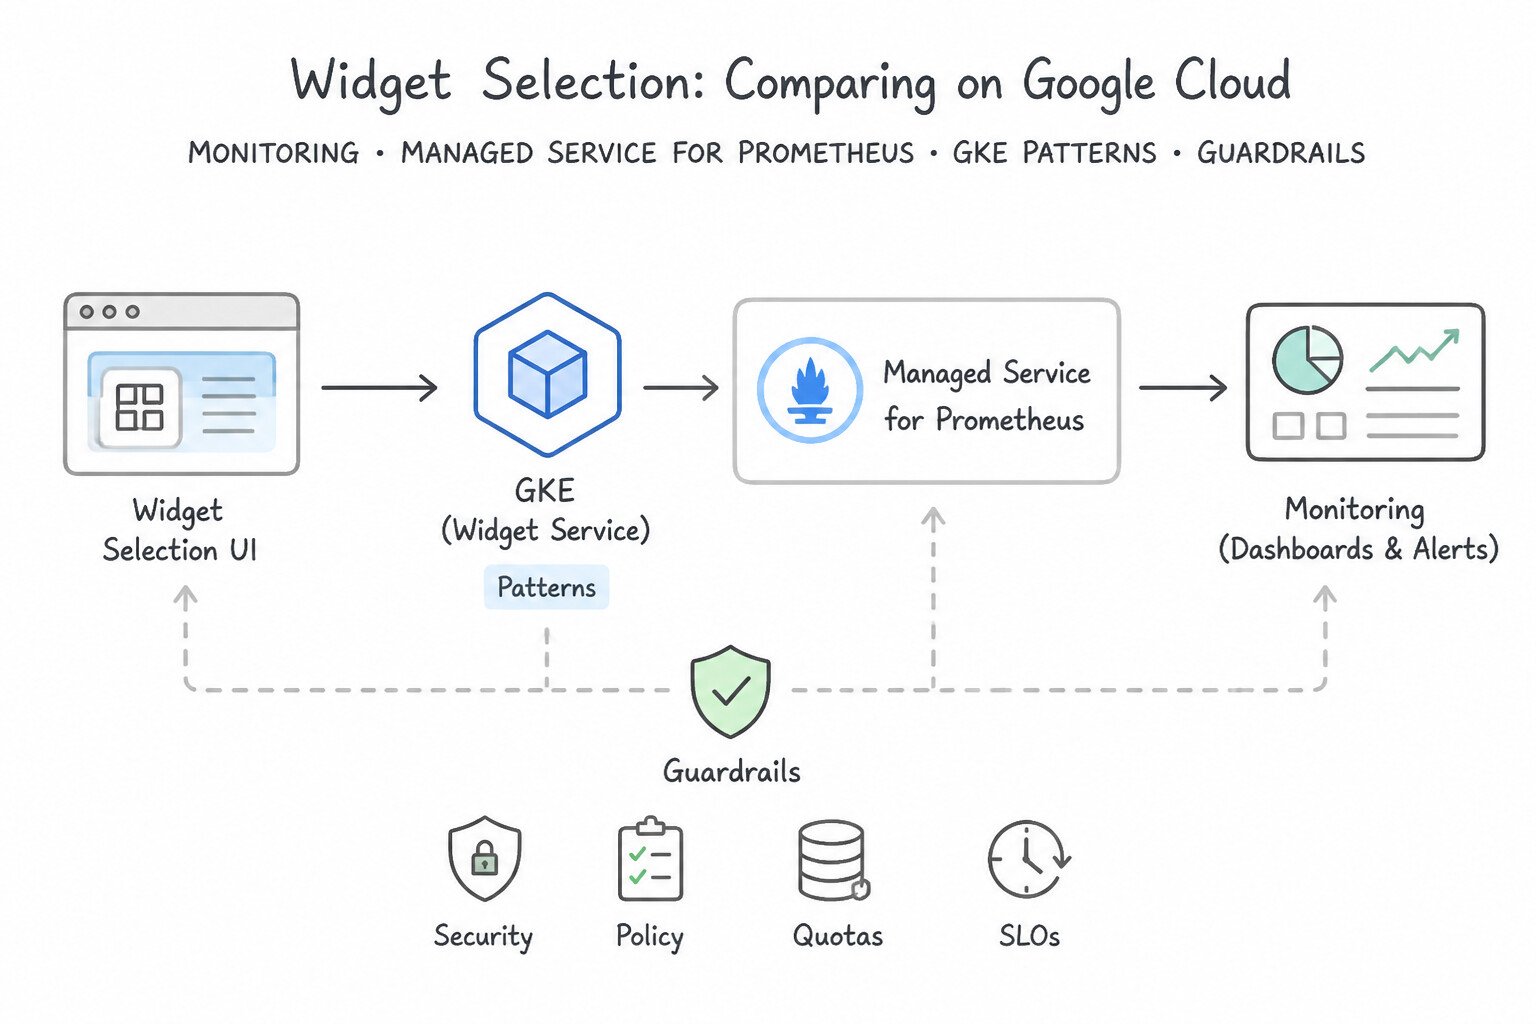
- Designing Production Dashboards & PromQL Queries (4.3b):
- Widget Selection: Use Heatmap widgets to visualize Distribution metrics (exposing bimodal latency distributions and tail outliers at a glance), Stacked Area / Line charts for traffic and error rates, and Scorecards / Gauges for remaining SLO Error Budget percentage.
- PromQL Native Support: Cloud Monitoring natively supports PromQL across both Google Cloud system metrics (
compute_googleapis_com:instance_cpu_utilization) and custom Prometheus metrics ingested via GMP. - Dashboards as Code & Sharing: Export and version dashboards as JSON definitions managed via Terraform (
google_monitoring_dashboard) or the Cloud Monitoring API (gcloud monitoring dashboards create) so dashboard changes follow GitOps across environments, and attach Playbook links / Markdown instructions directly to dashboard text cards and alert policies.
Key Implementation Patterns
- Migrating Prometheus Dashboards to Google Cloud: Use Create widgets in Cloud Monitoring dashboards and use the PromQL option to paste your existing queries. Cloud Monitoring natively supports PromQL, allowing you to reuse existing queries directly in the dashboard widgets.
- Granting Read-Only Dashboard Access: Use Assign the Monitoring Viewer (roles/monitoring.viewer) role to the business analyst. The Monitoring Viewer role grants read-only access to both dashboards and metric data, preventing modifications. (Avoid alternative: The basic Viewer role grants read access to all project resources, which is too broad and violates least privilege.)
- Dynamic Dashboard Filtering: Use Add a dashboard filter for the zone and instance_id labels to the dashboard toolbar. Dashboard filters allow dynamic data slicing across all widgets via the toolbar without editing the dashboard. (Avoid alternative: Creating hundreds of separate dashboards is inefficient and difficult to maintain.)
Key Takeaways (4.3b)
- Cloud Monitoring natively supports PromQL for querying and dashboarding.
- Migrating from Prometheus to Google Cloud Managed Service for Prometheus does not require rewriting queries to MQL.
- Managed services reduce operational overhead by removing the need to host tools like Grafana.
- Monitoring Viewer is the correct role for users who need to view dashboards and the data within them without editing rights.
Consideration 4.3c: Configuring alerting and alerting policies (e.g., SLIs, SLOs, cost control)
- High-Signal Alerting Policies (
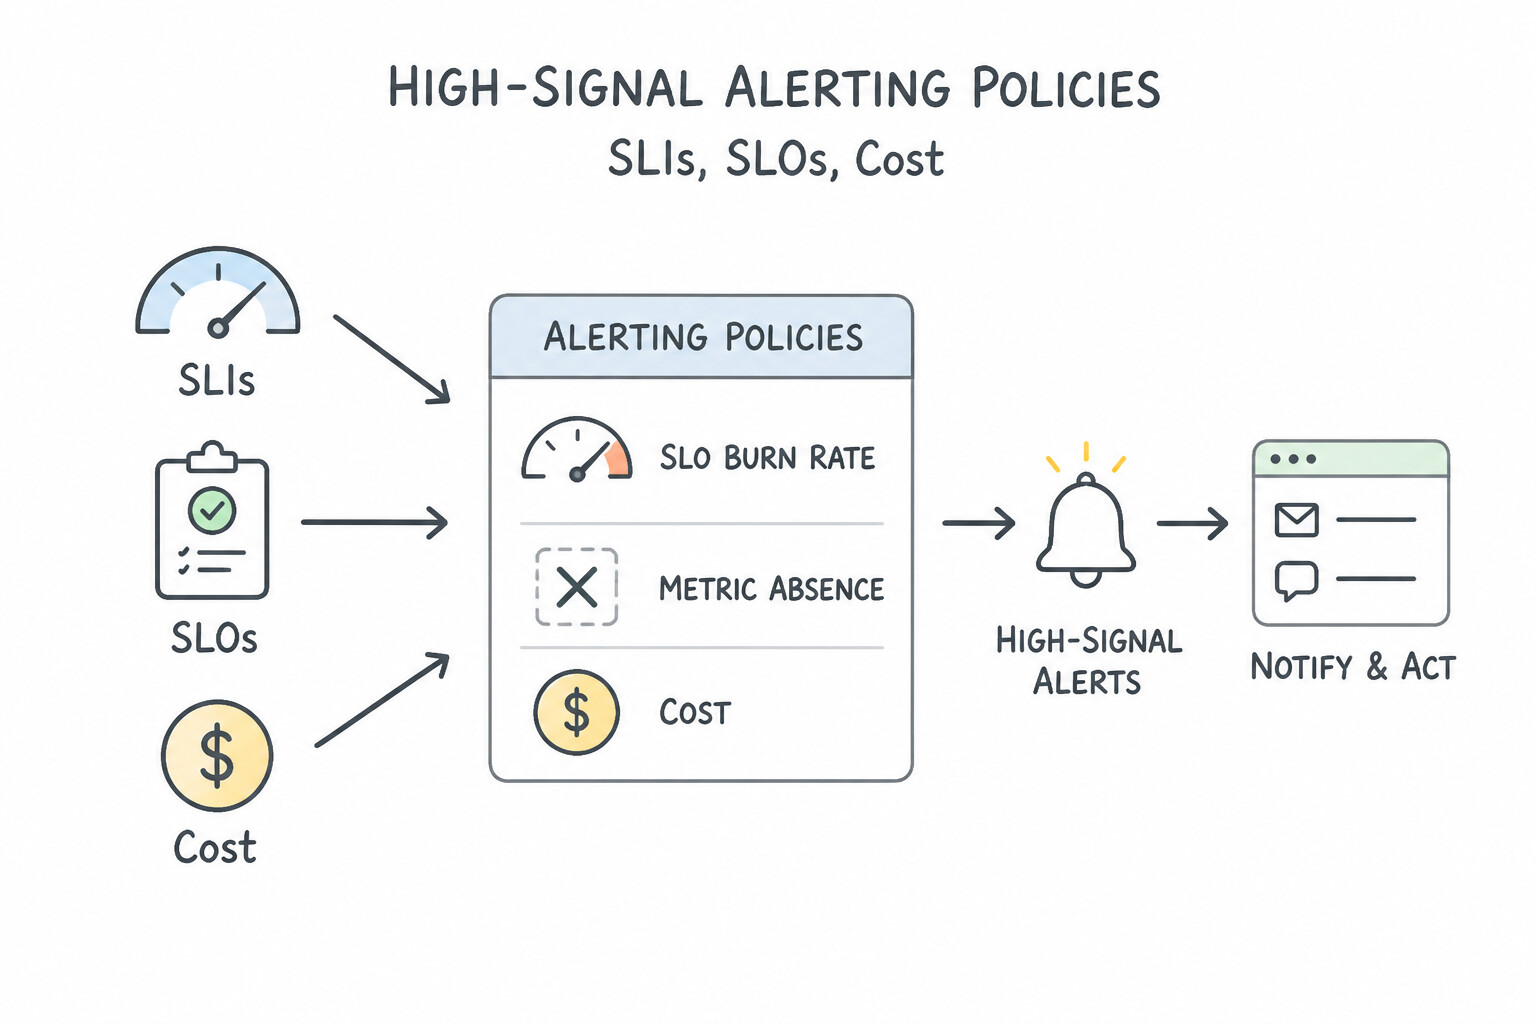
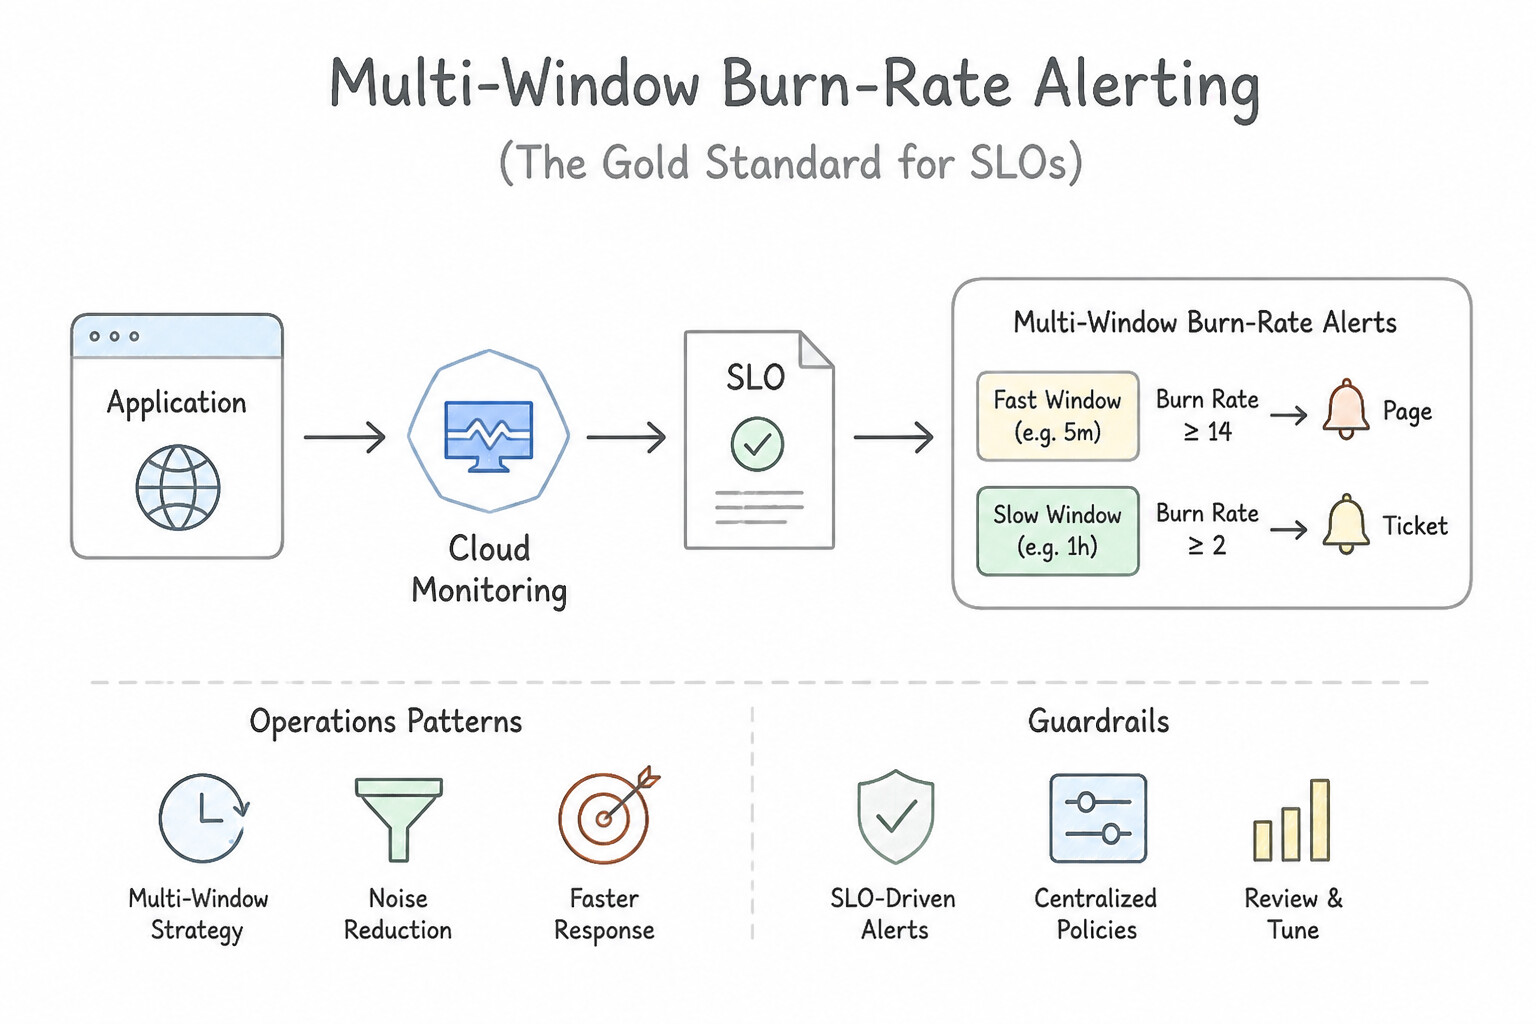
SLO Burn Rate,Metric Absence,Cost Control—4.3c): - Multi-Window Burn-Rate Alerting (The Gold Standard for SLOs):
- Instead of alerting on raw error spikes, configure Burn-Rate Alerts on your Service Monitoring SLO. A burn rate of
1.0means the service will consume exactly 100% of its error budget at the end of the 30-day window. - Configure a Two-Tier Alert Strategy:
- Fast-Burn Alert (Page On-Call): Short lookback window (e.g.,
1 hour) with a high burn-rate threshold (e.g.,burn rate > 10xor14.4x). Catches severe outages within minutes while ignoring brief 10-second blips. - Slow-Burn Alert (Ticket / Daytime Notification): Longer lookback window (e.g.,
24 hoursor3 days) with a low burn-rate threshold (e.g.,burn rate > 1.5xor2x). Catches subtle regressions that would otherwise exhaust the monthly budget without waking an engineer at 3:00 AM. - Metric Absence (
Metric absencecondition) & Uptime Alerts: Always configure a Metric Absence condition (or synthetic uptime alert) for critical heartbeats—because a threshold alert (error_rate > 5%) will never fire if the server crashes completely and stops emitting metrics (0 / 0)! - Alerting for Cost Control: Set Cloud Monitoring alerts on Cloud Logging byte ingestion rates, BigQuery slot/bytes scanned metrics, and Compute Engine quota utilization alongside Cloud Billing Budgets (with Pub/Sub programmatic notifications).
Key Implementation Patterns
- Multi-Window Burn Rate Alerts: Use Create an alerting policy that triggers only when the burn rate is high in both a short duration window and a long duration window. Checking both short and long windows balances speed of detection with the prevention of false positives.
- Metric Exclusion for Cost Control: Use Configure a processor in the Ops Agent to drop the specific high-cardinality metrics. Filtering metrics at the agent level prevents them from being ingested and billed. (Avoid alternative: Uninstalling the agent removes all visibility, violating the requirement to keep essential metrics.)
Key Takeaways (4.3c)
- SLOs define the target reliability; Error Budgets define the allowed unreliability.
- Burn Rate indicates how fast the error budget is being consumed relative to the compliance period.
- Single-window alerts force a compromise between reaction time and noise.
- Multi-window alerts allow you to alert on rapid budget consumption (short window) only when it is part of a sustained trend (long window).
Consideration 4.3d: Integrating with third-party alerting tools (e.g., webhooks, PagerDuty, Rootly)
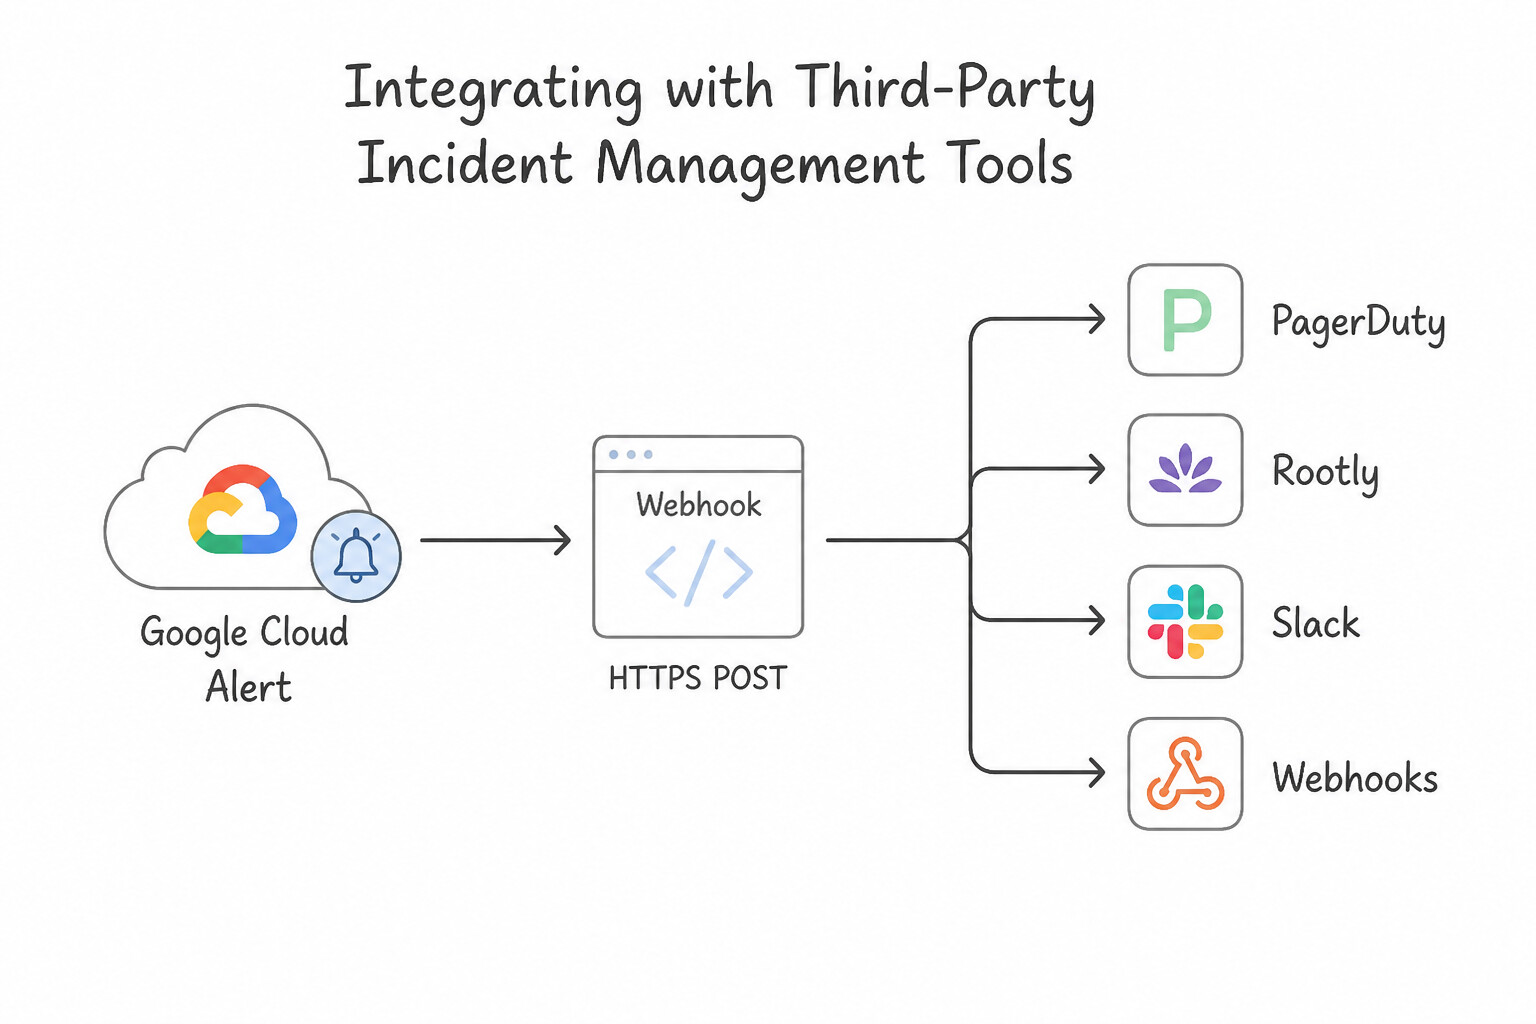
- Integrating with Third-Party Incident Management Tools (
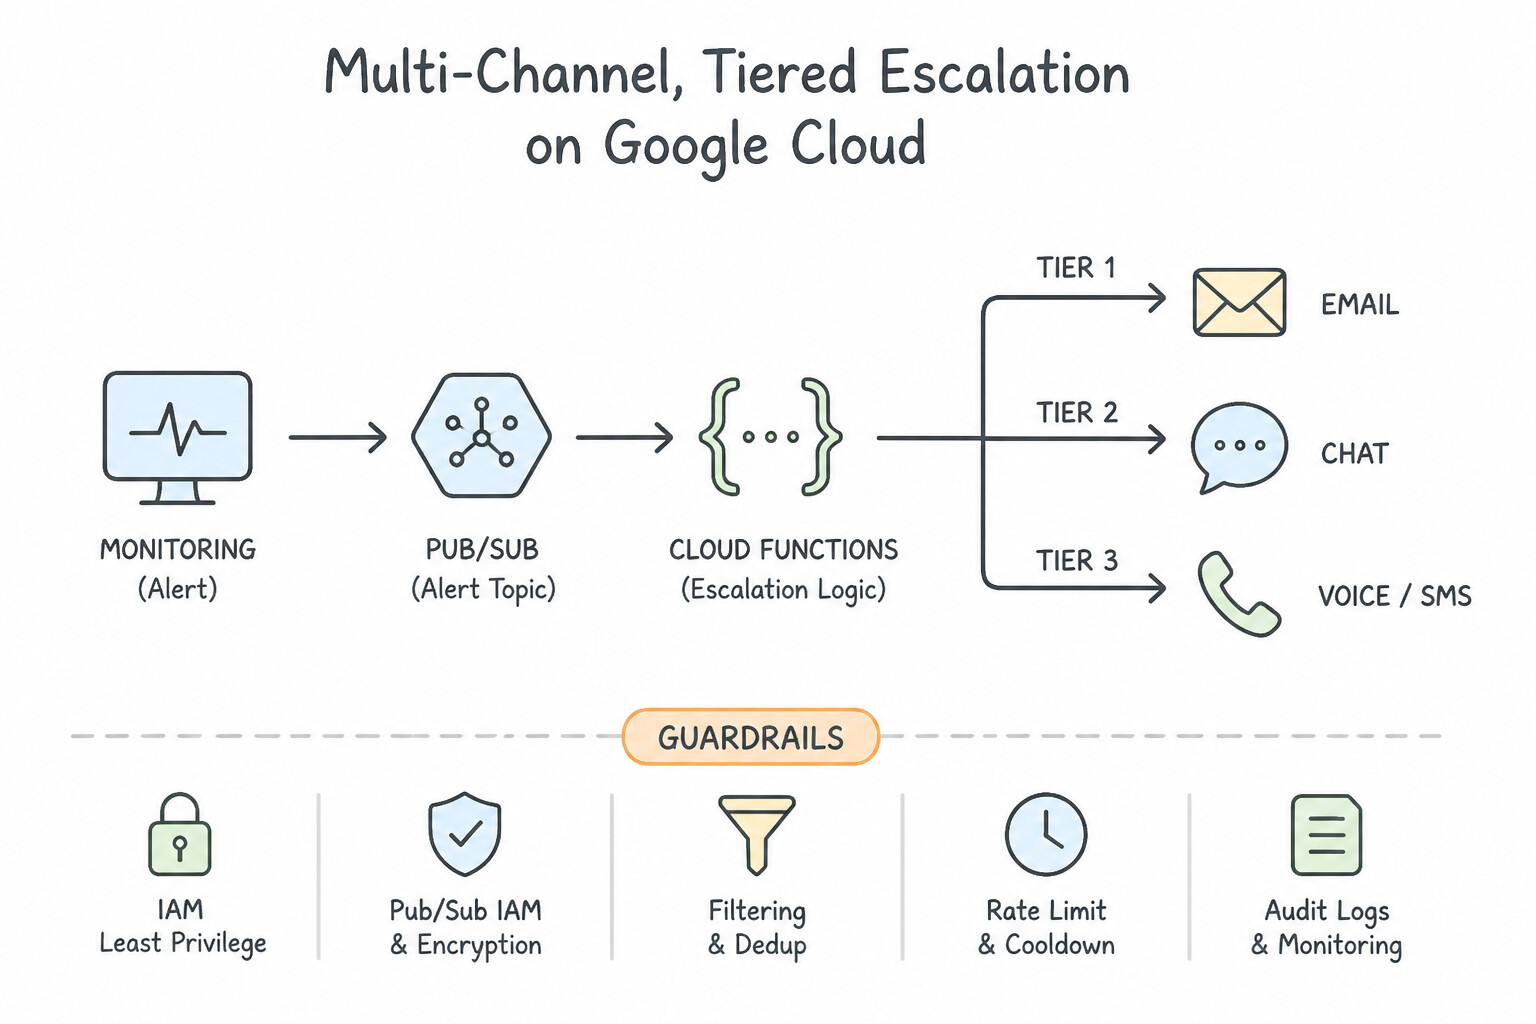
PagerDuty,Rootly,Slack,Webhooks,Pub/Sub—4.3d): - Multi-Channel & Tiered Escalation: Never rely on a single email or SMS notification channel for P0 production alerts. Integrate Cloud Monitoring Notification Channels directly with an incident management platform (PagerDuty, Rootly, Opsgenie) configured with multi-tier escalation policies (if Primary On-Call does not ACK within 5 minutes → page Secondary On-Call → page Engineering Manager).
- Pub/Sub & Webhook Notification Channels: Use a Pub/Sub Notification Channel (or authenticated Webhook) when you need to trigger automated self-healing runbooks (via Cloud Run functions / Cloud Workflows) or transform alert JSON payloads for custom enterprise ticketing systems.
- Actionable Alert Documentation Templates: Populate the
documentation.contentfield in every Alerting Policy using Markdown and dynamic variable substitutions (${resource.label.instance_id},${metric.label.response_code},${policy.name}) plus a direct clickable link to the service runbook and dashboard.
Key Implementation Patterns
- Custom Webhook Payload Transformation: Use Set up a Pub/Sub notification channel. Create a Cloud Function triggered by the topic to convert the JSON payload to XML and forward it to the legacy system. Use a Cloud Function as middleware to transform the JSON payload from Cloud Monitoring into the XML format required by the legacy system.
- Alerting to Private On-Premises Systems: Use Create a Pub/Sub notification channel. Run a subscriber application on-premises that pulls messages from the Pub/Sub subscription. Pub/Sub allows the on-premises system to pull alerts securely without requiring public ingress.
- Securing Webhook Notifications: Use Select the "Use Basic Auth" option in the channel configuration and enter the credentials. Cloud Monitoring Webhook configuration has a built-in feature to securely handle Basic Authentication credentials. (Avoid alternative: Embedding credentials in the URL is insecure and exposes sensitive data in logs.)
Key Takeaways (4.3d)
- Cloud Monitoring alerts are sent as fixed JSON payloads.
- Use Cloud Pub/Sub and Cloud Functions to build lightweight middleware for payload transformation.
- Avoid polling mechanisms (like Cloud Storage) for real-time alerting needs.
- Direct webhooks work well only if the destination accepts the standard Cloud Monitoring JSON format.
Consideration 4.3e: Leveraging Gemini Cloud Assist for metrics interpretation
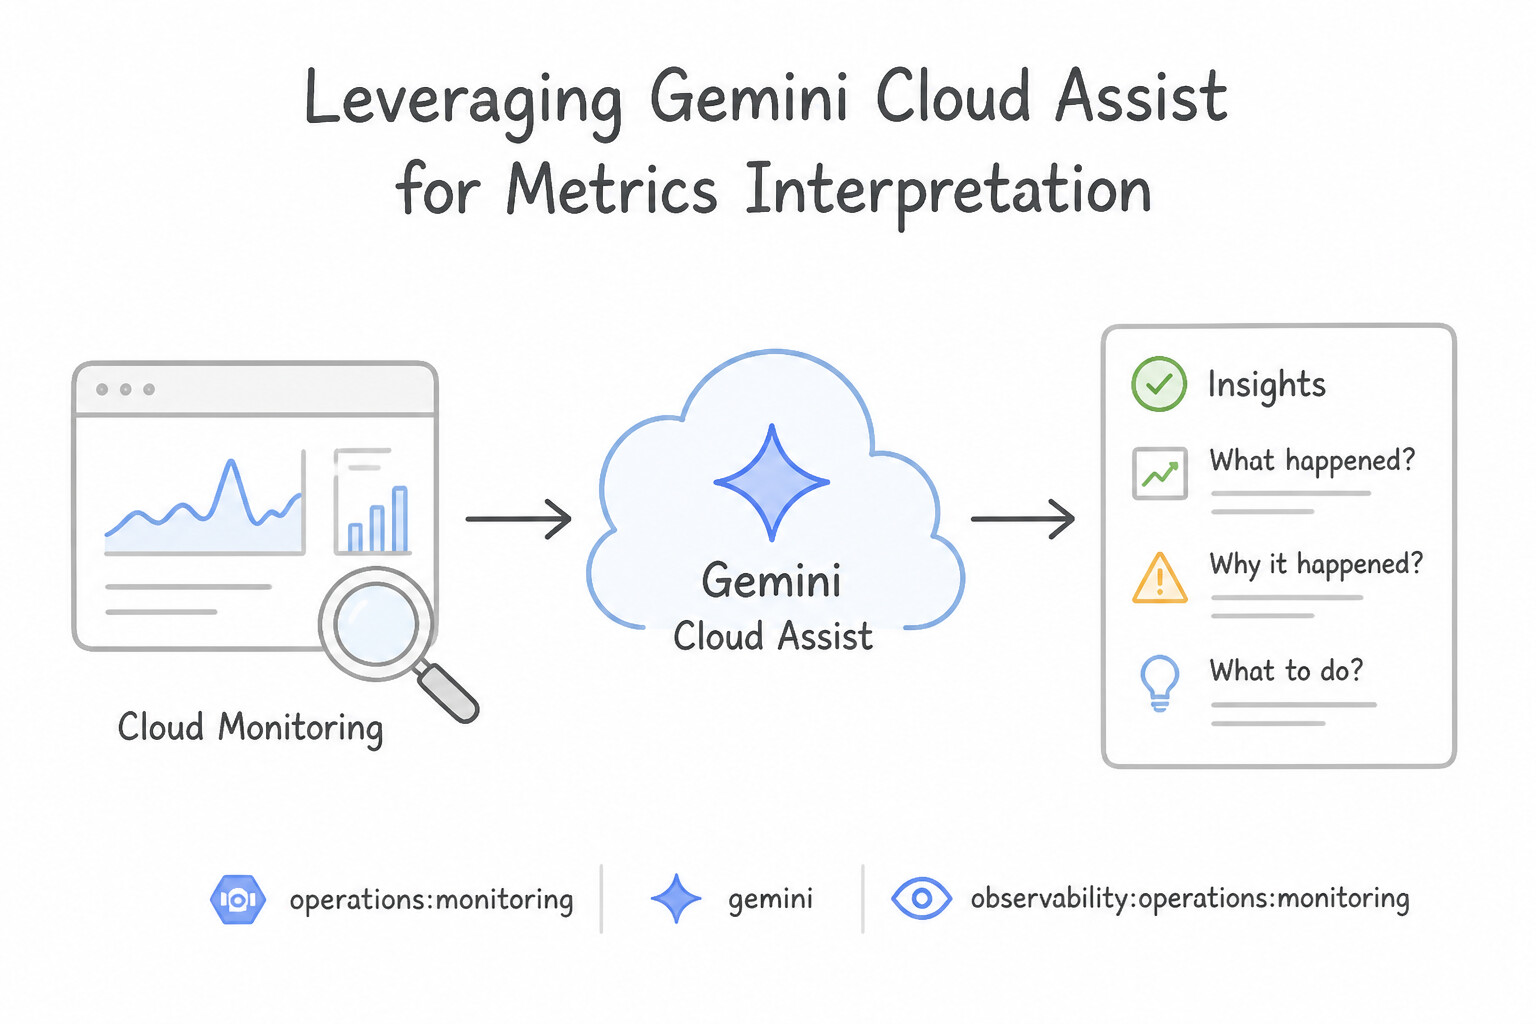
- Leveraging Gemini Cloud Assist for Metrics Interpretation (4.3e):
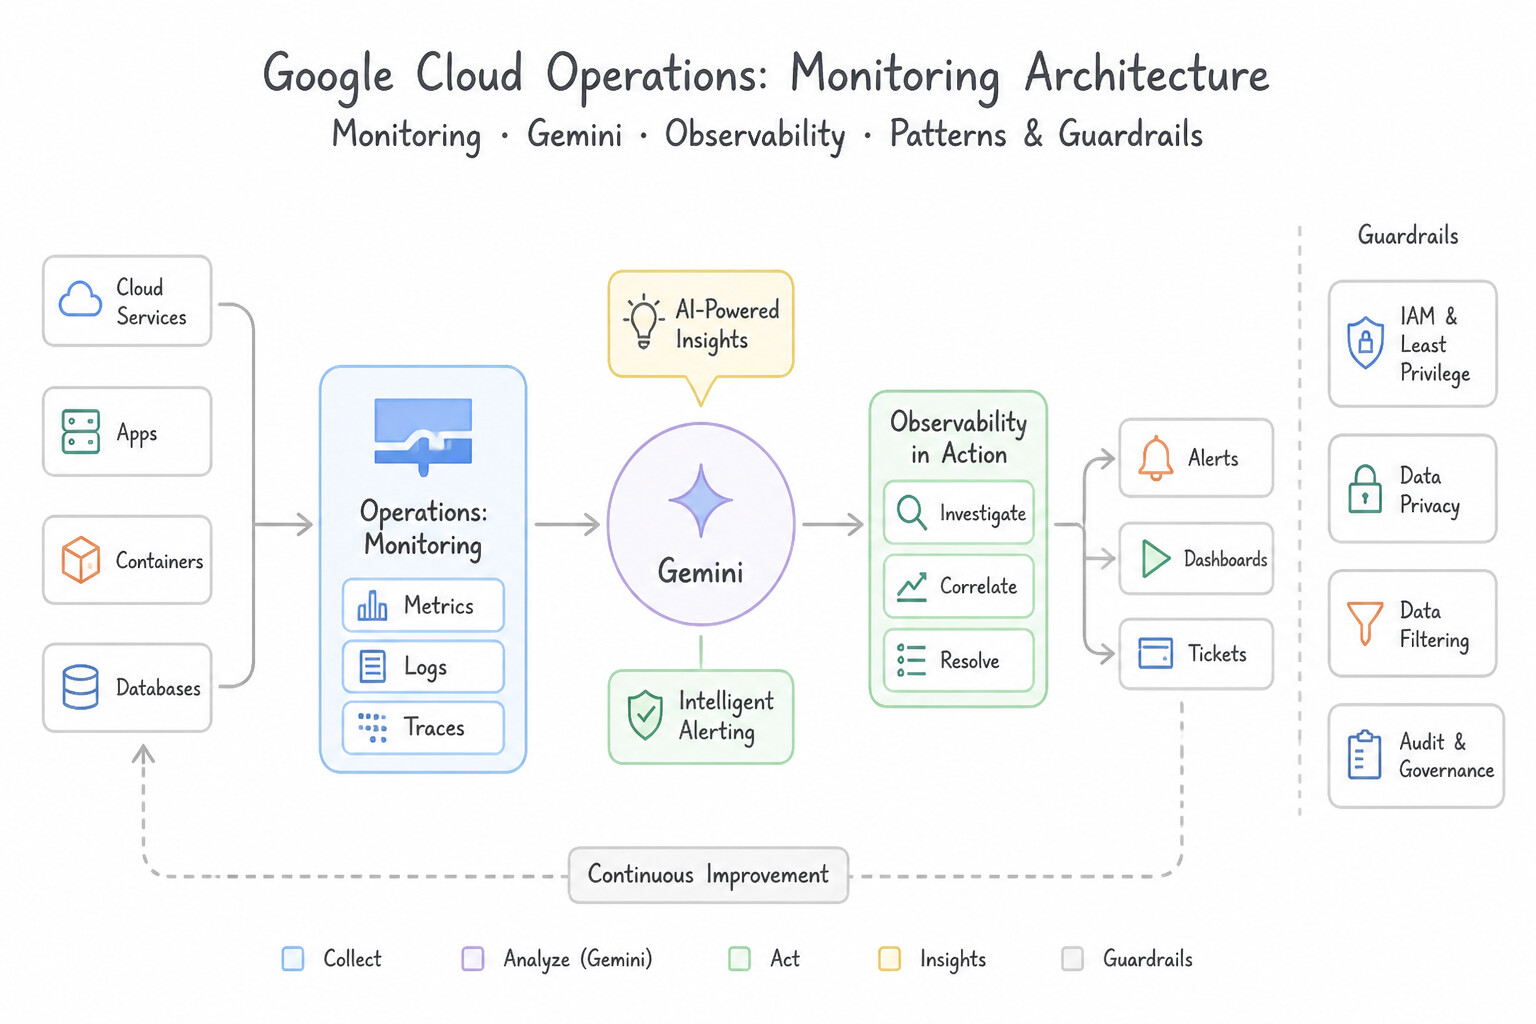
- Use Gemini Cloud Assist in Metrics Explorer and Dashboards to translate natural-language questions ("Show p99 latency by region for the checkout service over the last 6 hours") into valid PromQL queries, explain unexpected metric spikes, and correlate anomalous time-series charts with concurrent Cloud Deploy rollouts or Cloud Logging error surges.
Key Implementation Patterns
- Generating MQL Queries from Natural Language: Use In Metrics Explorer, select the MQL tab. Use the Gemini query generation feature to input your request in natural language and apply the resulting code. Gemini in Cloud Monitoring allows you to generate valid MQL code from natural language prompts directly within the MQL editor.
- Explaining Sudden Metric Spikes: Use Select the "Explain this chart" option provided by Gemini in the Cloud Monitoring dashboard to analyze the spike. Gemini features in Cloud Monitoring can automatically analyze charts to suggest reasons for anomalies. (Avoid alternative: BigQuery is for complex, long-term analysis, not for immediate troubleshooting of a single dashboard spike.)
- Summarizing High-Volume Error Logs: Use Select a relevant log entry and click 'Explain this log entry' to get a natural language summary. Gemini in Cloud Logging can interpret complex log entries and provide instant summaries and remediation steps. (Avoid alternative: Exporting to Cloud Storage is for retention, not immediate real-time troubleshooting.)
Key Takeaways (4.3e)
- MQL provides advanced querying capabilities for Cloud Monitoring beyond the visual builder.
- Gemini in Cloud Monitoring can generate syntactically correct MQL from natural language prompts.
- Using AI assistance is the most efficient way for novices to leverage advanced monitoring features without deep syntax knowledge.
- Gemini for Google Cloud is integrated into Cloud Monitoring to help interpret metric data.
Quick Decision Cheat Sheet (Subsection 4.3)
If the Scenario Requires... | Choose This Google Cloud Pattern | Avoid This Common Mistake |
|---|---|---|
"Convert a cumulative counter metric (total HTTP requests since start) into requests-per-second on a chart" | Set the Aligner to ALIGN_RATE | Using ALIGN_SUM or ALIGN_MEAN on a raw cumulative counter |
"Balance fast outage detection with low false-positive alert fatigue for a 99.9% SLO service" | Configure SLO Error Budget Burn-Rate Alerting (Fast-burn window → Page; Slow-burn window → Ticket) | Alerting on 1-minute CPU spikes or raw single-error log lines |
"Central Grafana instance needs to query Cloud Monitoring metrics across multiple GCP projects with least privilege" | Create a dedicated Service Account (authenticated via Workload Identity if on GKE) and grant roles/monitoring.viewer on the Scoping/Monitored projects | Granting roles/editor or exporting static Owner JSON keys to Grafana |
"Reduce MTTR when an alert wakes up a new on-call engineer who didn't write the microservice" | Embed a Runbook / Playbook URL and dynamic ${resource.label.*} variables inside the Alerting Policy's Documentation block | Putting troubleshooting notes in an unlinked private Google Doc |
"Trigger an automated remediation Cloud Run function whenever a specific Cloud Monitoring alert fires" | Configure a Cloud Pub/Sub Notification Channel on the alerting policy to trigger the Cloud Run function | Scraping the Cloud Monitoring UI with a Selenium bot |
Further Reading (Subsection 4.3)
- Alignment and aggregation — A comprehensive guide on how Cloud Monitoring aligns and aggregates time series data, explaining concepts like alignment period and aligners.
- Introduction to the Cloud Monitoring API — Explains how distribution metrics capture a set of values in histogram buckets rather than a single scalar value.
- About distribution-valued metrics — Documentation on using Heatmaps in Cloud Monitoring to visualize distribution-valued metrics.
- Monitoring Query Language (MQL) examples — Provides specific examples of how to calculate ratios, including the exact syntax for joining and dividing metric streams.
- Cloud Monitoring: PromQL in Cloud Monitoring — Documentation explaining how to use PromQL in Cloud Monitoring dashboards and Metrics Explorer.
- Access control for Monitoring — Provides a comprehensive list of predefined IAM roles for Cloud Monitoring, detailing the specific permissions included in roles like Monitoring Viewer and Monitoring Dashboard Viewer.
Subsection 4.4: Capturing and analyzing distributed traces
The Big Picture
When a monolithic application becomes slow, you attach a profiler to one process. When a 20-microservice architecture on GKE and Cloud Run becomes slow—say, a user's /checkout request takes $3.4\text{ seconds}instead of @@ESCAPEDDOLLAR@@200 ms—individual service logs are useless unless linked together across network hops:
- Broken Trace Context Propagation (4.4a): If Service A calls Service B over HTTP or gRPC, and Service A's HTTP client does not forward the W3C
traceparent(orX-Cloud-Trace-Context) header, Service B starts a brand-new, disconnectedtrace_id. Instead of seeing one end-to-end waterfall graph in Cloud Trace, you get 20 isolated 1-span fragments! - Misreading Waterfall Graphs (
Sequential N+1vs.Parallel Fan-Outvs.Client-Side Delay—4.4b): In a Cloud Trace waterfall chart, a staircase of 40 tiny 20ms database spans executing one after another reveals a sequentialN+1query bug (fixable via batching orasyncio.gather/ parallel RPCs), whereas a large gap inside a parent span before any child span starts indicates local CPU serialization, thread-pool starvation, or GC pauses inside the parent service. - Siloed Traces and Logs (
4.4c,4.4d): Seeing a red500span in Cloud Trace tells you where and how long a call failed, but not the exact exception message—unless your structured JSON logs include thelogging.googleapis.com/traceandlogging.googleapis.com/spanIdfields so Cloud Trace and Logs Explorer link together with a single click (and can be synthesized automatically by Gemini Cloud Assist).
Consideration 4.4a: Utilizing tracing frameworks (e.g., OpenTelemetry)
- Utilizing OpenTelemetry (
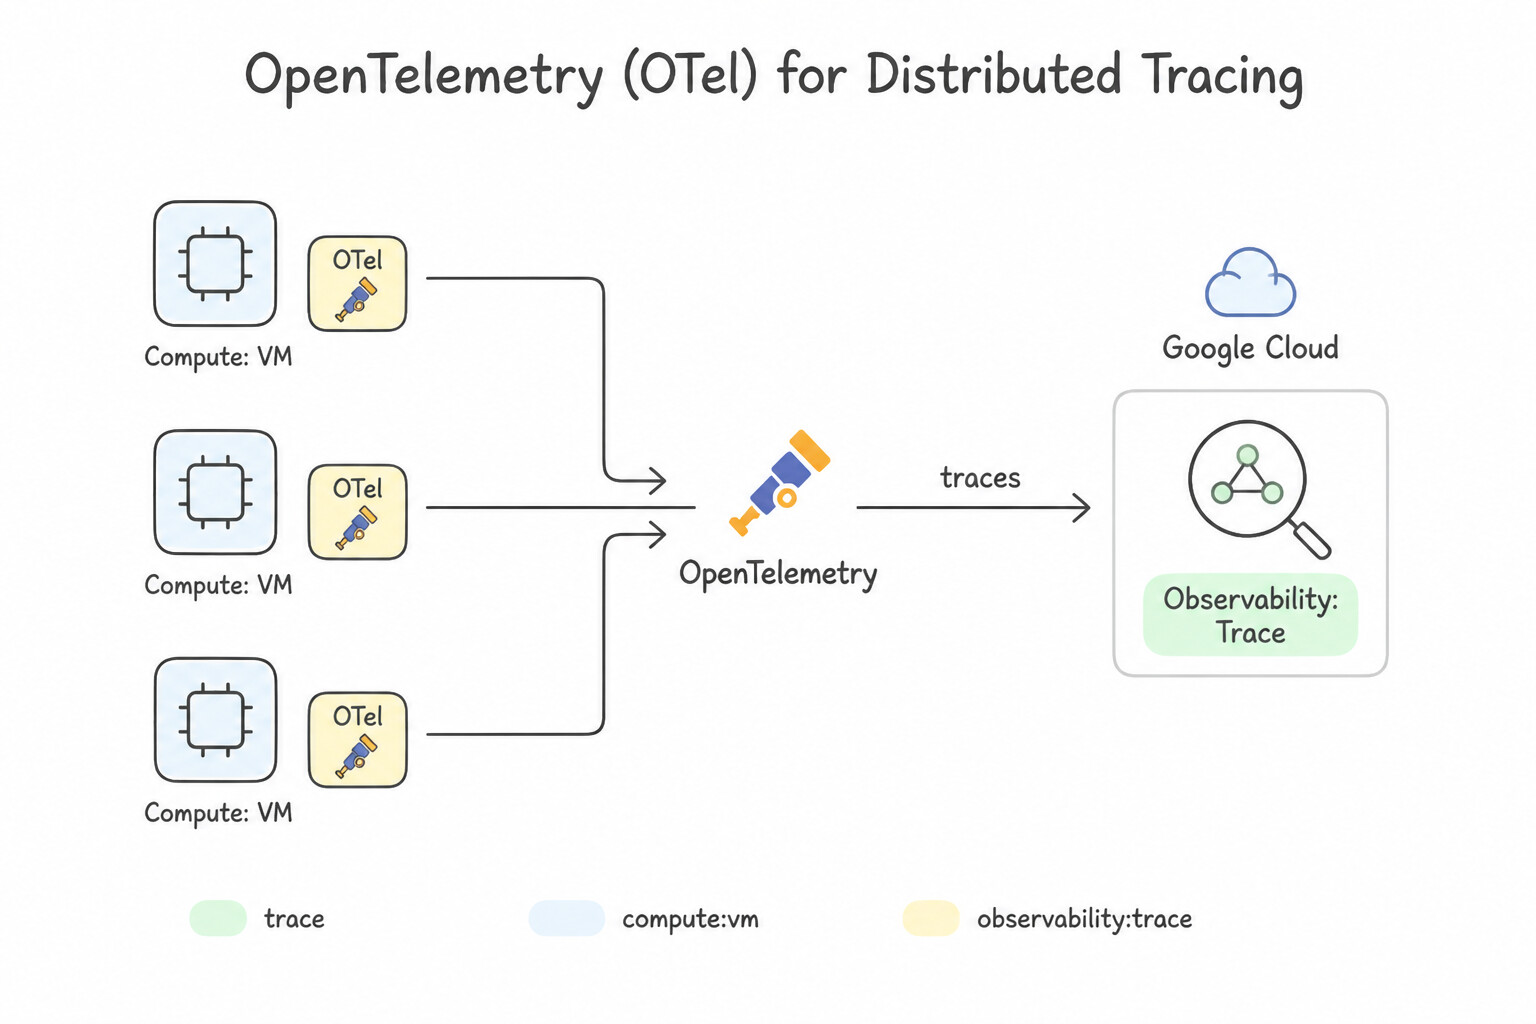
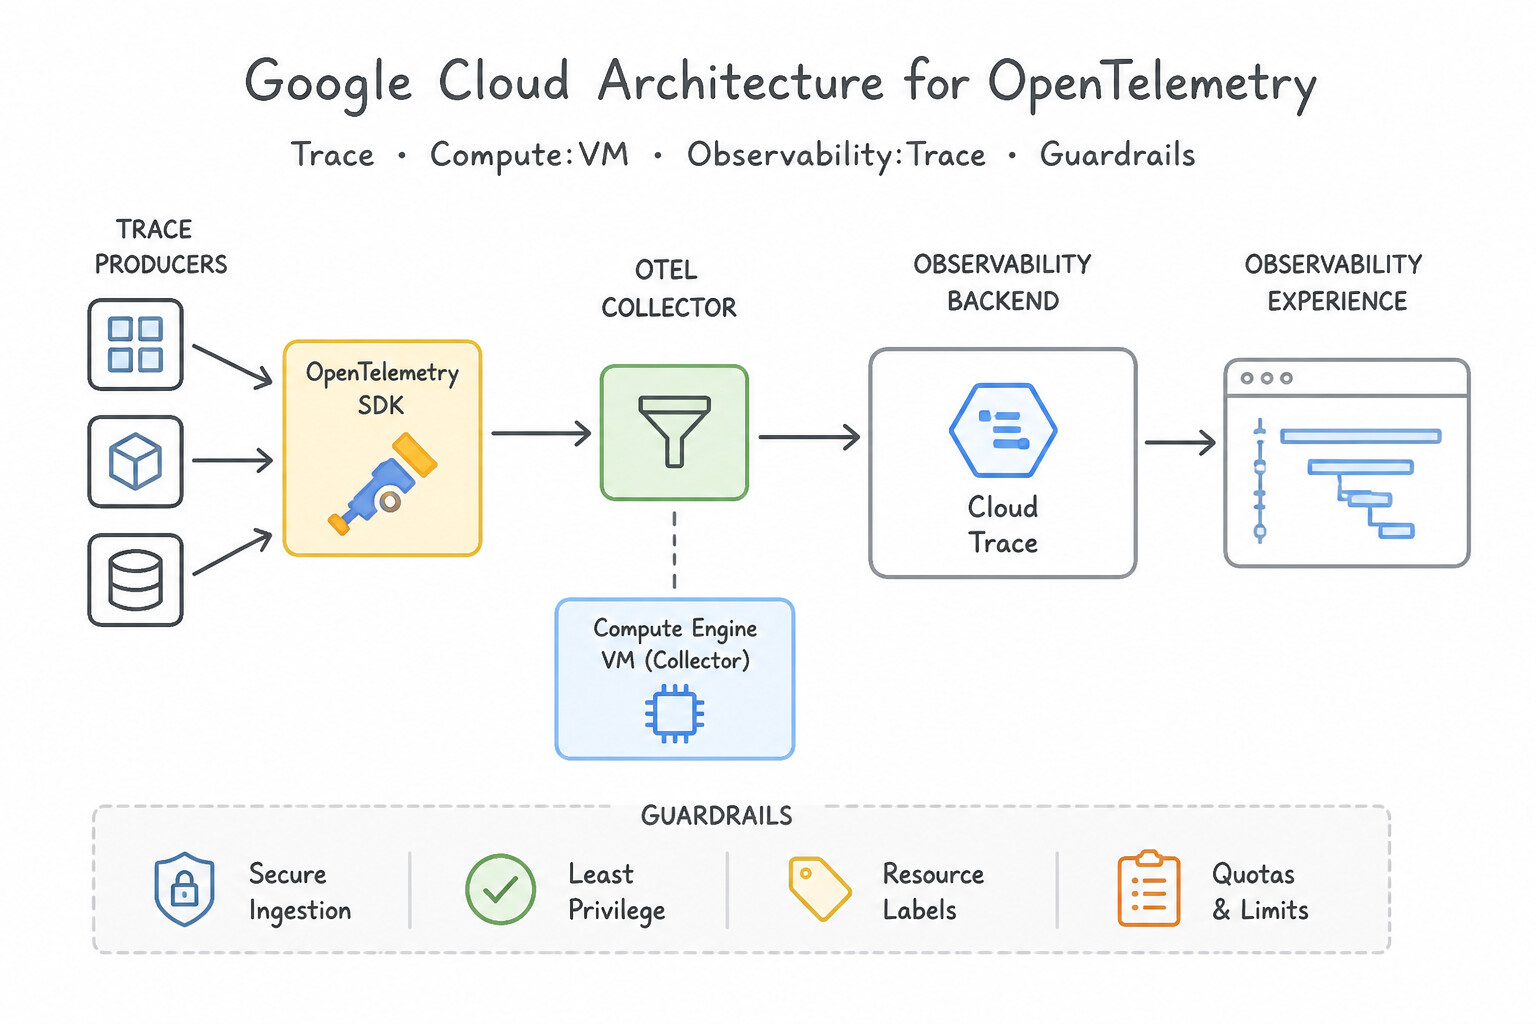
OTel) for Distributed Tracing (4.4a): - OpenTelemetry is the Google-Recommended Standard: Legacy OpenCensus and OpenTracing libraries are deprecated/archived. Instrument Go, Java, Python, Node.js, and .NET applications using the OpenTelemetry SDK and export spans via
OTLP(OpenTelemetry Protocol) either directly to the Google Cloud Telemetry API (telemetry.googleapis.com) / Cloud Trace exporter or through an OpenTelemetry Collector DaemonSet/sidecar. - Header Context Propagation (
W3C Trace Context): Configure the OTelTraceContextTextMapPropagatorso every outbound HTTP/gRPC/PubSub request automatically injects thetraceparentheader (00-<32-hex-trace-id>-<16-hex-span-id>-<flags>) and every inbound handler extracts it. (Google Cloud Load Balancers, Cloud Run, and Cloud Service Mesh also support both W3Ctraceparentand legacyX-Cloud-Trace-Context). - Tail-Based vs. Head-Based Sampling: Increase the trace sampling rate during debugging or use an OpenTelemetry Collector with Tail Sampling to capture 100% of traces containing errors (
status == ERROR) or high latency (> 1s) while sampling only 1–5% of normal fast200 OKrequests to keep trace ingestion costs low.
Key Implementation Patterns
- Zero-Code Instrumentation for Legacy Apps: Use Download the OpenTelemetry Java agent JAR. Add the -javaagent flag to the Java startup command. The OpenTelemetry Java agent allows auto-instrumentation at runtime using the -javaagent flag, requiring no source code changes.
- Fixing Broken Context in Microservices: Use Configure the OpenTelemetry SDK in Service A to inject trace context headers into outgoing HTTP requests. Service A must inject trace context headers into HTTP requests so Service B can continue the same trace. (Avoid alternative: VPC Flow Logs monitor network traffic, not application-level distributed traces.)
- Handling High-Volume Trace Ingestion Costs: Use Configure the OpenTelemetry SDK to use a TraceIDRatioBased sampler with a low sampling ratio. A ratio-based sampler reduces ingestion volume by only capturing a percentage of requests, lowering costs while maintaining statistical data.
Key Takeaways (4.4a)
- Auto-instrumentation allows you to collect telemetry without modifying source code.
- Java applications use the
-javaagentflag to attach the OpenTelemetry agent at startup.- This approach is ideal for legacy applications or when development resources are unavailable.
- Distributed tracing provides visibility into application latency that network logs (like VPC Flow Logs) cannot provide.
Consideration 4.4b: Analyzing trace waterfalls and spans
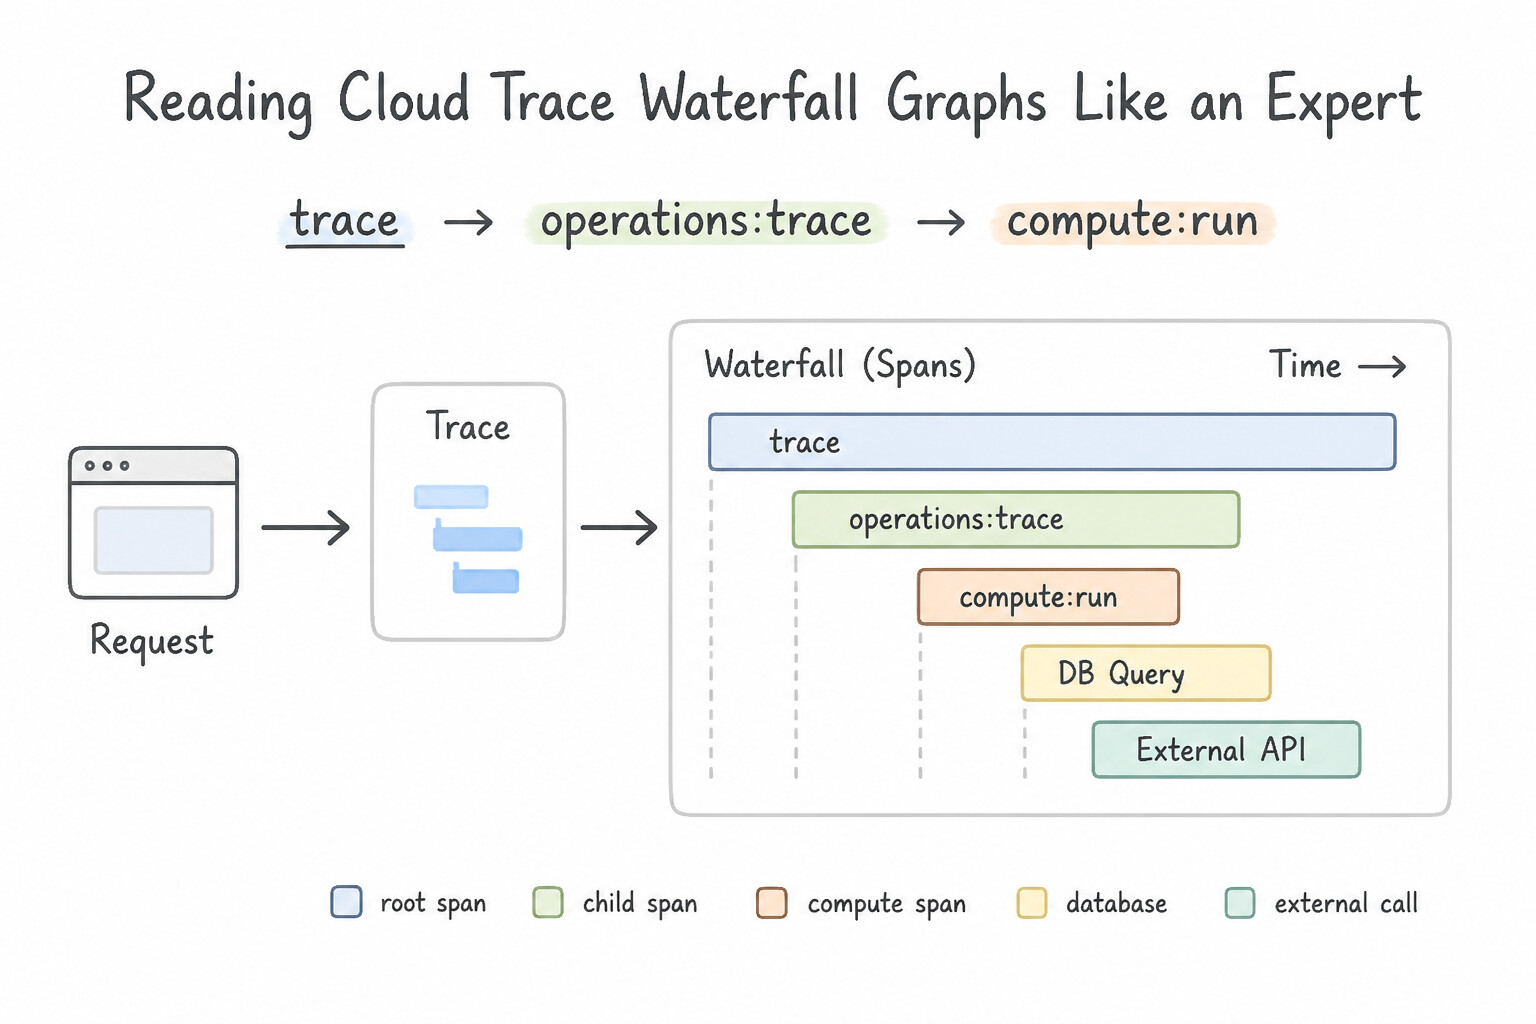
- Reading Cloud Trace Waterfall Graphs Like an Expert (4.4b):
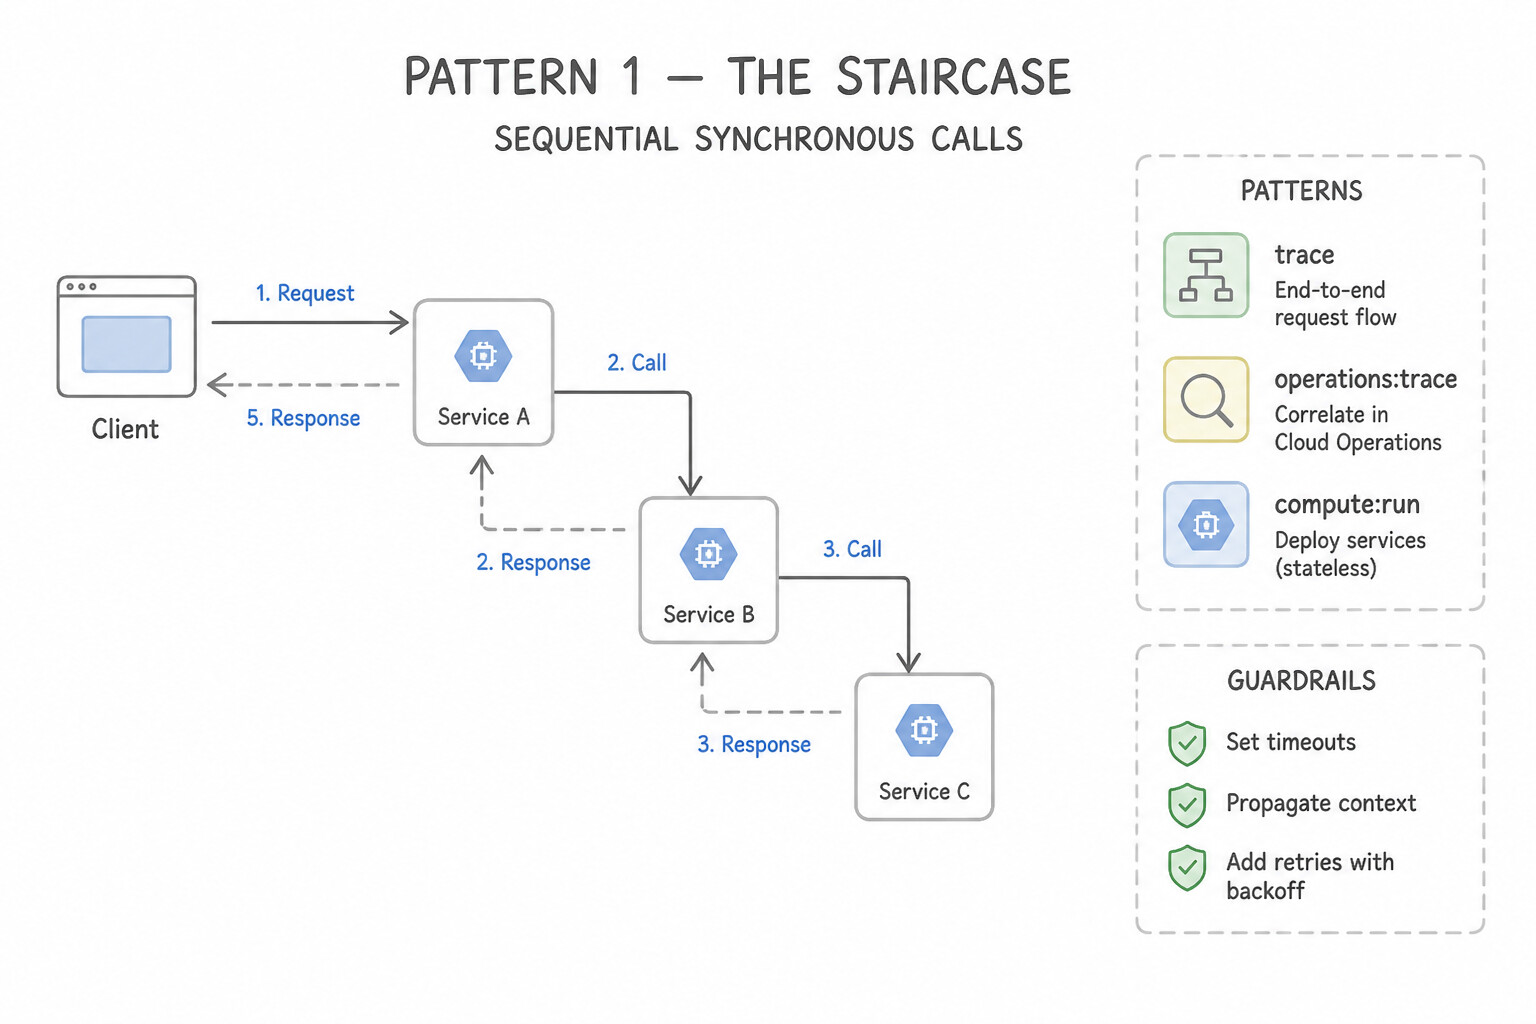
- Pattern 1 — The "Staircase" (Sequential Synchronous Calls): Child spans start one after another (
$t_1→ t_2 → t_3$). Fix: Execute independent downstream RPCs concurrently (e.g.,Promise.all, Go goroutines, Pythonasyncio.gather) or replace$N$ single-row SQL queries with a single batched query. - Pattern 2 — One Long Blocking Child Span: The parent span takes $2,100\text{ ms}, and a single child span @@CODE0@@ takes @@ESCAPEDDOLLAR@@2,050 ms. Fix: The bottleneck is inside that specific downstream service or external third-party API (add caching, timeout/retry budgets, or scale the downstream dependency).
- Pattern 3 — Unattributed Gap in Parent Span: The parent span takes $1,500\text{ ms}, but its child spans only add up to @@ESCAPEDDOLLAR@@100 ms. Fix: The delay is happening inside the parent process itself in uninstrumented code (e.g., heavy JSON serialization, garbage collection pause, thread-pool queueing, or synchronous file I/O)—add finer internal spans or inspect Cloud Profiler!
- Cloud Trace Analysis Reports (
Daily Latency Profile Comparison): Compare the latency percentile distribution histogram of Today (new release) against Last Week (baseline) on the same graph to prove whether a deployment caused a latency regression.
Key Implementation Patterns
- Identifying Sequential Blocking Calls: Use Refactor the CheckoutService code to execute the backend calls in parallel. The staircase pattern indicates sequential blocking calls; parallelizing these calls reduces total latency. (Avoid alternative: Adding CPU resources does not resolve the latency caused by sequential network calls to external services.)
- Analyzing Uninstrumented Local Latency (The 'Gap'): Use Instrument the application code with custom spans to measure local processing. The gap represents uninstrumented local code execution; adding custom spans will make this processing time visible in the trace. (Avoid alternative: Startup latency affects the time before the request starts processing, not a gap inside the active trace span.)
- Diagnosing the N+1 Query Problem: Use Refactor the application code to fetch the data using a single batch query or JOIN. The trace indicates an N+1 query problem; combining queries eliminates unnecessary network round-trips. (Avoid alternative: Adding resources does not fix latency caused by excessive network round-trips.)
Key Takeaways (4.4b)
- Distributed traces visualize the lifecycle of a request across microservices.
- A 'staircase' pattern in a trace waterfall indicates sequential, blocking operations.
- If independent operations are executed sequentially, refactoring them to run in parallel significantly reduces total latency.
- Resource scaling (CPU/RAM) cannot fix latency caused by inefficient orchestration logic.
Consideration 4.4c: Correlating trace IDs with structured logs
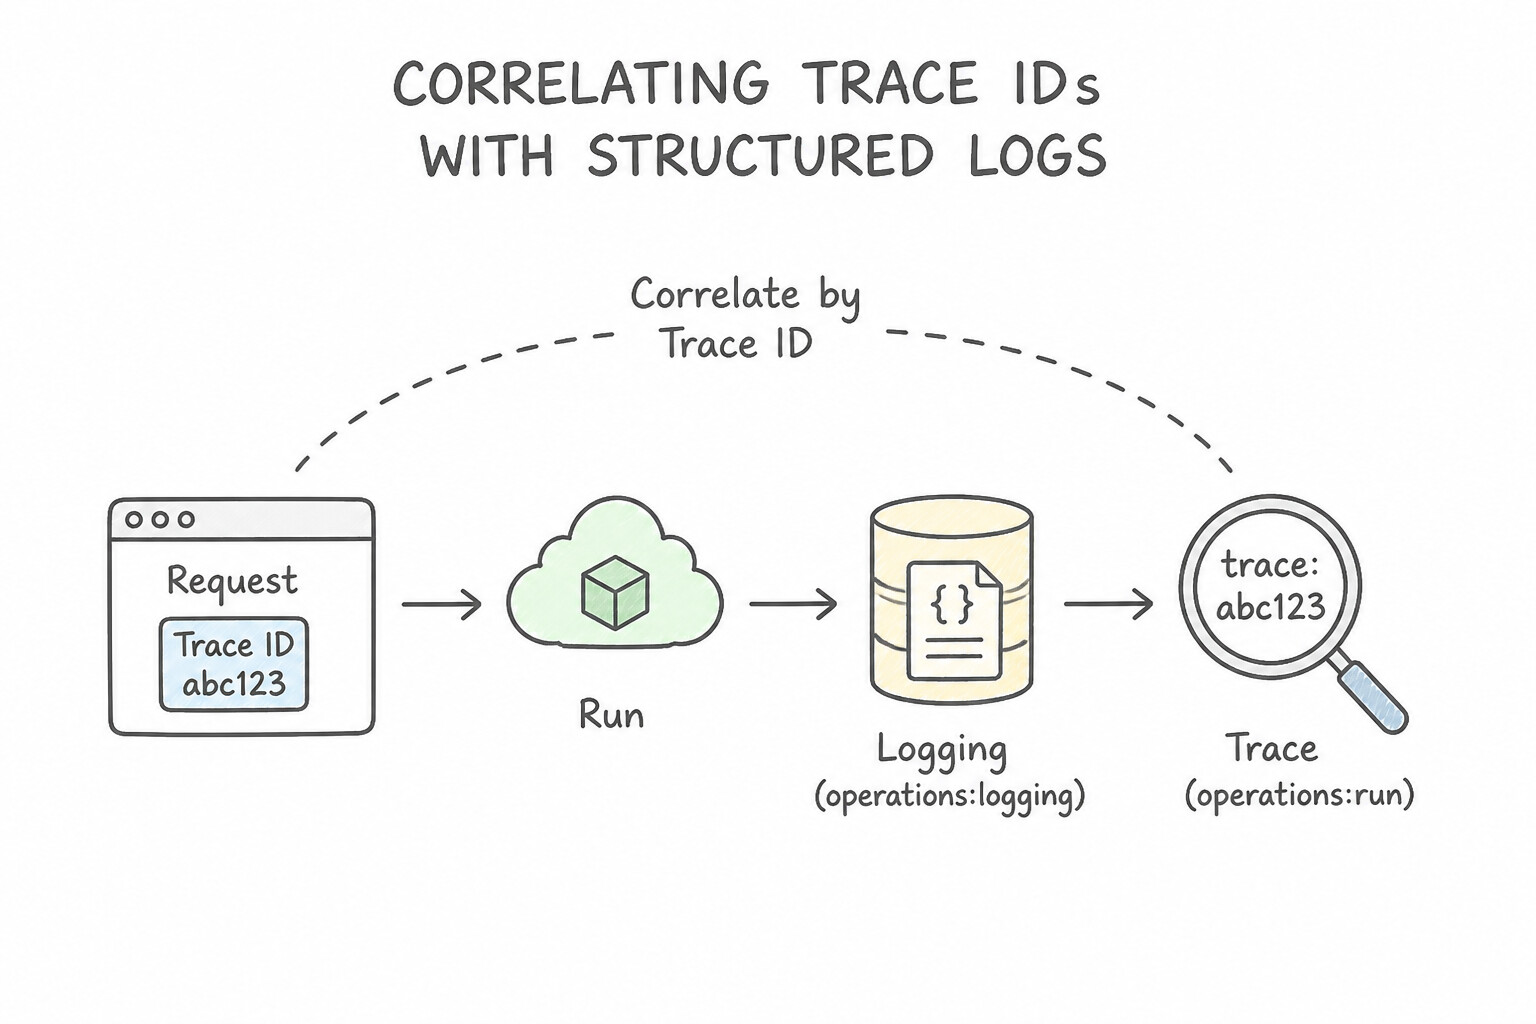
- Correlating Trace IDs with Structured Logs (4.4c):
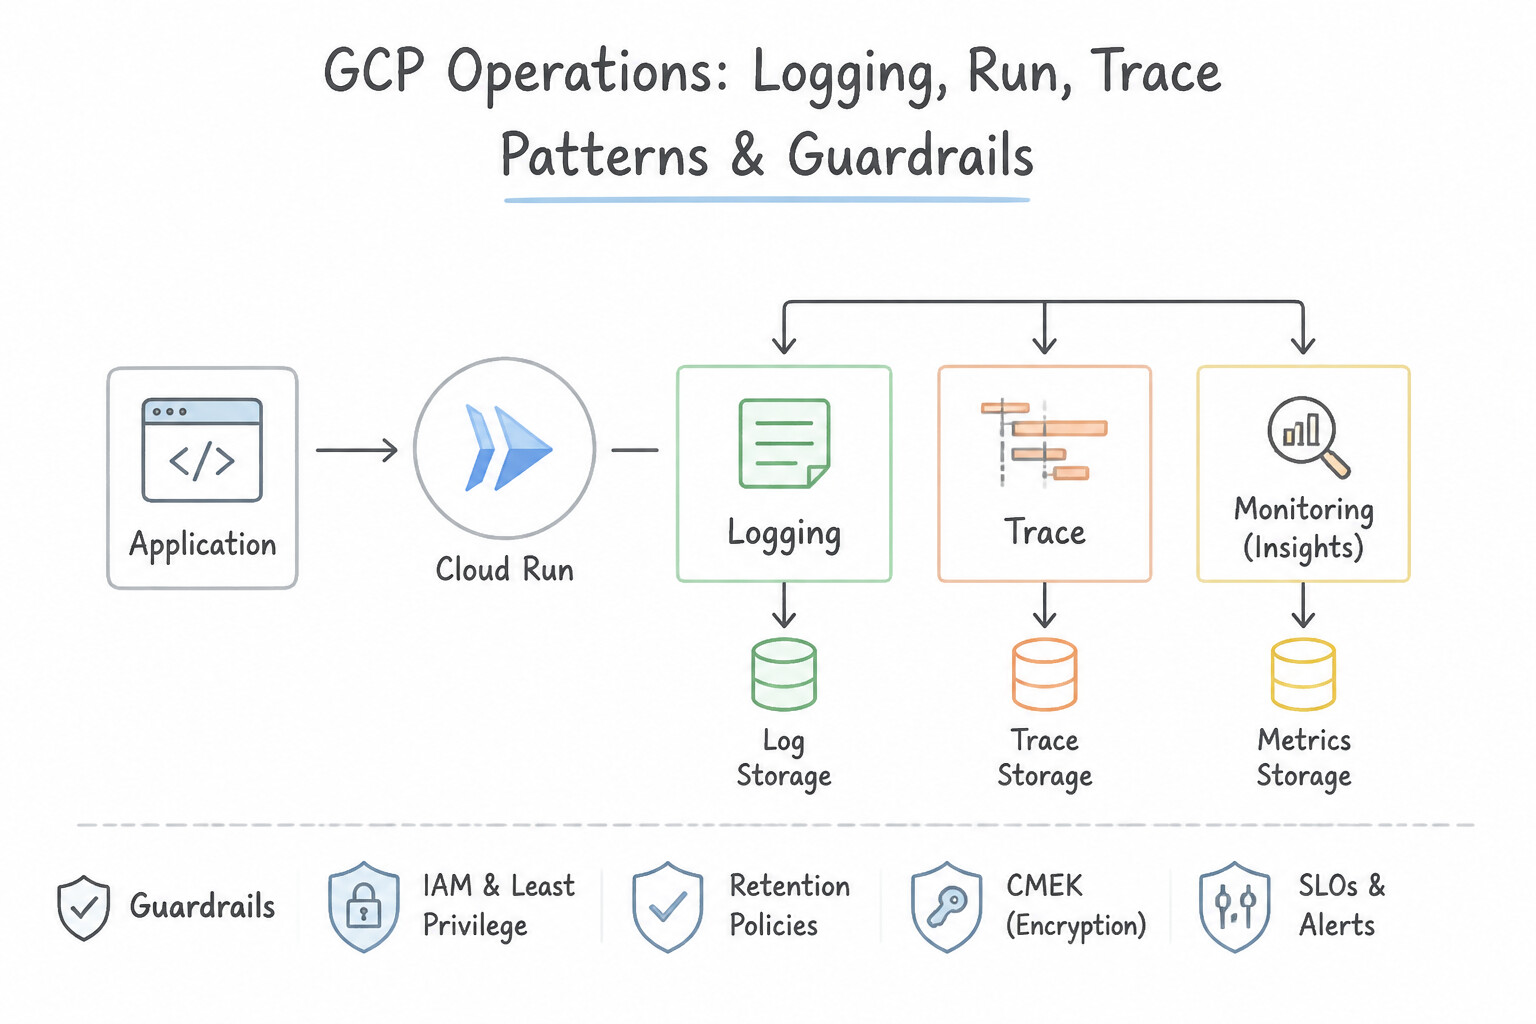
- To view application logs directly inline inside a Cloud Trace waterfall span (and jump from a log line in Logs Explorer straight to the full distributed trace), emit structured JSON logs containing these three special Cloud Logging fields:
"logging.googleapis.com/trace": Formatted strictly as"projects/[PROJECT_ID]/traces/[TRACE_ID]""logging.googleapis.com/spanId": The 16-character hex span ID ("00f067aa0ba902b7")"logging.googleapis.com/trace_sampled":true(boolean)- Most OpenTelemetry logging bridges and Google Cloud structured logging libraries inject these fields automatically whenever an active span context is passed to the logger.
Key Implementation Patterns
- Manual JSON Log Structuring: Use Add a field named "logging.googleapis.com/trace" containing the string "projects/[PROJECT_ID]/traces/[TRACE_ID]". You must use the special field
logging.googleapis.com/tracewith the full project resource path to enable trace correlation. - Trace ID String Formatting: Use Change the value of the "logging.googleapis.com/trace" field to the format "projects/[PROJECT_ID]/traces/[TRACE_ID]". The special trace field requires the format projects/[PROJECT_ID]/traces/[TRACE_ID] to correlate logs with traces. (Avoid alternative: Structured logging (JSON) is preferred over text logs for metadata extraction; reverting to text removes explicit control.)
Key Takeaways (4.4c)
- Structured logging uses JSON format instead of plain text.
- Special fields in the JSON payload (like
logging.googleapis.com/trace) control how Cloud Logging interprets metadata.- Trace correlation requires the full resource name format:
projects/[ID]/traces/[TRACE_ID].- Structured logs allow you to pass metadata to Cloud Logging using special JSON fields.
Consideration 4.4d: Employing Gemini Cloud Assist for trace analysis
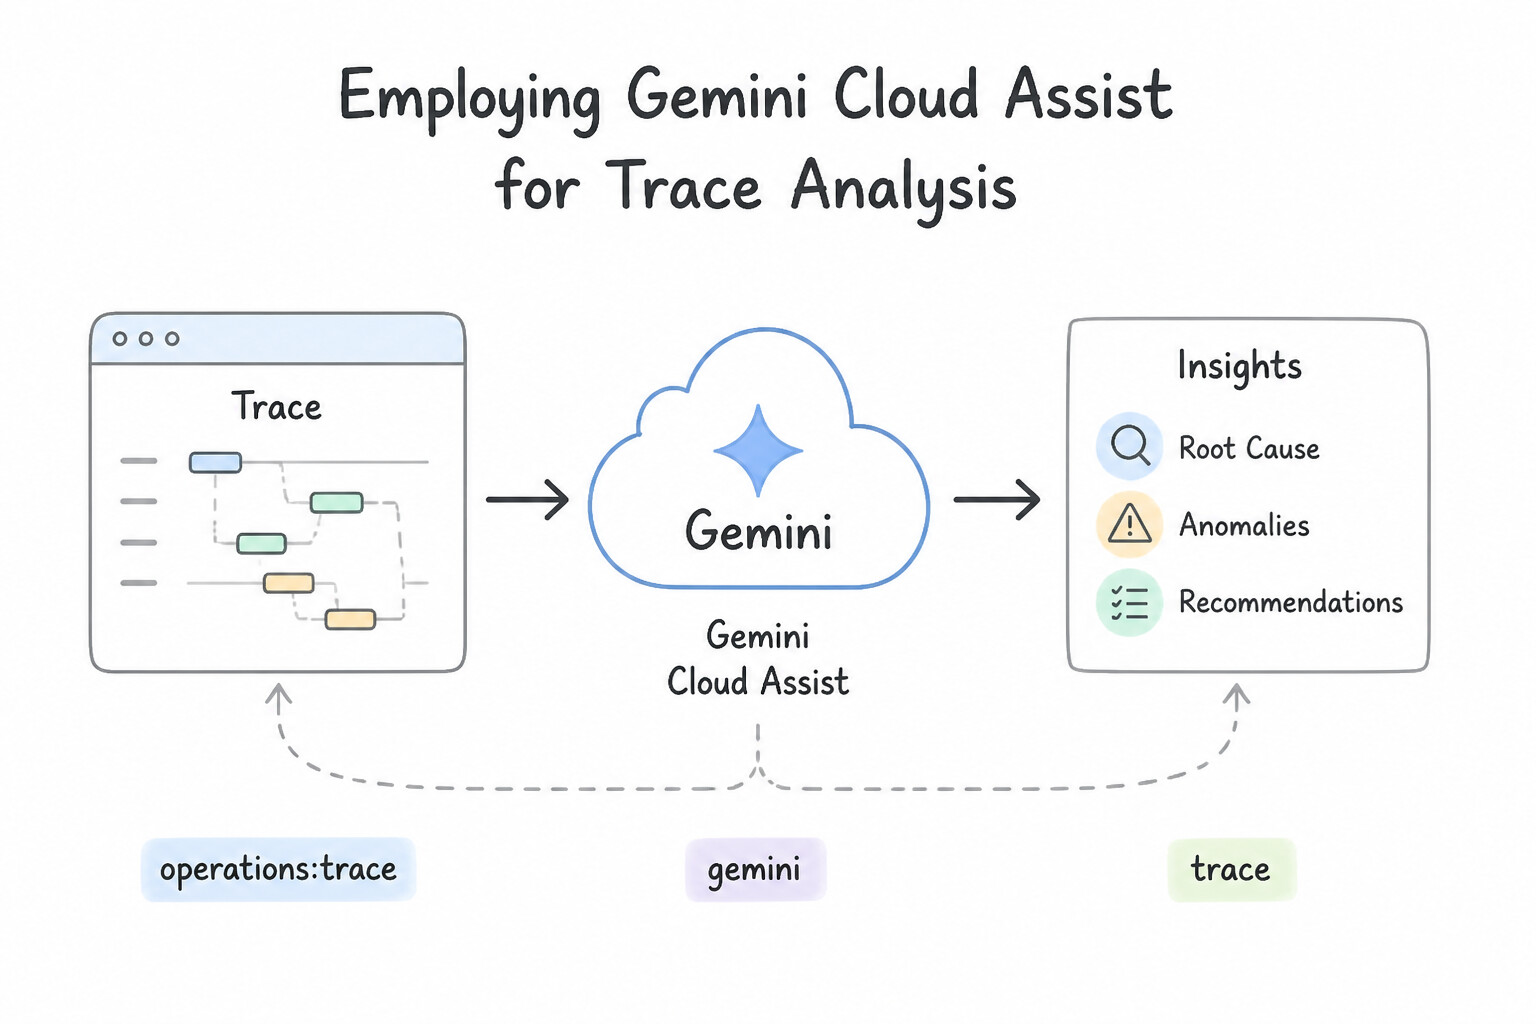
- Employing Gemini Cloud Assist for Trace Analysis (4.4d):
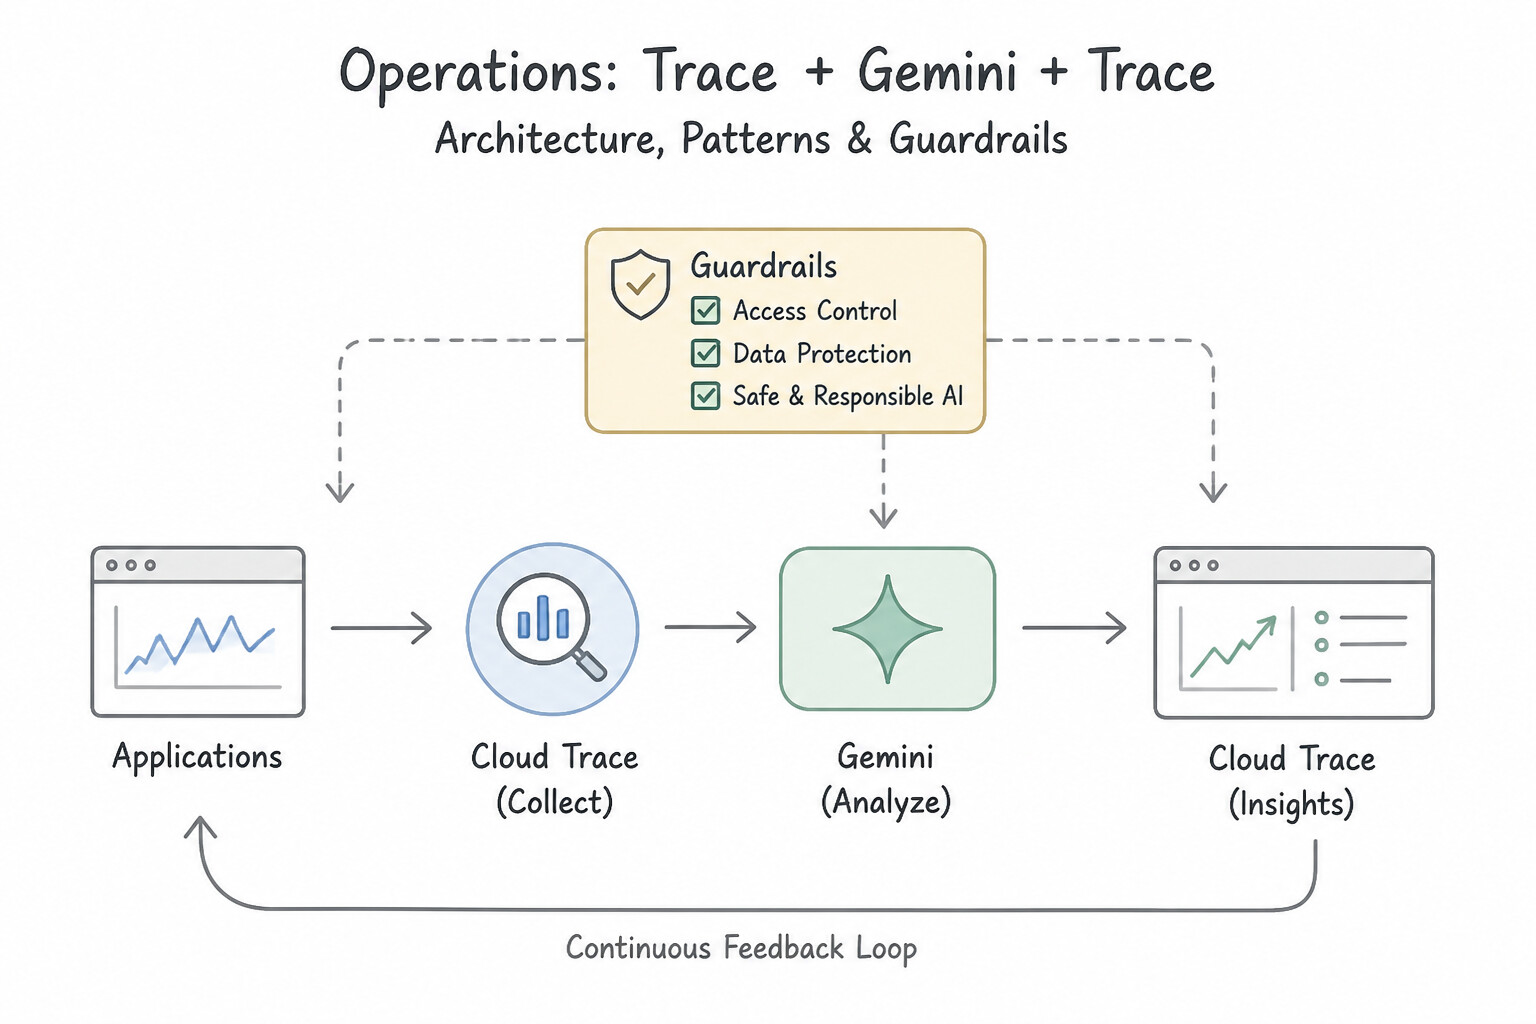
- When viewing a complex 50-span trace waterfall in Cloud Trace, invoke Gemini Cloud Assist to automatically summarize the critical path, identify the exact anomalous span responsible for the tail latency spike, correlate the span with attached Cloud Logging errors or GKE/Cloud Run deployment events, and recommend architectural remediations.
Key Implementation Patterns
- Natural Language Trace Filtering: Use Use the Gemini feature in the Cloud Trace console to generate the filter using a natural language prompt. Gemini in Cloud Trace converts natural language descriptions into valid trace filters, saving time on syntax lookup. (Avoid alternative: Manual filtering is valid but slower and requires more knowledge of the field names than using Gemini's natural language capabilities.)
- Identifying N+1 Database Patterns: Use Open the trace details in Cloud Trace, open the Gemini pane, and ask: "Does this trace show any N+1 antipatterns or sequential database calls?". Gemini in Cloud Trace is context-aware and can analyze the currently viewed trace structure for specific performance antipatterns like N+1.
- Summarizing Complex Trace Waterfalls: Use Select the trace in the Cloud Trace console and use Gemini to generate a summary of the trace. Gemini can analyze the selected trace context and generate a textual summary identifying bottlenecks and the critical path. (Avoid alternative: Manual inspection of filtered spans is inefficient for understanding the causal relationships in complex traces.)
Key Takeaways (4.4d)
- Cloud Trace is used to analyze latency and errors in distributed applications.
- Trace filters require specific syntax which can be complex to memorize.
- Gemini in Cloud Trace can interpret natural language queries and generate the corresponding trace filters automatically.
- Using AI assistance accelerates troubleshooting by removing the need for manual syntax lookup.
Quick Decision Cheat Sheet (Subsection 4.4)
If the Scenario Requires... | Choose This Google Cloud Pattern | Avoid This Common Mistake |
|---|---|---|
"Identify which downstream microservice in a 12-service call chain is responsible for an intermittent 2-second latency spike" | Cloud Trace (instrumented with OpenTelemetry) | Cloud Profiler (profiles CPU/heap inside a single process, not cross-service RPC latency) |
"What is the exact JSON field name and value format required to link a structured log entry to Cloud Trace?" | "logging.googleapis.com/trace": "projects/PROJECT_ID/traces/TRACE_ID" | "trace_id": "TRACE_ID" in plain text |
"Standard HTTP header used by OpenTelemetry to propagate distributed trace context across services" | traceparent (W3C Trace Context standard) | X-Forwarded-For or Authorization |
"Verify whether yesterday's canary deployment shifted the overall p95/p99 latency distribution compared to last week" | Create a Cloud Trace Analysis Report comparing the two time windows | Manually clicking 10 individual traces in the Trace Explorer list |
"Automatically summarize a 100-span trace waterfall and highlight the bottleneck span and correlated log error" | Use Gemini Cloud Assist inside Cloud Trace | Exporting trace spans to CSV to analyze in a spreadsheet |
Further Reading (Subsection 4.4)
- OpenTelemetry Java Automatic Instrumentation — Documentation on how to use the OpenTelemetry Java agent to automatically capture telemetry from Java applications.
- Cloud Trace overview — Overview of Google Cloud Trace, which can ingest traces generated by OpenTelemetry.
- Cloud Trace overview — Provides an overview of distributed tracing, spans, and how latency data is captured across services.
- OpenTelemetry Propagation — Explains the mechanism of context propagation, injection, and extraction in the OpenTelemetry framework.
- OpenTelemetry Sampling — Official documentation explaining how sampling works in OpenTelemetry, including Head and Tail sampling.
- Cloud Trace Pricing — Details on how Cloud Trace charges based on the number of spans ingested and scanned.
Subsection 4.5: Troubleshooting issues
The Big Picture
Section 4.5 is the ultimate diagnostic crucible of the Architecture Stack: you are handed a broken production symptom—pods stuck in Pending, a Cloud Build pipeline failing midway, a microservice restarting with Exit Code 137, missing metrics in Cloud Monitoring, or sudden HTTP 502 timeouts—and asked to pinpoint the exact root cause and fix.
Expert SREs never guess randomly; they isolate the failure to one of Five Diagnostic Planes:
- Infrastructure Plane (
4.5a— GKE Scheduling, Node Exhaustion, VPC/Firewall/NAT Drops): PendingPods (Unschedulable):0/4 nodes are available: Insufficient cpu/memory(podrequestsexceed largest node allocatable capacity, or regional quota is full) vs.node(s) had untolerated taint(missingtolerationsfor a tainted GPU/spot node pool) vs.PodTopologySpread/NodeAffinitymismatch.OOMKilled(Exit Code 137): Container working-set memory exceeded its Kubernetesresources.limits.memory(or host kernel OOM killer fired).- Silent Network Drops: Diagnose with VPC Flow Logs, Firewall Insights / Firewall Rules Logging, and Network Intelligence Center Connectivity Tests.
- CI/CD Pipeline Plane (
4.5b— IAM, Private Pool Routing, Digest/Attestation Mismatches): Isolate whether the failure occurred at Trigger/Webhook, Build Step Execution (Cloud Build SA permissions / Private Pool network), Artifact Push/Scan, or Admission/Rollout (Cloud Deploy SA / Binary Authorization). - Application Plane (
4.5c— Exceptions, Deadlocks, Connection Pool Exhaustion, Thundering Herds): Group uncaught exceptions automatically with Error Reporting, prevent synchronized retry storms with exponential backoff + jitter, and tune liveness/readiness probes. - Observability Plane (
4.5d— Missing Logs/Metrics/Traces): When telemetry vanishes, check (1) Service Account IAM roles (roles/logging.logWriter,roles/monitoring.metricWriter,roles/cloudtrace.agent), (2) Private Google Access / outbound connectivity to*.googleapis.com, and (3) Log Router Exclusion Filters or Ops Agent syntax errors. - Performance & Latency Plane (
4.5e— Tail Latency, Cold Starts, CPU Throttling): Combine Cloud Trace (inter-service RPCs), Cloud Profiler (intra-process CPU/memory hotspots), and container CPU throttling metrics (container/cpu/throttled_time).
Consideration 4.5a: Infrastructure issues
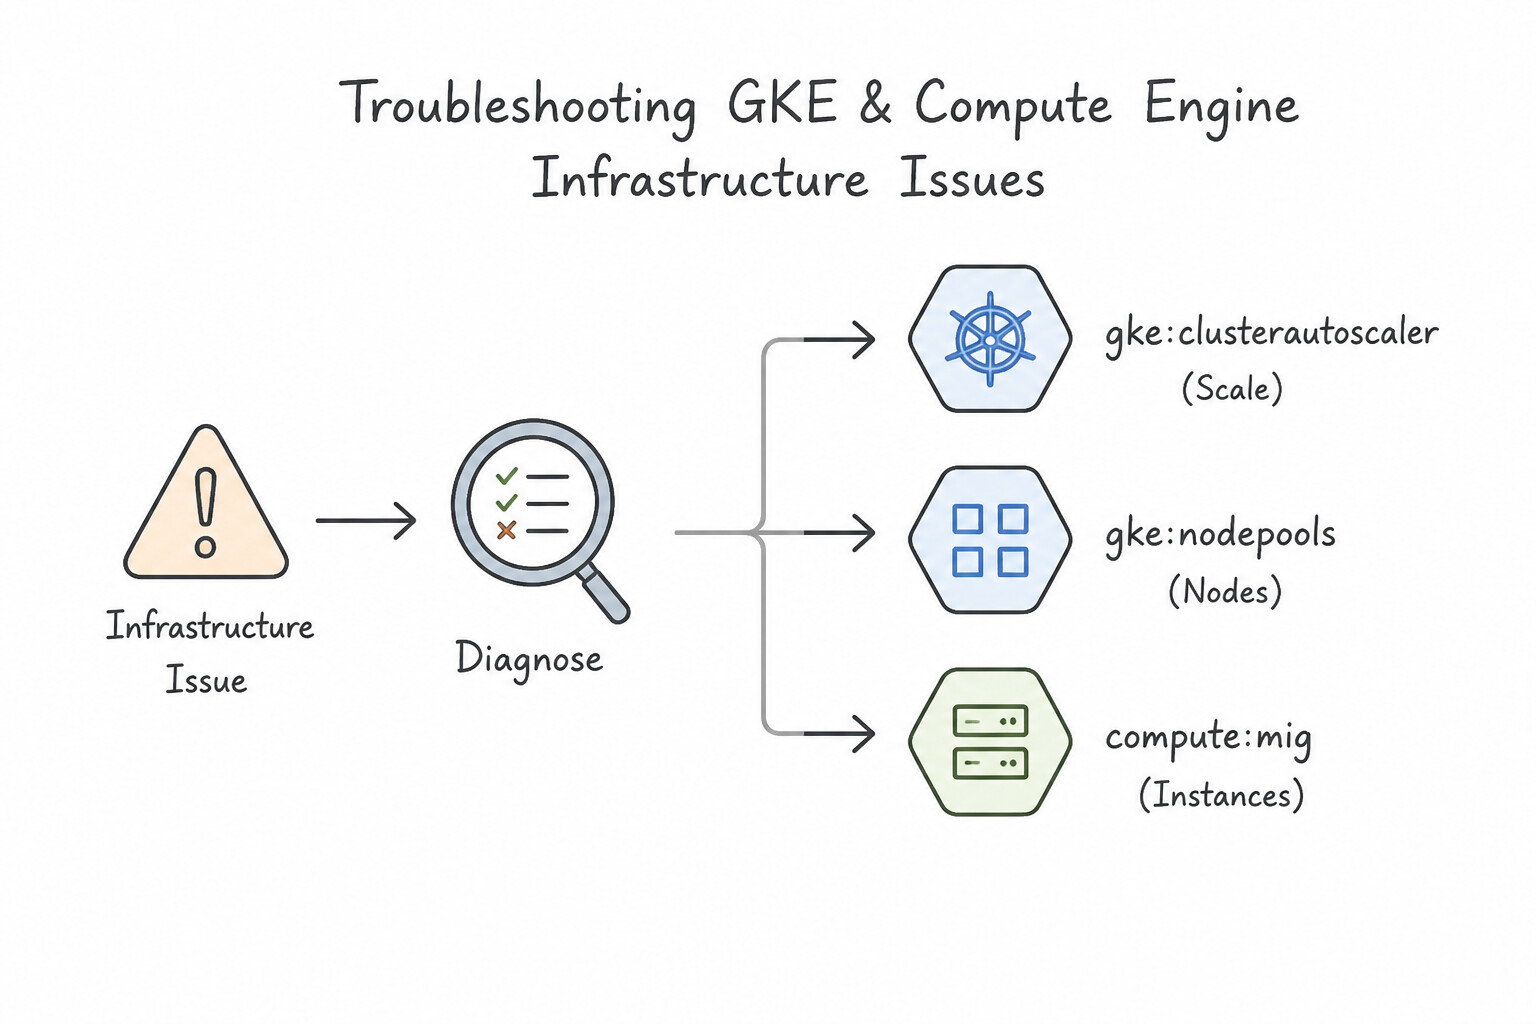
- Troubleshooting GKE & Compute Engine Infrastructure Issues (4.5a):
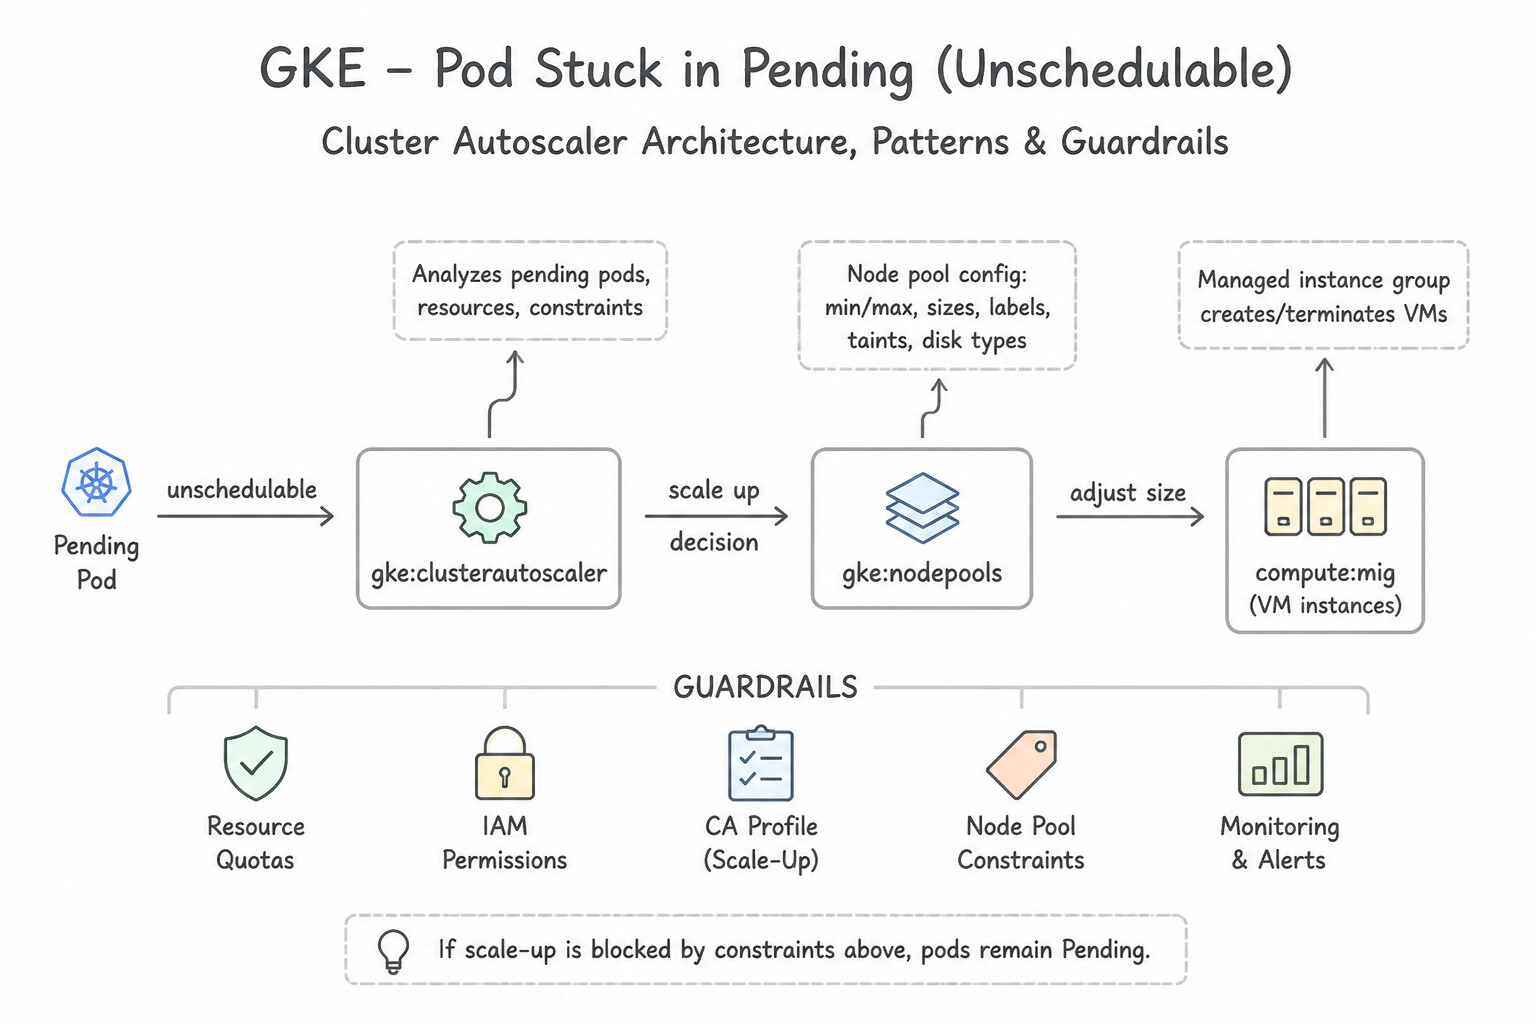
- Pod Stuck in
Pending(Unschedulable) Despite Cluster Autoscaler Being Enabled: - Case 1 (Single Pod Request > Node Allocatable Capacity): A pod requests
14 GiBof memory, and your node pool usese2-standard-4(16 GiBtotal RAM, of which ~13.2 GiBis allocatable after kubelet/OS reservations). Adding moree2-standard-4nodes will never fit a 14 GiB pod! Fix: Right-size the pod memory request OR use a larger machine type (e2-standard-8) / enable Node Auto-Provisioning (NAP). - Case 2 (Maximum Node Pool Size or GCP Regional Quota Reached): Cluster Autoscaler hit
--max-nodesor the project exhausted its regionalCPUS/SSD_TOTAL_GB/ IP subnet/24pod CIDR range. - Case 3 (Taints, Node Affinity, or Pod Anti-Affinity): The only available nodes have a taint (
dedicated=gpu:NoSchedule) that the pod does not tolerate. - Pod Crashing with
OOMKilled(Exit Code 137): The container exceeded its memorylimit. Inspectkubernetes.io/container/memory/used_bytesin Cloud Monitoring and run Cloud Profiler (Heap Profile); if it's normal growth under load, raiseresources.limits.memory(andrequests.memory), or fix the memory leak if heap usage climbs monotonically. - Networking & Connectivity Failures: When a VM or GKE pod cannot reach an internal IP or external API, run a Network Intelligence Center Connectivity Test (which simulates packet headers across VPC routes, peering, firewall rules, and Cloud NAT to pinpoint the exact blocking rule) and inspect Firewall Rules Logging / VPC Flow Logs.
Key Implementation Patterns
- GKE Pods Stuck in Pending State: Use Enable the Cluster Autoscaler on the node pool. The Cluster Autoscaler adds nodes to the cluster when pods cannot be scheduled due to resource constraints, solving the 'Insufficient cpu' error automatically. (Avoid alternative: HPA scales the number of pods, not the number of nodes. Since the current nodes are full, HPA cannot resolve the resource shortage.)
- MIG Instances in Restart Loop: Use Increase the initial delay in the auto-healing policy to more than 180 seconds. The application needs more time to start than the current configuration allows; increasing the initial delay prevents premature health check failures. (Avoid alternative: The check interval controls frequency between checks, not the delay before the first check starts.)
- Load Balancer Health Check Failures: Use Create an ingress firewall rule that allows traffic from the source ranges 130.211.0.0/22 and 35.191.0.0/16 on port 8080. Load Balancer health checks originate from 130.211.0.0/22 and 35.191.0.0/16. You must create a firewall rule to allow this traffic.
Key Takeaways (4.5a)
- Pods stay in 'Pending' state with 'Insufficient cpu' when no nodes have enough allocatable CPU.
- Cluster Autoscaler automatically adds nodes when pods are unschedulable due to resource constraints.
- Horizontal Pod Autoscaler (HPA) scales pods, not nodes.
- Manual scaling does not meet requirements for automatic future handling.
Consideration 4.5b: CI/CD pipeline issues
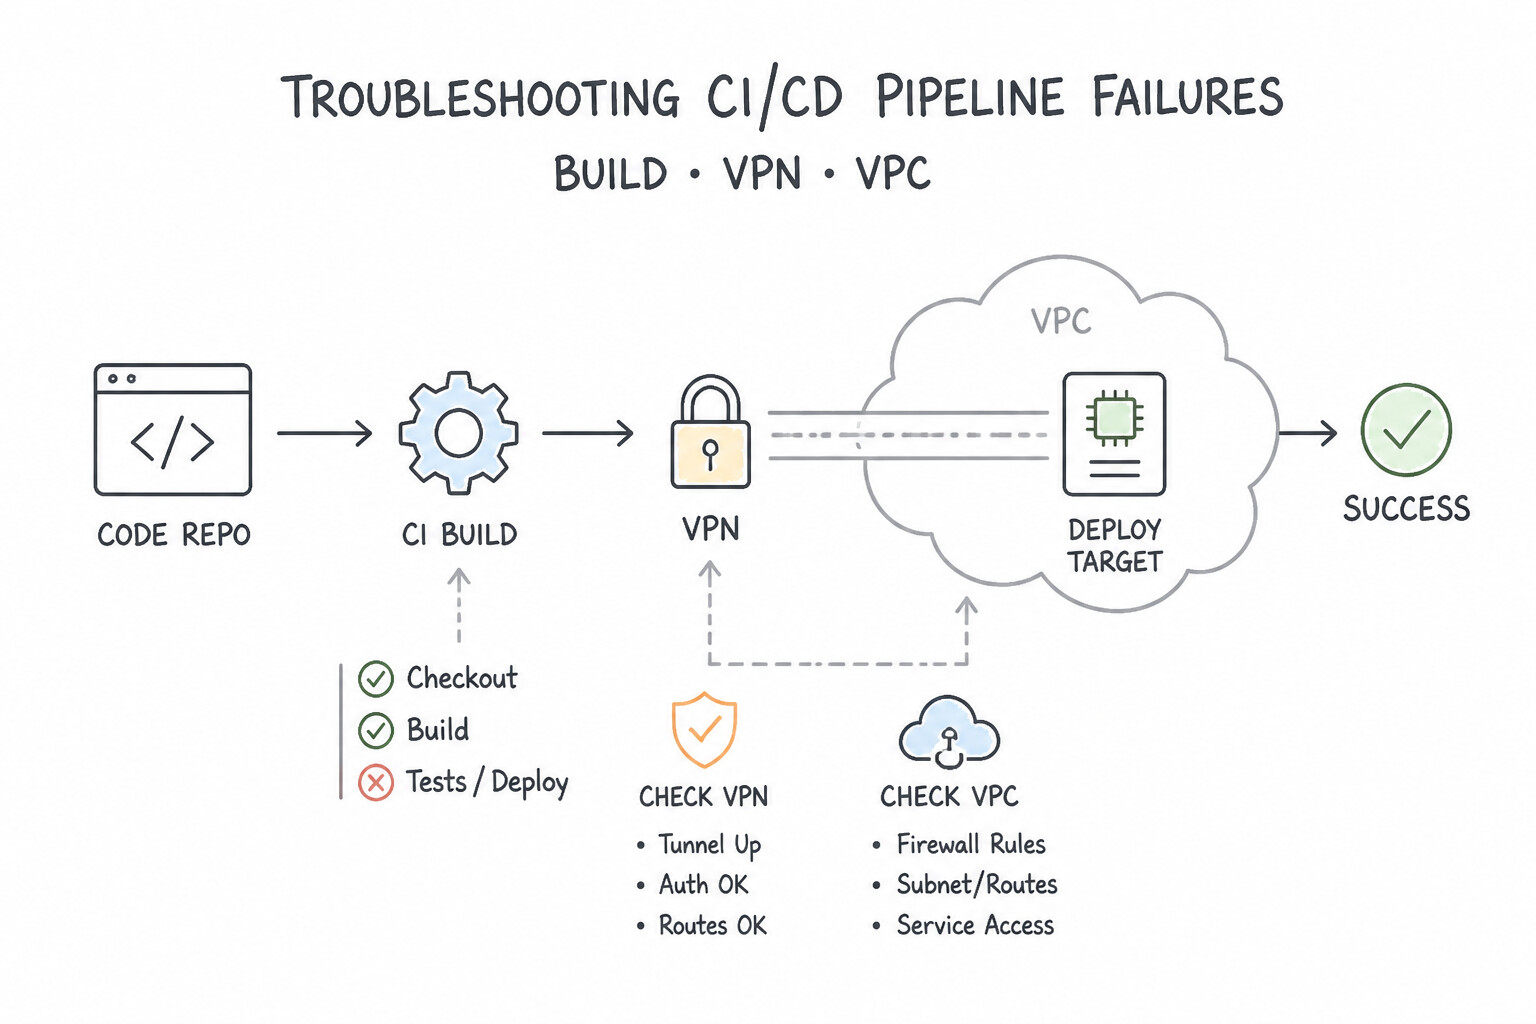
- Troubleshooting CI/CD Pipeline Failures (4.5b):
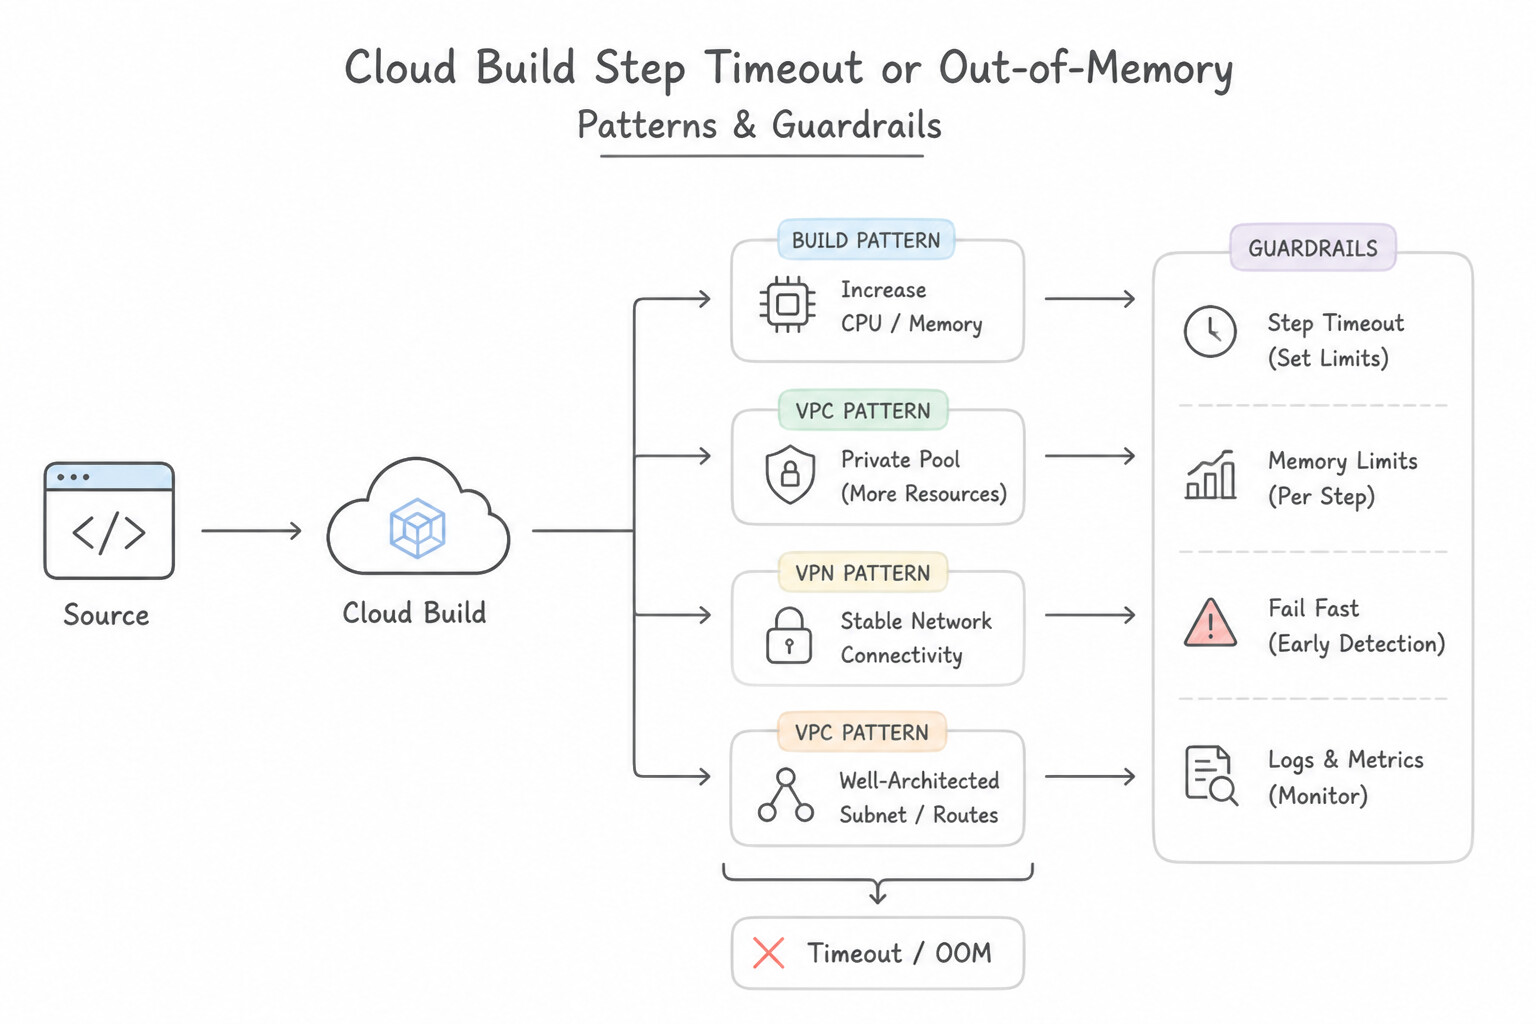
- Cloud Build Step Timeout or Out-of-Memory: Increase the build
timeout(default 10 minutes), upgradeoptions.machineType(e.g.,E2_HIGHCPU_8), or fix deadlocked tests. - Variable Expansion Errors in
cloudbuild.yaml: Remember that Cloud Build substitution variables use a single$($_MY_VAR,$PROJECT_ID,$SHORT_SHA), whereas bash environment variables andsecretEnvvariables inside abash -cstep must be escaped with a double$$($$MY_SECRET,$$PATH). - Terraform State Lock Stuck After Aborted CI Build: If a Cloud Build runner was forcibly terminated mid-plan/apply, leaving a stale
.tflockfile in the GCS state bucket, verify no other build is running and executeterraform force-unlock <LOCK_ID>.
Key Implementation Patterns
- Cloud Build Timeout Troubleshooting: Use Increase the "timeout" value in the "cloudbuild.yaml" file. The default timeout for Cloud Build is 10 minutes; increasing the "timeout" field resolves the "DEADLINE_EXCEEDED" error. (Avoid alternative: Improving machine performance does not change the hard execution time limit set in the configuration.)
- Private Network Access in Builds: Use Create a Cloud Build private pool. Configure the pool to peer with your VPC network. Private pools enable Cloud Build workers to access private networks via VPC Network Peering. (Avoid alternative: Changing the timeout does not fix the lack of network route to the internal IP address.)
- IAM Permissions for Deployment: Use Grant the Cloud Run Admin and Service Account User roles to the default Cloud Build service account. The Cloud Build service account requires specific IAM roles to deploy and configure identity for Cloud Run services. (Avoid alternative: Permission Denied errors relate to IAM authorization, not the enabled status of the service API.)
Key Takeaways (4.5b)
- The default timeout for Cloud Build is 10 minutes.
- A
DEADLINE_EXCEEDEDerror typically indicates a timeout limit has been reached.- Use the
timeoutfield in the configuration file to extend build duration up to 24 hours.- Increasing machine power accelerates builds but does not change the hard time limit configuration.
Consideration 4.5c: Application issues
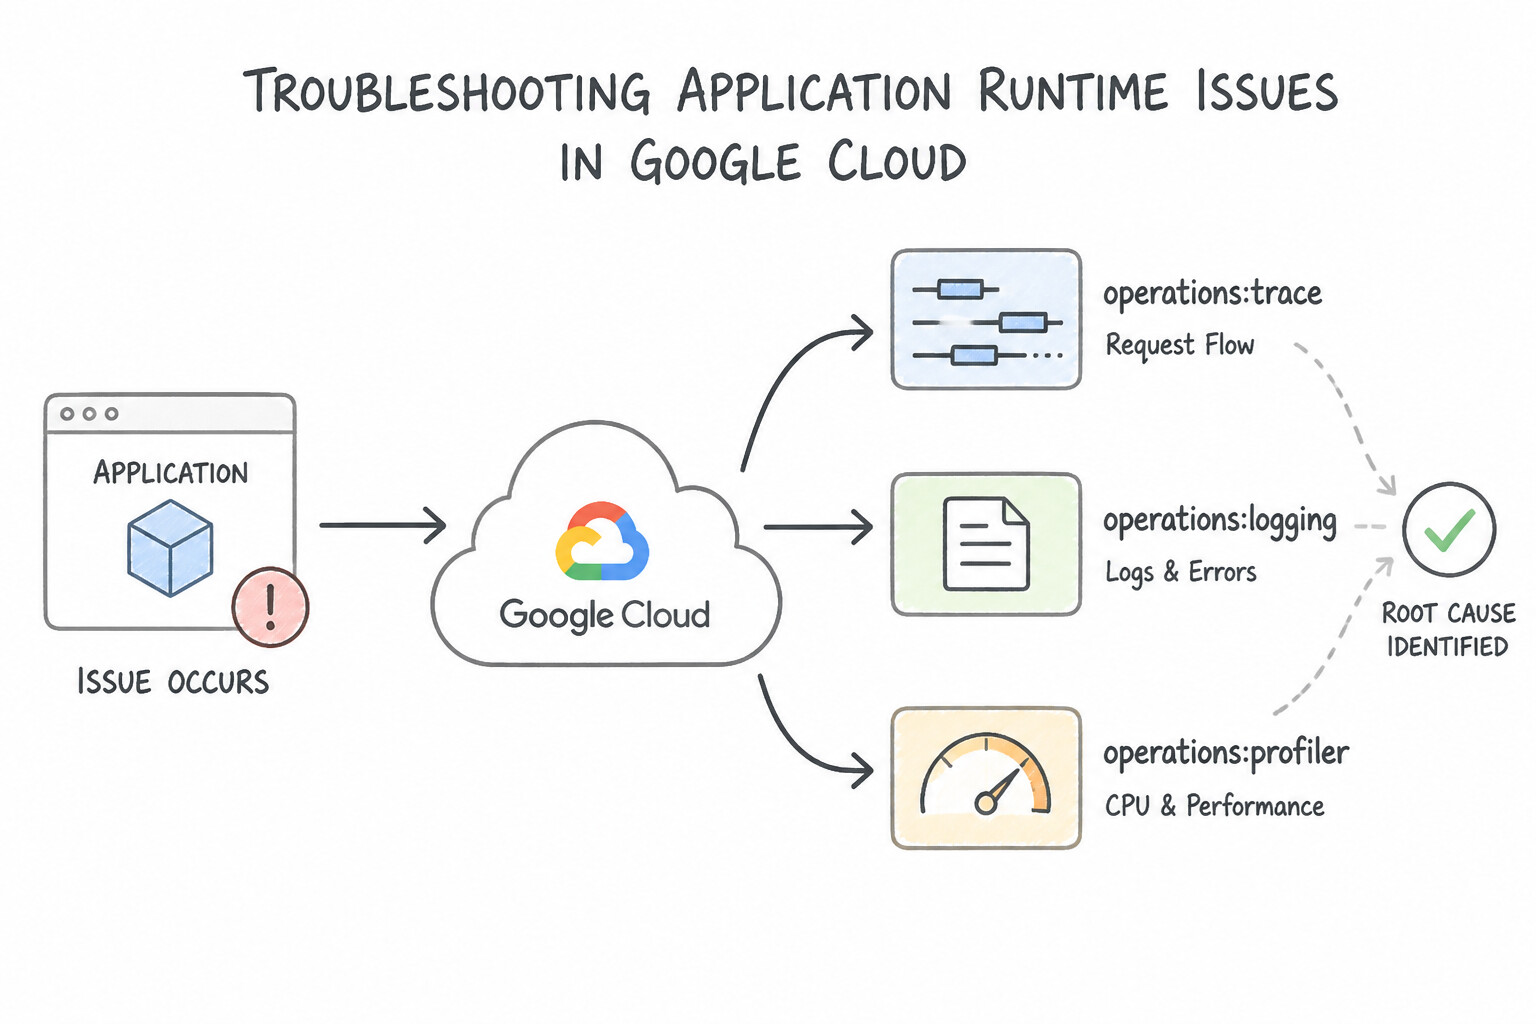
- Troubleshooting Application Runtime Issues (4.5c):
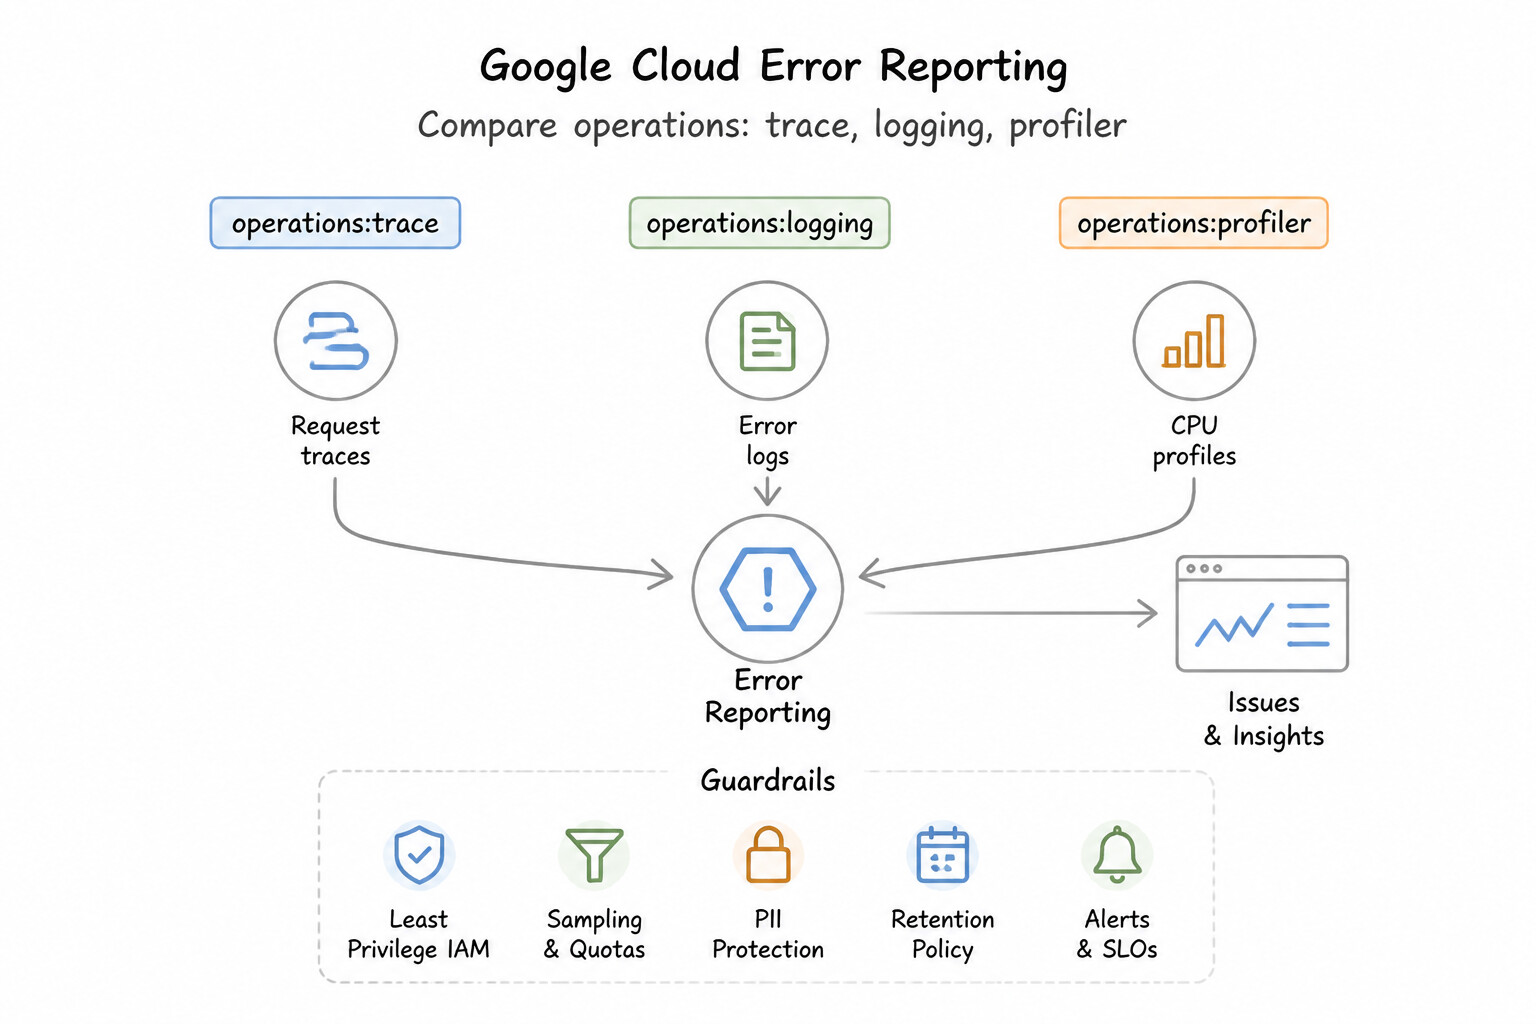
- Google Cloud Error Reporting: Automatically parses real-time crash stack traces from Cloud Logging (across Go, Java, Python, Node.js, .NET, Ruby, PHP), deduplicates and groups identical call stacks into a single error issue, tracks first/last seen revisions, and fires alerts whenever a brand-new exception class appears after a deployment.
- HTTP
429 Too Many Requests/ Cascading Retry Storms: When hundreds of pods simultaneously retry a rate-limited downstream API or restart at once after a configuration update, they create a synchronized thundering herd. Fix by implementing truncated exponential backoff with random jitter and client-side circuit breaking. HTTP 502 Bad Gateway/504 Gateway TimeoutBehind a Load Balancer:- Check that the application listens on
0.0.0.0:$PORT(not127.0.0.1), that Firewall Rules allow ingress from Google's health-check probe IP ranges (35.191.0.0/16and130.211.0.0/22), that the Load Balancer Backend Service timeout is greater than the application's max response time, and that HTTP Keep-Alive timeout on the backend web server (e.g., Nginx/Node.js) is longer than the Load Balancer's 600-second keep-alive timeout!
Key Implementation Patterns
- Diagnosing High Latency in Microservices Chain: Use Instrument the services with Cloud Trace to visualize the request flow and latency breakdown across the microservices. Cloud Trace provides a waterfall visualization of request latency across distributed microservices, making it easy to identify bottlenecks.
- Analyzing Production Memory Leaks: Use Configure the application to use the Cloud Profiler agent and analyze the heap profile. Cloud Profiler provides low-overhead, continuous monitoring of memory allocation (heap) in production, making it ideal for identifying leaks. (Avoid alternative: Increasing memory limits only delays the inevitable crash and does not help identify or fix the root cause of the memory leak.)
- Troubleshooting Cloud Run Cold Starts: Use Set the minimum number of instances to 1. Keeping one instance active prevents the service from scaling to zero, avoiding cold starts. (Avoid alternative: More memory helps runtime performance but does not stop the service from scaling to zero.)
Key Takeaways (4.5c)
- Cloud Trace is for identifying latency bottlenecks across distributed services (microservices).
- Cloud Profiler is for optimizing CPU and Memory usage within a specific code function.
- Cloud Monitoring is for alerting on aggregate metrics (CPU %, Error Rates) and health.
- Cloud Logging is for auditing events and errors, but hard to use for latency correlation manually.
Consideration 4.5d: Observability issues
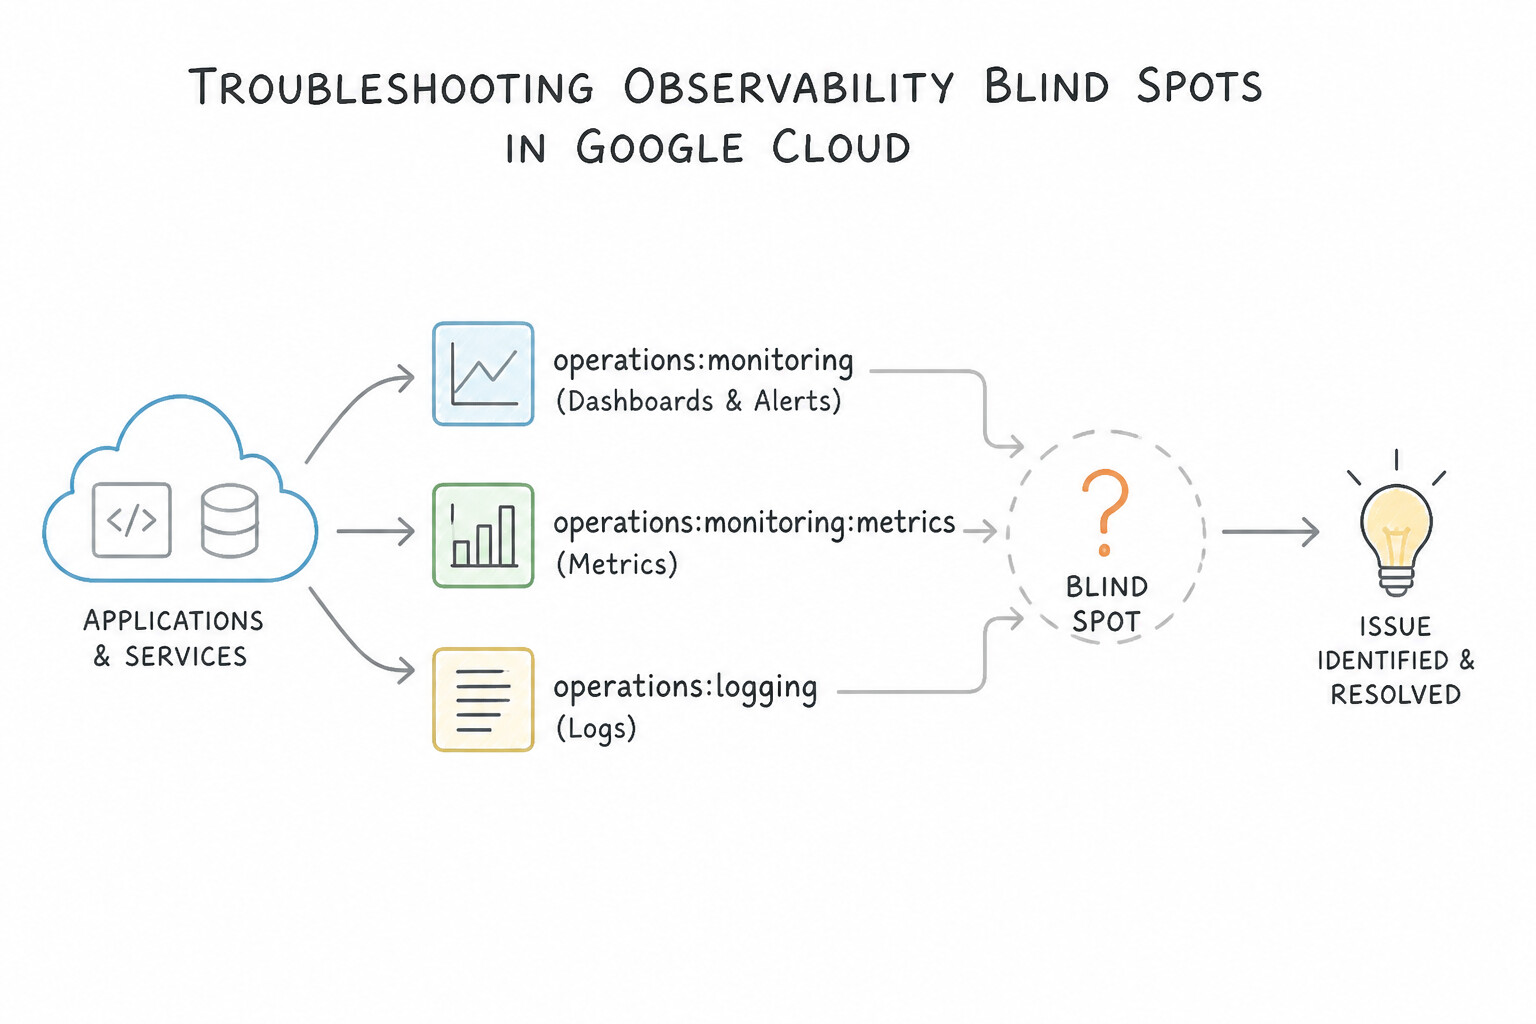
- Troubleshooting Observability Blind Spots (4.5d):
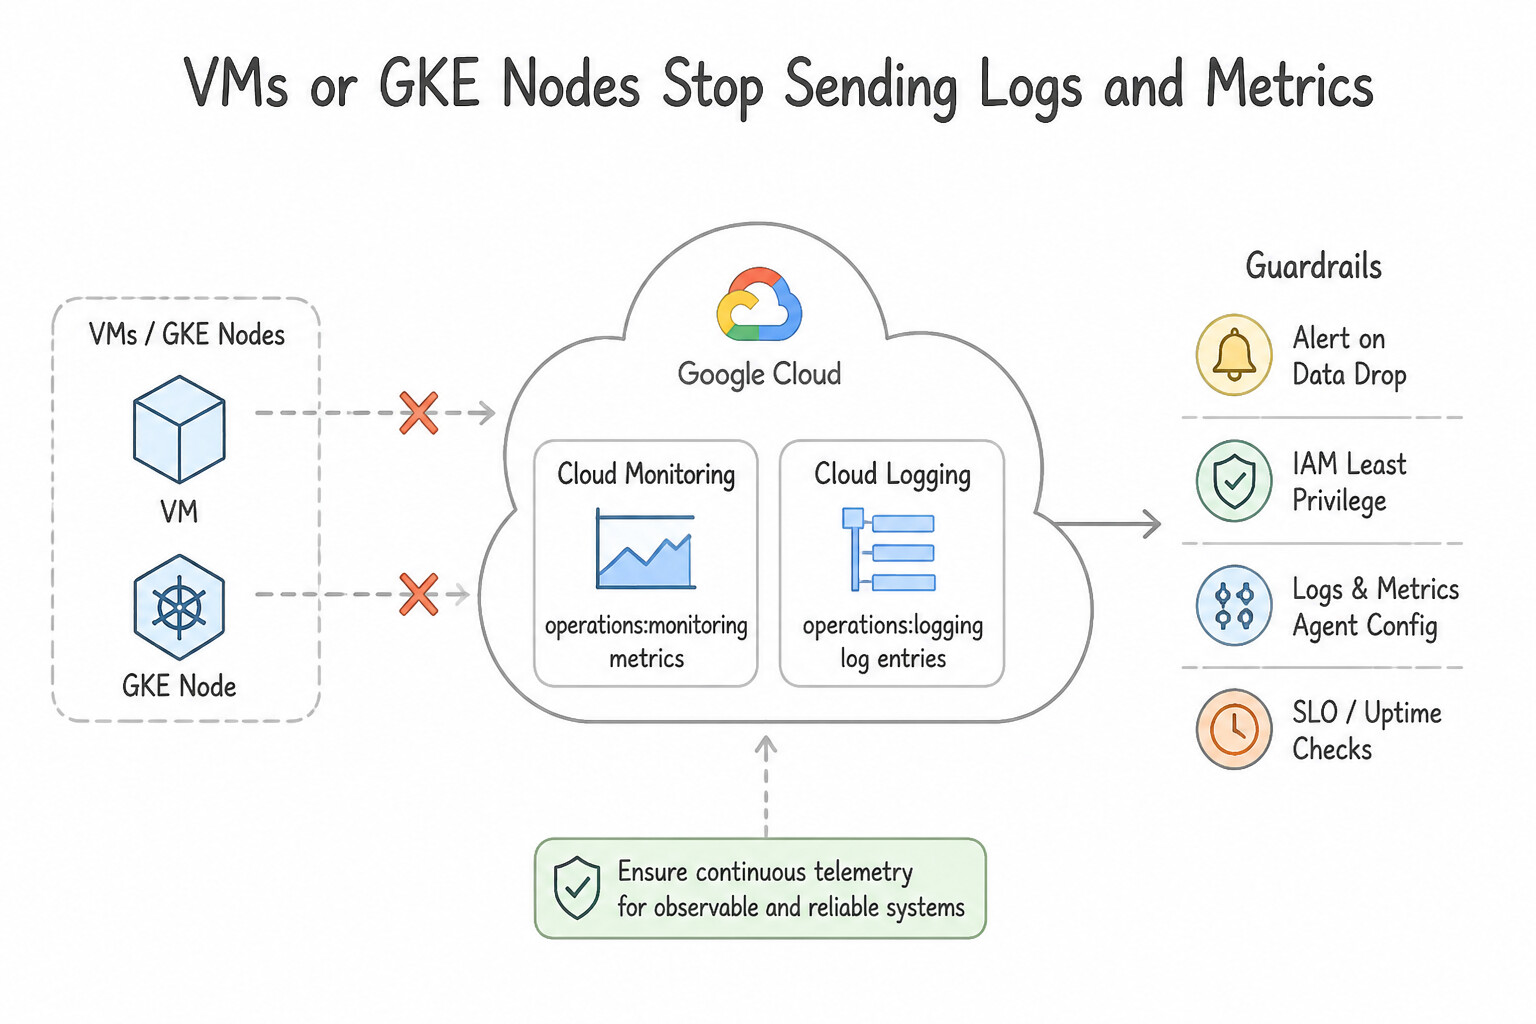
- VMs or GKE Nodes Stop Sending Logs and Metrics:
- Check the attached Service Account IAM roles: it must have
roles/logging.logWriter,roles/monitoring.metricWriter, androles/cloudtrace.agent. - Check Access Scopes on legacy VMs (
cloud-platformor write-enabled logging/monitoring scopes). - Check Network Egress: if the VM or GKE node has no public IP and no Cloud NAT, Private Google Access (
PGA) must be enabled on its VPC subnet so it can reachlogging.googleapis.comandmonitoring.googleapis.com! - Ops Agent Not Collecting Custom Logs: Run
sudo systemctl status google-cloud-ops-agent*, validate/etc/google-cloud-ops-agent/config.yamlsyntax, and verify thegoogle-cloud-ops-agentuser has Linux read (r) permissions on the target/var/log/...directory and file.
Key Implementation Patterns
- High Cardinality in Custom Metrics: Use Modify the application to remove the "user_id" label from the custom metric. Removing the high-cardinality label reduces the number of unique time series, effectively lowering costs and improving query speed. (Avoid alternative: Increasing quotas allows more data ingestion but does not fix the cost or performance issues caused by high cardinality.)
- Missing Logs in GKE Stdout: Use Modify the application configuration to write logs to standard output (stdout) and standard error (stderr). GKE automatically collects logs written to stdout and stderr; redirecting application logs there ensures they appear in Cloud Logging.
Key Takeaways (4.5d)
- Cardinality is the number of unique time series in a metric.
- Labels with high unique values (like
user_id,IP address,UUID) cause High Cardinality.- High cardinality increases Cloud Monitoring costs and degrades query latency.
- Do not use high-cardinality values as metric labels; use Logs for high-detail data.
Consideration 4.5e: Performance and latency issues
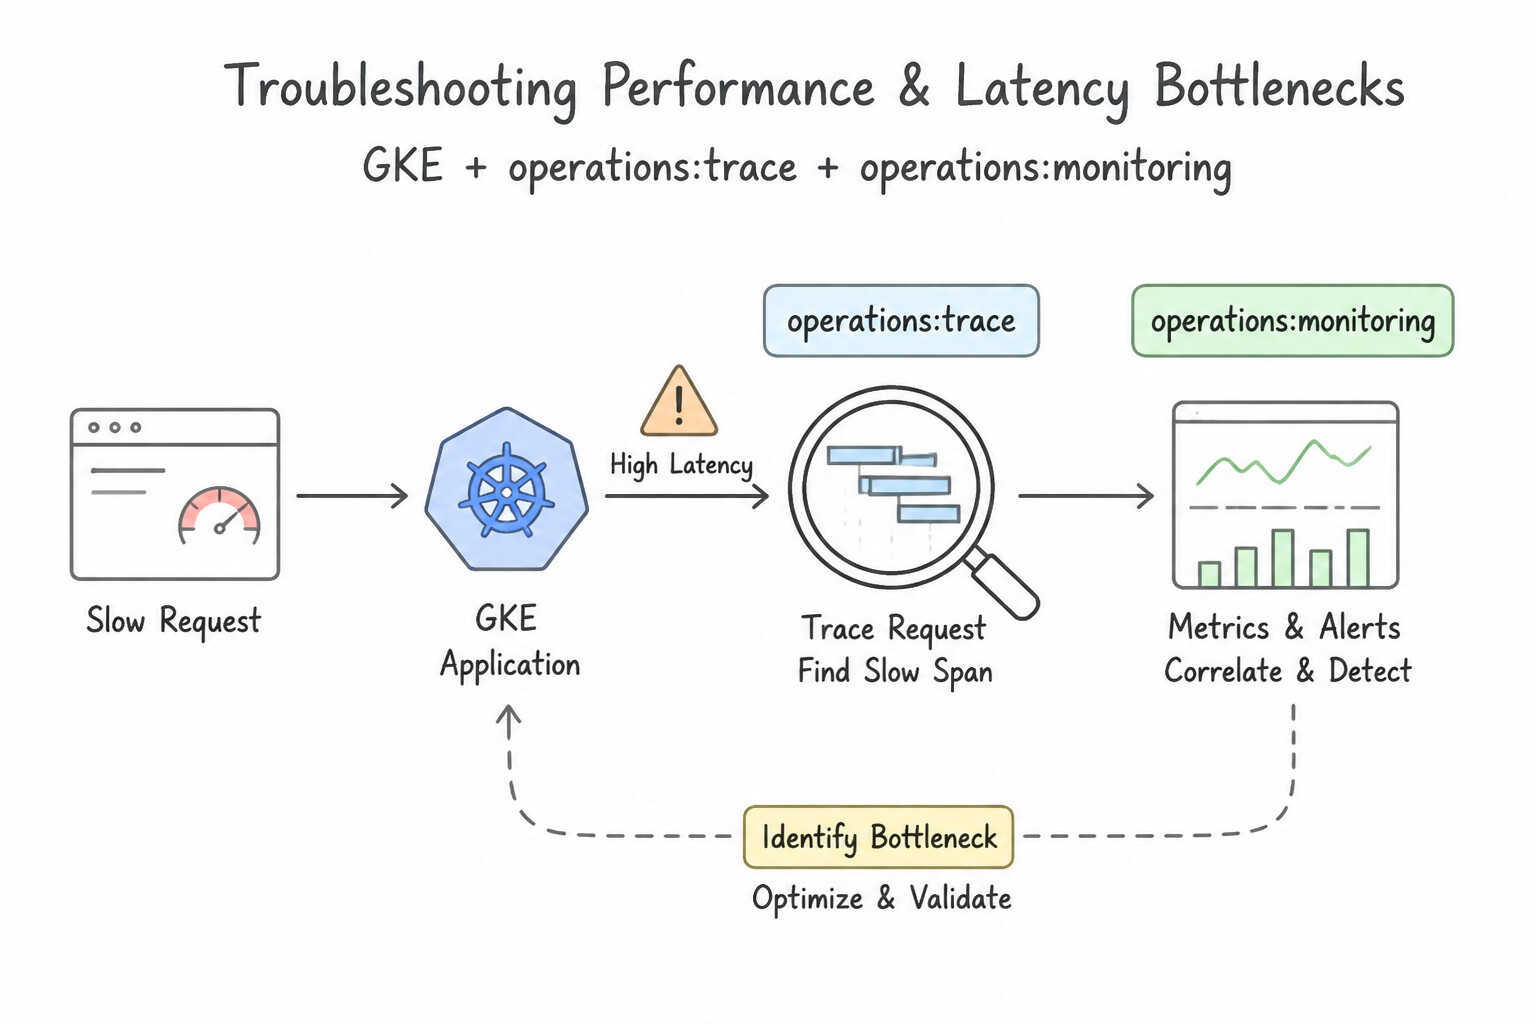
- Troubleshooting Performance & Latency Bottlenecks (4.5e):
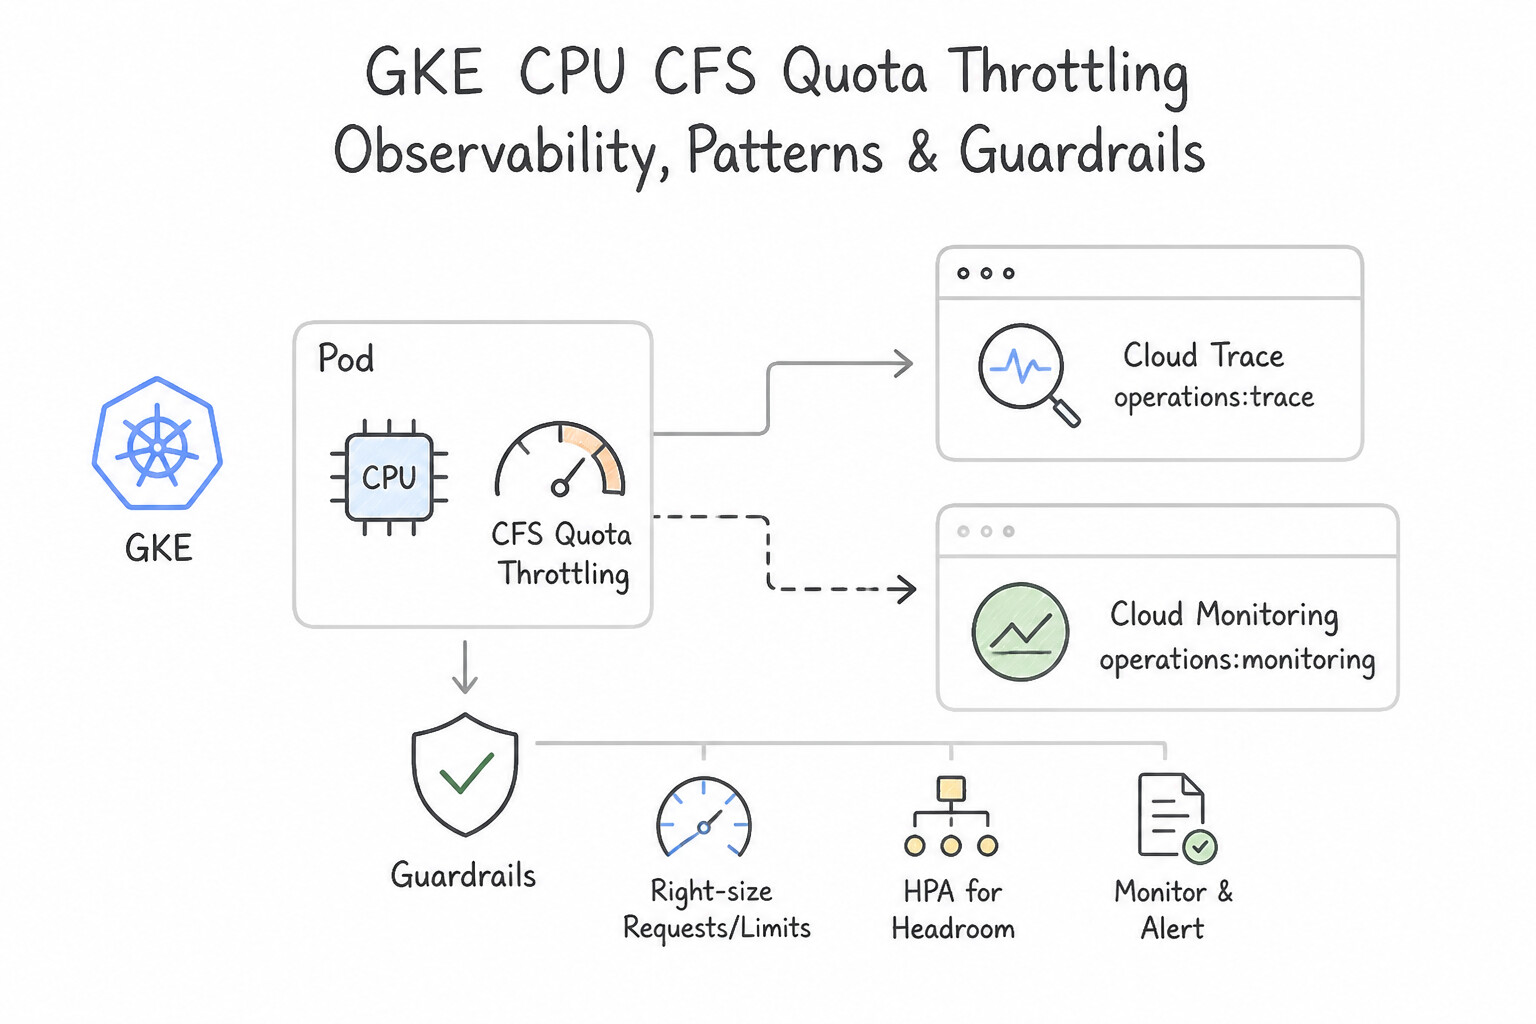
- CPU CFS Quota Throttling on GKE: If a multi-threaded Go or Java service has
p99latency spikes even though average node CPU is only 40%, checkcontainer/cpu/throttled_time! Setting a tightresources.limits.cpuon bursty latency-sensitive pods causes the Linux CFS scheduler to pause all container threads whenever a 100ms burst exceeds its quota. Google-Recommended GKE Best Practice: Always set accuraterequests.cpuandrequests.memory, setlimits.memory == requests.memory(for Guaranteed memory stability), and omit or loosenlimits.cpuon latency-sensitive workloads so pods can burst into idle node CPU! - Database Connection Exhaustion & Slow Queries: Use Cloud SQL Insights (query tags, lock wait graphs) and connection pooling (Cloud SQL Auth Proxy / PgBouncer) when database latency spikes under high concurrency.
Key Implementation Patterns
- Diagnosing Microservice Bottlenecks with Cloud Trace: Use Instrument the application to capture traces and export them to Cloud Trace. Analyze the waterfall graphs to identify the slow service. Cloud Trace visualizes the lifecycle of a request across microservices, allowing you to pinpoint exactly where latency occurs.
- Troubleshooting Cloud Spanner Hotspots: Use Use Key Visualizer to analyze the access patterns and traffic distribution. Key Visualizer displays heatmaps to identify hotspots and uneven access patterns causing latency despite low average CPU. (Avoid alternative: Scaling out is useful for high CPU usage, not for uneven data distribution issues like hotspots.)
- Cloud SQL Query Performance Analysis: Use Enable Query Insights on the Cloud SQL instance to analyze queries by CPU usage. Query Insights is specifically designed to visualize and analyze query performance and resource consumption in Cloud SQL. (Avoid alternative: Cloud Monitoring shows overall instance health but lacks the granularity to inspect individual SQL query performance.)
Key Takeaways (4.5e)
- Cloud Trace is the primary tool for diagnosing latency in distributed microservices.
- High latency with normal CPU/Memory often indicates wait times (network, database locks, downstream dependencies), not resource exhaustion.
- Cloud Profiler is for code-level efficiency (CPU/RAM loops).
- Cloud Logging is for event and error investigation.
Quick Decision Cheat Sheet (Subsection 4.5)
If the Scenario Requires... | Choose This Google Cloud Pattern | Avoid This Common Mistake |
|---|---|---|
"Pod terminates with Exit Code 137" | OOMKilled (SIGKILL due to exceeding resources.limits.memory or node memory starvation) | Exit Code 1 (application error) or Exit Code 143 (SIGTERM graceful shutdown) |
"500 pods restart at once and overwhelm an internal API with HTTP 429 Too Many Requests" | Implement Exponential Backoff with Jitter in the client retry logic | Increasing the client retry frequency |
"Automatically group identical application crash stack traces from Cloud Logging and alert only when a new exception appears" | Use Google Cloud Error Reporting | Creating a separate regex log-based metric for every possible Java exception class |
"Simulate a packet from VM A to Cloud SQL B across Shared VPC, Peering, and Firewalls to find which rule drops the connection" | Run a Network Intelligence Center Connectivity Test | Running tcpdump manually on managed Cloud SQL (not possible) |
"Multi-threaded Java/Go service on GKE has high p99 latency spikes and high container/cpu/throttled_time despite low node CPU usage" | Remove or increase resources.limits.cpu while keeping accurate requests.cpu | Switching the cluster to a different region |
Further Reading (Subsection 4.5)
- Cluster Autoscaler documentation — Explains how Cluster Autoscaler works by automatically resizing node pools based on the demands of your workloads, specifically when pods are unschedulable.
- Setting up health checking and autohealing — Refer to the section 'Setting an initial delay' to understand how to prevent premature termination of instances that are still initializing.
- Firewall rules for health checks — Documentation detailing the specific IP ranges used by Google Cloud probe systems and how to configure firewall rules to allow them.
- Cloud Build Configuration Overview — Documentation describing the schema for the Cloud Build configuration file, specifically the 'timeout' field and its default behavior.
- Private pools overview — Explains what private pools are and their use cases, including accessing resources in a private network.
- Private pools overview — Provides specific instructions on how to configure private pools to access resources in a VPC or on-premises network.
Book TOC · Previous · Chapter 4 of 6 · Next
AwesomeGCP.com Learning
The approach taken is a question-led learning approach: you explore realistic project scenarios where you need to make decisions or take actions to achieve business goals within specific constraints. Instead of passive learning, you are challenged to think and work through the options to master the Professional Cloud DevOps Engineer (PDOE) certification!