Book TOC · Previous · Chapter 6 of 8 · Next
Chapter 6: Network Operations: Flow Logs, Packet Troubleshooting & Network Intelligence Center
Chapter Focus: VPC Flow Logs sampling/filtering, Firewall Rules Logging, Cloud NAT logging, BGP/VPN/MTU troubleshooting, Network Topology, Connectivity Tests, Performance Dashboard, and Firewall Insights.
Subsection 5.1: Logging and monitoring with Google Cloud Observability
The Big Picture
In traditional data centers, network engineers rely on SNMP polling, NetFlow appliances, and SPAN ports wired to central syslog servers. When migrating to Google Cloud's Andromeda software-defined networking (SDN) fabric, two catastrophic observability failure modes occur in production: Telemetry Blindness (leaving high-value data-plane logs like VPC Flow Logs, Firewall Rules Logging, Cloud DNS Query Logging, and Cloud NAT Error Logging disabled by default until an outage or breach happens) and Observability Bill Shock (enabling 100% sampling with full metadata on every high-throughput subnet and firewall rule, generating terabytes of redundant Cloud Logging ingestion at $0.50/GiB).
In Google Cloud architectures, Section 5.1 tests your mastery of the architectural separation between Cloud Logging (discrete event-driven and sampled flow records for forensics, audit, and packet-level root cause analysis) and Cloud Monitoring (aggregated time-series metrics for proactive alerting on physical optical light levels, BGP session state, Cloud NAT port exhaustion, and Load Balancer backend 5xx spikes). You must know exactly which telemetry stream captures which networking layer, how to tune sampling rates, aggregation intervals, and metadata filters to balance cost against fidelity, and how to route high-volume logs through Log Router Sinks to BigQuery or Cloud Storage.
Consideration 5.1a: Enabling and reviewing logging for networking components
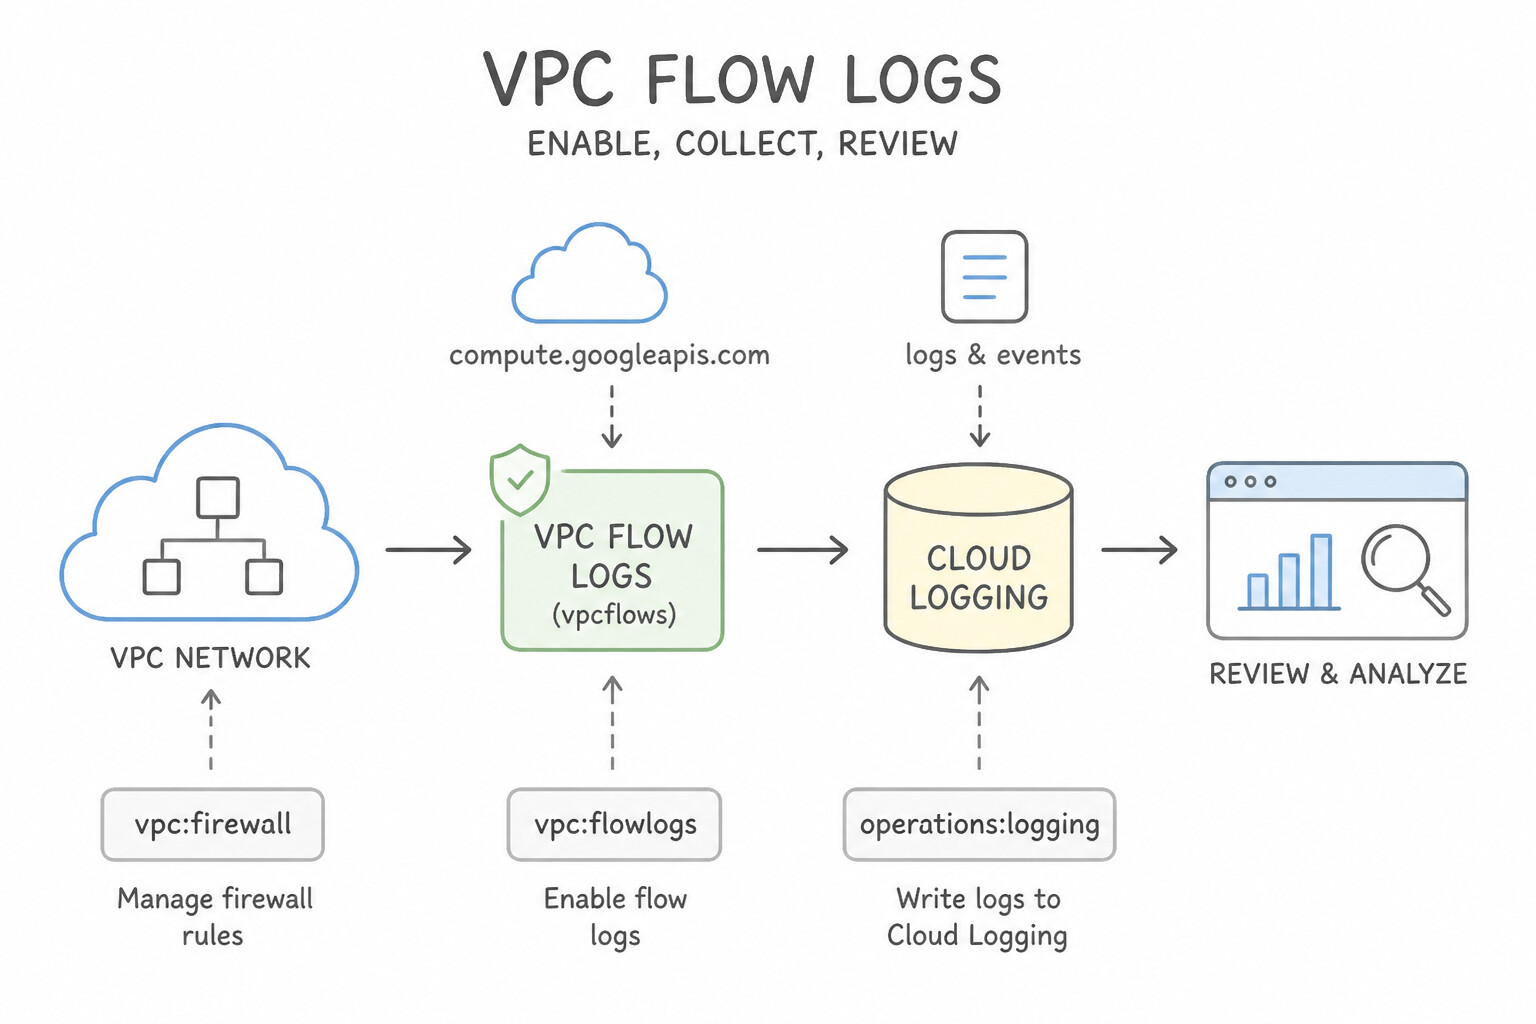
When designing or troubleshooting network logging pipelines In Google Cloud architectures, master these component-specific rules and cost optimizations:
- VPC Flow Logs (
compute.googleapis.com/vpc_flows): - Enabled per subnet (or for whole VPCs via Network Management VPC Flow Logs configurations supporting Organizational/VPC/Subnet scopes). Flow logs capture TCP, UDP, ICMP, ESP, and GRE flows at the VM's virtual NIC (vNIC).
- Tuning Cost & Volume: Adjust Aggregation Interval (
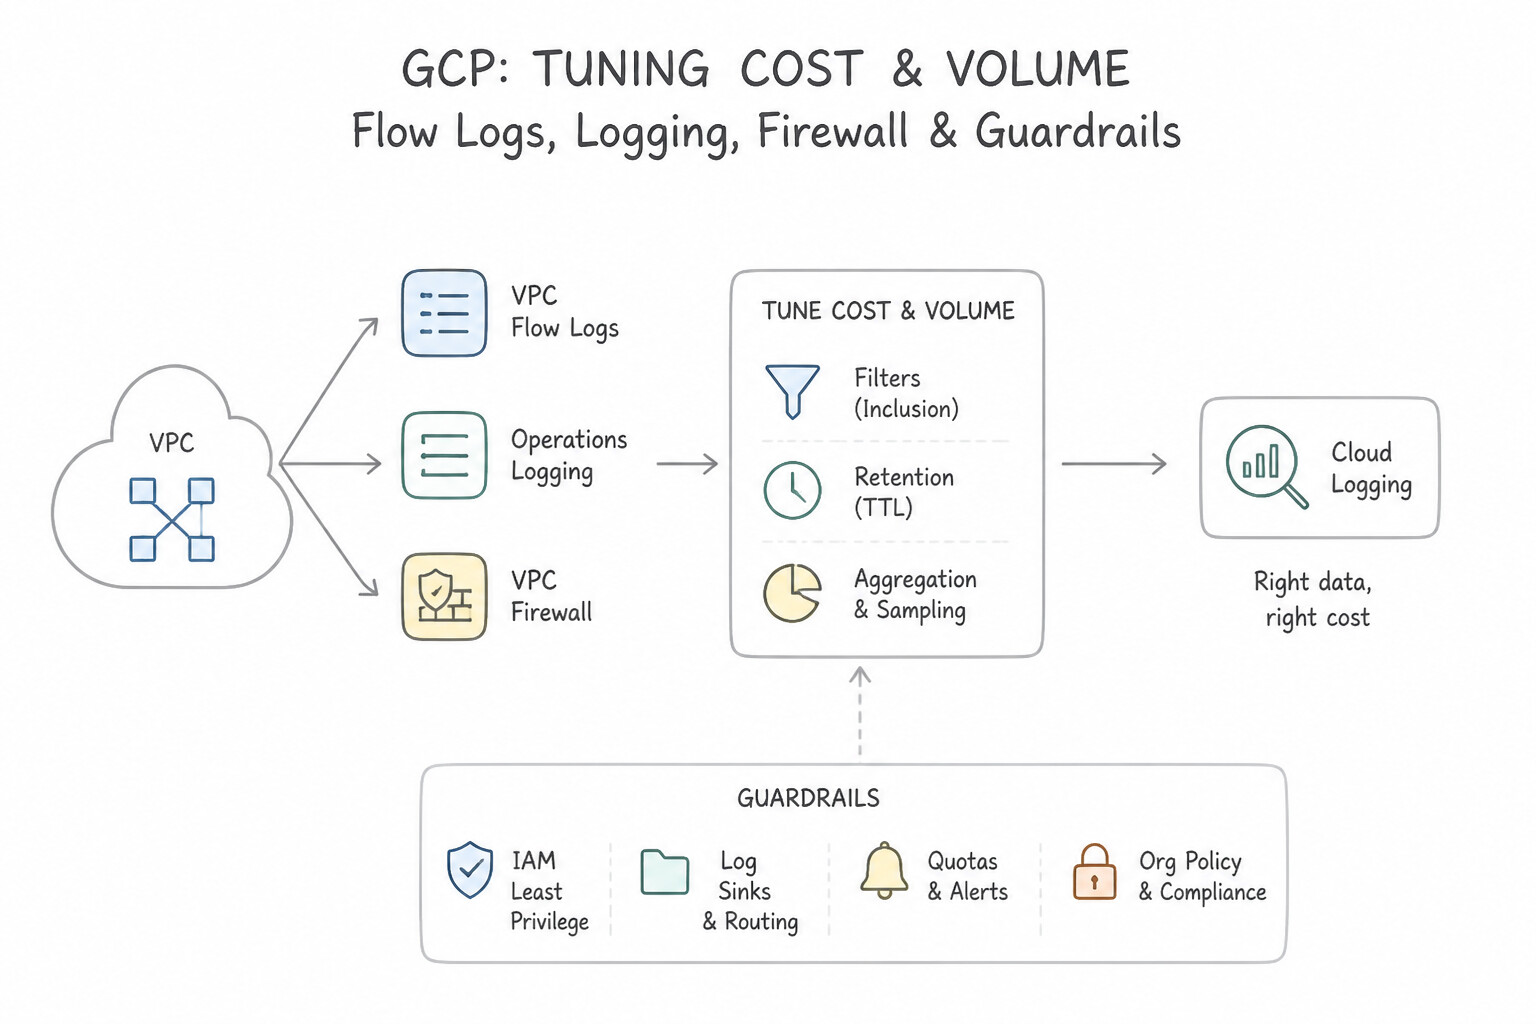
5 secdefault up to15 min), Sample Rate (0.5/ 50% default, tunable from0.0to1.0), Metadata Annotations (include-all-metadata,exclude-all-metadata, or custom fields likesrc_gke_details), and Log Filtering (CEL expressions such ashas(dest_vpc.vpc_name)or filtering only cross-zone traffic before ingestion into Cloud Logging). - Firewall Rules Logging (
compute.googleapis.com/firewall): - Configured individually on each VPC firewall rule or Cloud NGFW policy rule (never globally in a single toggle without per-rule enablement). It logs every single new TCP/UDP connection (or periodic ICMP/UDP packets) that matches that specific rule—there is no sampling slider on Firewall Rules Logging.
- Cost Control Flag: To slash ingestion volume by ~40% on high-connection rules while keeping the 5-tuple (
src_ip,dest_ip,src_port,dest_port,protocol), set--logging-metadata=exclude-all-metadata.Note that impliedallow-egressanddeny-ingressrules cannot have logging enabled directly; you must create an explicit low-priority (65534) mirror rule with logging enabled to capture default drops/allows. - Cloud NAT Logging (
compute.googleapis.com/nat_flows): - Supports three modes:
ERRORS_ONLY(logs onlyOUT_OF_RESOURCESport allocation failures and connection drops—recommended for production to minimize cost while catching port exhaustion),TRANSLATIONS_ONLY(logs every NAT IP/port allocation), andALL(both translations and errors). - Hybrid, Edge, DNS, and VPC-SC Audit Logs:
- Cloud VPN & Cloud Router (
vpn_gateway,cloud_router_Logs): Always enabled automatically! Queryresource.type="vpn_gateway"to diagnose IKE Phase 1/Phase 2NO_PROPOSAL_chosenor pre-shared key mismatches, andresource.type="gce_router"for BGP notification codes, session flaps, and BFD state changes. - Cloud DNS Query Logging (
dns_query): Enabled per VPC network via a Cloud DNS Server Policy (--enable-logging) for private/outbound queries, or on individual Public Managed Zones. Captures client source IP, queried FQDN, record type, RCODE (NXDOMAIN,SERVFAIL), and response latency. - VPC Service Controls (
cloudaudit.googleapis.com/policy): Denied perimeter crossings appear in Admin Activity / Policy Denied Audit Logs with avpcServiceControlsUniqueId. Feed this ID into the VPC-SC Troubleshooter to generate the exact ingress/egress rule attributes (identityType,serviceName,methodName,resource) needed to remediate the block. - Log Router Sinks & Exclusion Filters: Use Log Router inclusion filters to export high-volume VPC Flow Logs or L7 Load Balancer logs directly to BigQuery (for SQL analytics) or Cloud Storage (for multi-year compliance retention) while applying an Exclusion Filter on the
_Defaultlog bucket to avoid paying Cloud Logging ingestion fees.
Key Implementation Patterns
- Optimizing VPC Flow Logs for Cost: Use Decrease the sampling rate and increase the aggregation interval to 15 minutes in the VPC Flow Logs configuration. Lowering the sampling rate and increasing the aggregation interval reduces log volume and costs. (Avoid alternative: Packet Mirroring captures full traffic payloads and is more expensive than Flow Logs.)
- Troubleshooting Firewall Denials: Use Edit the identified firewall rule and enable logging. Attempt the connection, and check for entries in Cloud Logging. Firewall Rule Logging is configured individually per rule; enabling it allows you to see exactly when that specific rule blocks or allows traffic.
- Diagnosing HTTP Load Balancer Latency: Use Inspect the backend_latency field to see if the time spent waiting for the backend response is high. High backend_latency values indicate the load balancer is waiting a long time for the application server to respond. (Avoid alternative: Response size correlates with transfer time but does not measure how long the backend took to generate the response.)
Key Takeaways (5.1a)
- VPC Flow Logs volume directly impacts Cloud Logging costs.
- Use the Sampling Rate to control how many packets are analyzed.
- Use the Aggregation Interval to control how frequently logs are written and summarized.
- Aggregating logs over a longer interval reduces the number of records without necessarily losing traffic trend data.
Consideration 5.1b: Monitoring networking metrics
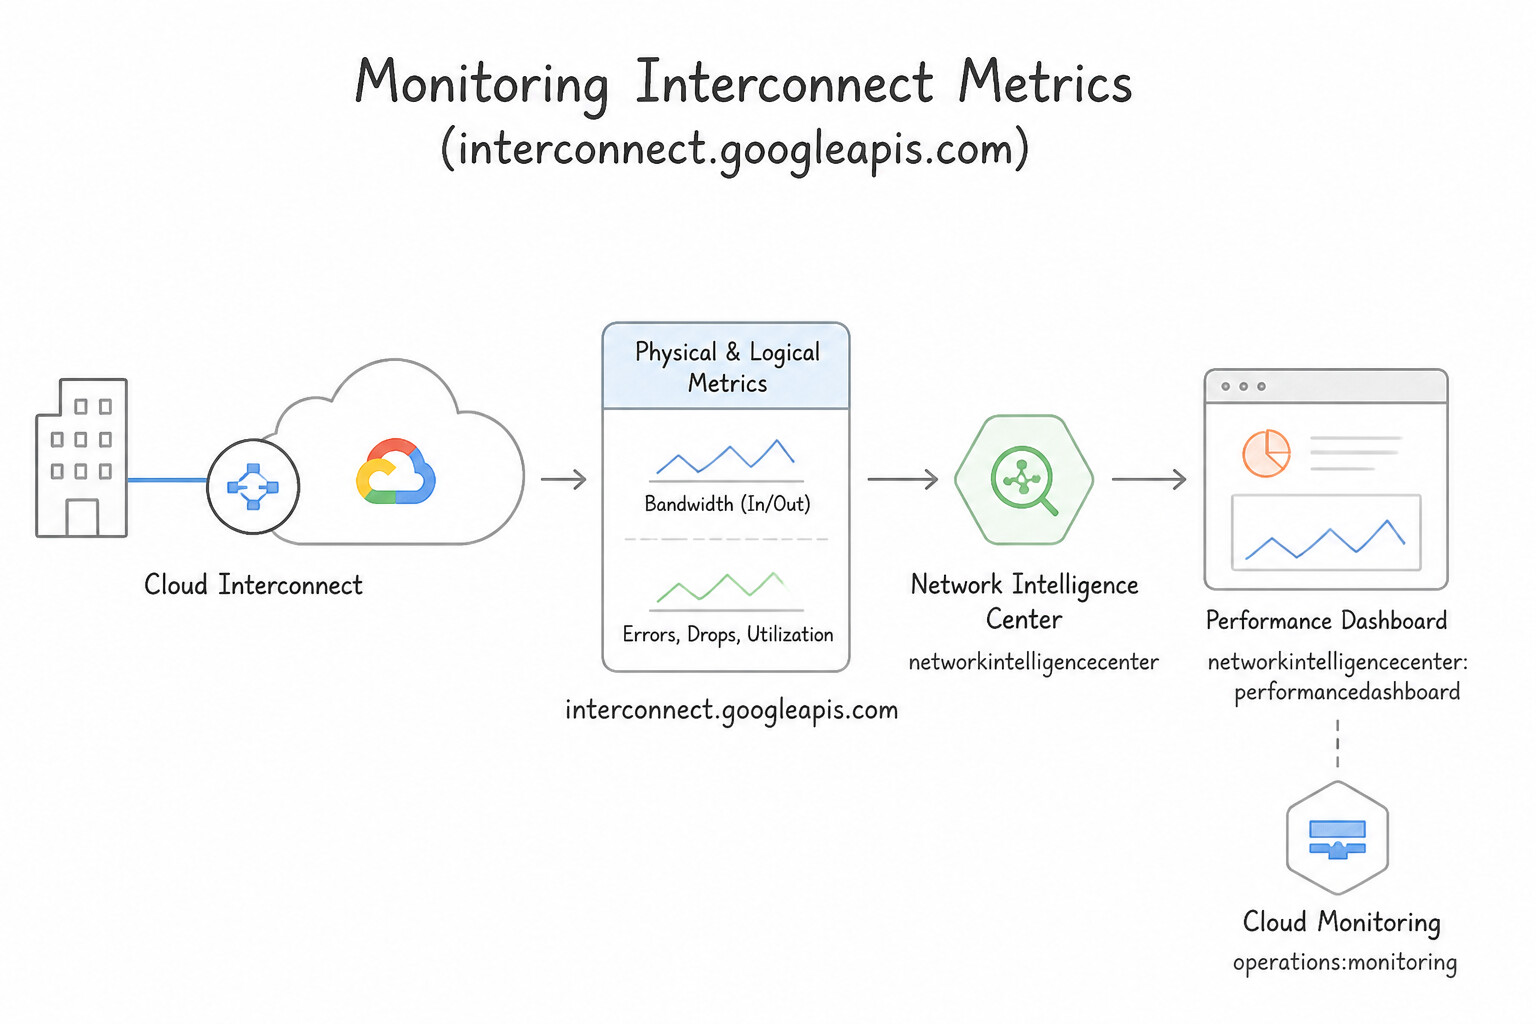
Cloud Monitoring provides zero-cost, 60-second granularity networking telemetry across compute.googleapis.com, interconnect.googleapis.com, vpn.googleapis.com, router.googleapis.com, and loadbalancing.googleapis.com:
- Cloud Interconnect Physical & Logical Metrics (
interconnect.googleapis.com): - Physical Interconnect (
network/interconnect): Monitoroperational_status(link up/down),rx_optical_powerandtx_optical_power(measured in dBm—vital for diagnosing dirty fiber patch cords, failing transceivers, or Telco cross-connect attenuation before total link loss), and LACP member link errors (receive_errors_count). - VLAN Attachment (
network/attachment): Monitorattachment/capacityvsattachment/received_bytes_count/sent_bytes_countto detect bandwidth saturation, andattachment/dropped_packets_count(with reason labels such as rate-limiting when burst traffic exceeds a 1 Gbps or 5 Gbps attachment policer). - Cloud VPN & Cloud Router Metrics (
vpn.googleapis.com&router.googleapis.com): - Cloud VPN: Alert on
tunnel_established(boolean gauge:1= UP,0= DOWN) andnetwork/dropped_received_packets_count/sent_bytes_count(watch for approaching the ~3 Gbps / 250,000 PPS per-tunnel ceiling). - Cloud Router: Alert on
bgp/session_up,bgp/received_routes_count(critical for catching an on-premises engineer accidentally leaking a full BGP table or exceeding the MED/learned route quota of 100 default / 5,000 custom learned routes), andbgp/sent_routes_count. - Cloud NAT Metrics (
compute.googleapis.com/nat): - Monitor
port_usage/allocated_ports,nat_allocation_failed(boolean/counter indicating VMs cannot allocate a new port tuple becausemax-ports-per-vmor available NAT IPs are exhausted),dropped_sent_packets_count(categorized byreason:OUT_OF_RESOURCES), andopen_connections. - Cloud Load Balancing & Cloud Armor Metrics (
loadbalancing.googleapis.com): - Frontend vs. Backend Latency Isolation: Compare
https/backend_latencies(time from Google Envoy proxy to your backend VM/NEG and back) againsthttps/total_latencies(time from client request arrival at the Google Edge GFE to response completion) andhttps/frontend_tcp_rtt(client-to-GFE network RTT). Iftotal_latenciesspikes whilebackend_latenciesstays flat, the bottleneck is client last-mile connectivity or a suboptimal Load Balancer Network Tier—not your backend VMs! - HTTP Error Codes & Cloud Armor: Alert on
response_code_class="500"(502 Bad Gatewayindicates failed health checks/crashed backend sockets;504 Gateway Timeoutindicates backend processing exceeded the Backend Service timeout) and monitor matched Cloud Armor security policy names/priorities.
Key Implementation Patterns
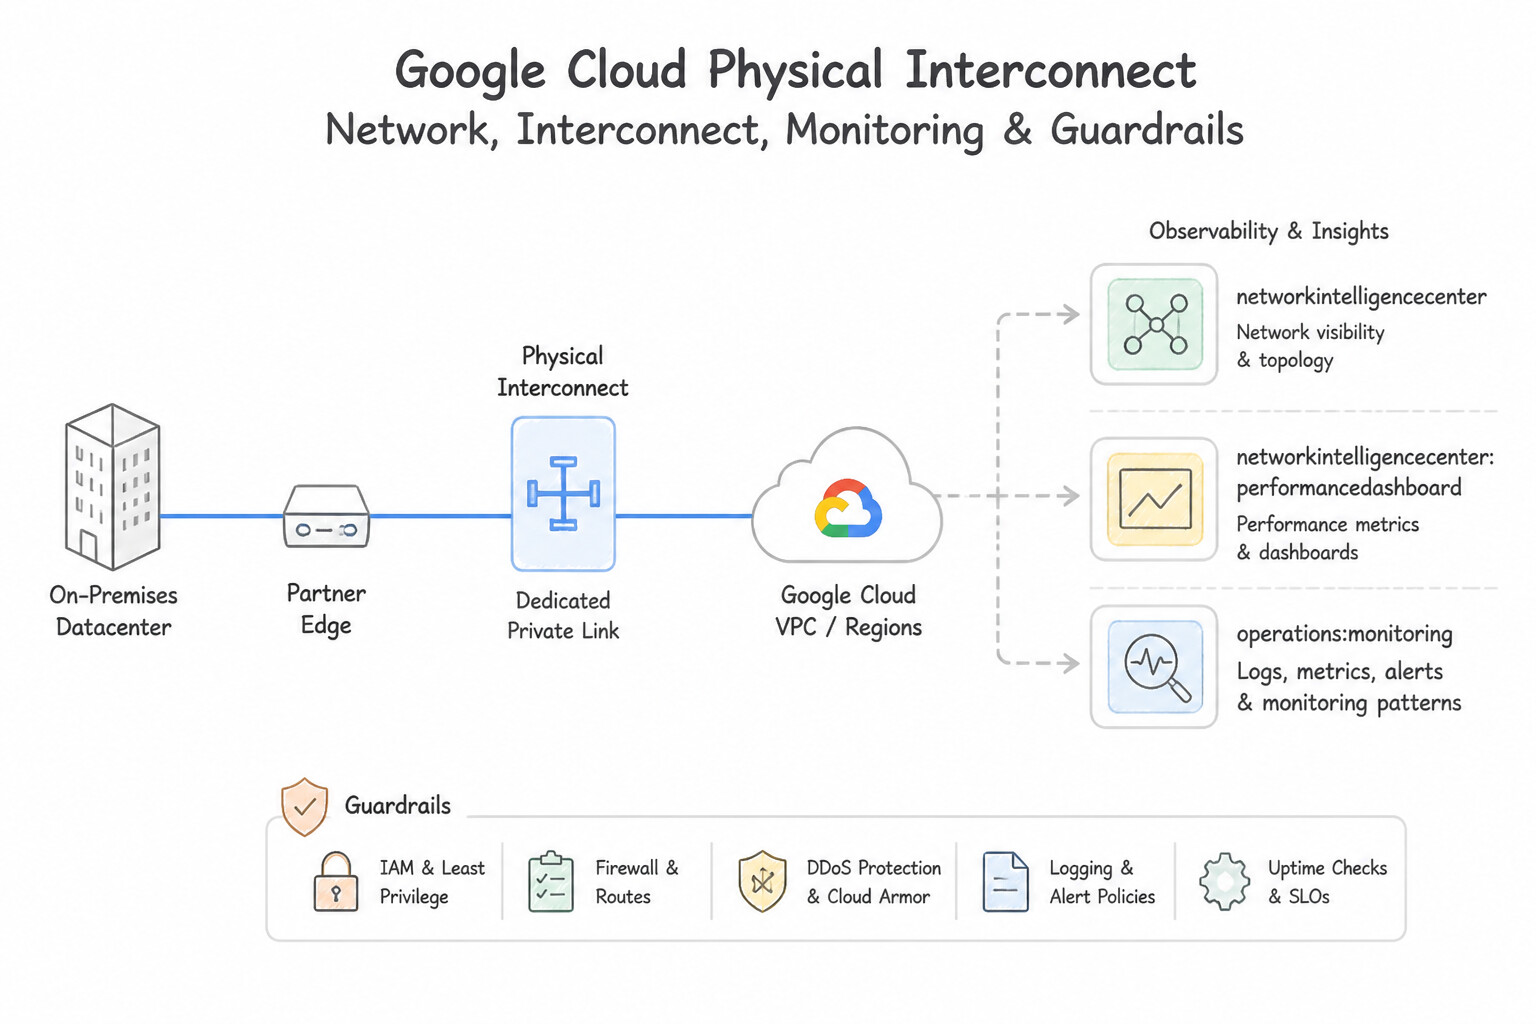
- Diagnosing Inter-Zone Latency: Use Use the Performance Dashboard in Network Intelligence Center to view packet loss and latency between the zones. The Performance Dashboard specifically monitors network latency and packet loss between Google Cloud zones and regions. (Avoid alternative: CPU metrics measure compute load, not network latency between zones.)
- Load Balancer Latency Segmentation: Use Compare the https/frontend_tcp_rtt metric with the https/backend_latencies metric. Frontend_tcp_rtt measures client-side network delay, while backend_latencies measures server-side processing time. (Avoid alternative: VPC Flow Logs analyze internal VPC traffic flows, not the latency breakdown of external client connections to a global load balancer.)
Key Takeaways (5.1b)
- The Performance Dashboard monitors packet loss and latency across the Google Cloud network.
- Connectivity Tests verify reachability and configuration (firewalls/routes).
- VPC Flow Logs track traffic volume and connection metadata, not latency.
- Distinguish between compute issues (CPU/RAM) and network infrastructure issues (latency/loss).
Quick Decision Cheat Sheet (Subsection 5.1)
If the Scenario Requires... | Choose This Google Cloud Pattern | Avoid This Common Mistake |
|---|---|---|
"High Cloud Logging bill after enabling Firewall Rules Logging across busy web servers" | Set --logging-metadata=exclude-all-metadata on the firewall rules and disable logging on non-critical allow rules | Reducing the "Firewall Rules Logging sampling rate" (Firewall Rules Logging has no sampling rate—it logs 100% of matching connections) |
"High Cloud Logging bill from VPC Flow Logs, but security needs only cross-zone or specific CIDR flows" | Configure a VPC Flow Logs filter expression (e.g., src_location.zone != dest_location.zone), lower the sampling rate, and increase the aggregation interval (5 min / 15 min) | Deploying third-party NetFlow agents on every VM |
"Troubleshoot why an API call to BigQuery or Cloud Storage was blocked with PERMISSION_DENIED by VPC Service Controls" | Inspect Cloud Audit Logs ( cloudaudit.googleapis.com/policy) for the vpcServiceControlsUniqueId and run the VPC-SC Troubleshooter | Checking VPC Firewall Rules Logging or VPC Flow Logs (VPC-SC operates at the Google API control/service plane, not the VPC packet firewall plane) |
"Identify which specific VMs are failing to open outbound internet connections through Cloud NAT" | Enable Cloud NAT Logging with ERRORS_ONLY and inspect allocation_status="DROPPED" in nat_flows logs | Using Cloud Monitoring nat_allocation_failed alone when per-connection destination IP/port details are required (Monitoring aggregates at the VM/gateway level, whereas NAT Error Logs show the exact dropped 5-tuple) |
"Audit every internal and external DNS hostname resolved by Compute Engine VMs in a VPC" | Attach a Cloud DNS Policy with enableInboundForwarding / enableLogging (--enable-logging) to the VPC | Running Packet Mirroring on port 53 to 169.254.169.254 |
"Monitor Dedicated Interconnect VLAN attachment throttling / policer drops" | Alert on interconnect.googleapis.com/network/attachment/dropped_packets_count in Cloud Monitoring | Checking only physical port operational_status (physical 10G/100G port can be healthy while a 1 Gbps VLAN attachment is dropping burst packets) |
"Alert before a partner BGP router exceeds Google Cloud Router's learned route quota" | Alert on router.googleapis.com/bgp/received_routes_count approaching the quota limit | Inspecting VPC Flow Logs for BGP TCP port 179 |
Further Reading (Subsection 5.1)
- Using VPC Flow Logs — Documentation on how to configure sampling rates and aggregation intervals for VPC Flow Logs.
- Using Firewall Rules Logging — This page explains how to enable and disable logging for firewall rules and how to view the generated logs.
- External HTTP(S) Load Balancing logging and monitoring — Documentation describing log fields including backend_latency and frontend_rtt.
- Performance Dashboard overview — Provides details on how the Performance Dashboard offers visibility into packet loss and latency between zones.
- Global external Application Load Balancer logging and monitoring — Refer to the 'Metric details' section to understand frontend_tcp_rtt and backend_latencies definitions.
Subsection 5.2: Maintaining and troubleshooting connectivity issues
The Big Picture
When a production hybrid link flaps, an Application Load Balancer drops in-flight checkout requests during a deployment, or east-west packets vanish between two subnets, guesswork wastes precious MTTR minutes. In Google Cloud, every packet traverses a strict, deterministic pipeline inside the Andromeda virtual switch and hybrid edge routers. If you do not know the exact sequence in which VPC Firewall Rules, VPC Flow Logs, Packet Mirroring, MTU/MSS clamping, and BGP dynamic routing modes operate, you will misdiagnose the root cause.
For example, A critical traps in production is the vNIC Telemetry Order of Operations: on Ingress, VPC Firewall Rules are evaluated before VPC Flow Logs; therefore, if an ingress firewall rule drops a SYN packet, VPC Flow Logs will show zero records of that packet ever arriving! Conversely, on Egress, VPC Flow Logs are recorded before Egress Firewall Rules; so an egress packet dropped by a firewall rule will still appear in VPC Flow Logs! Section 5.2 tests your mastery of zero-downtime load balancer draining (5.2a), Cloud VPN IKE/MTU troubleshooting (5.2b), Cloud Interconnect physical/VLAN diagnostics (5.2c), Cloud Router BGP peering/BFD mechanics (5.2d), and vNIC-level flow vs firewall vs packet mirroring forensics (5.2e).
Consideration 5.2a: Managing load balancer traffic draining
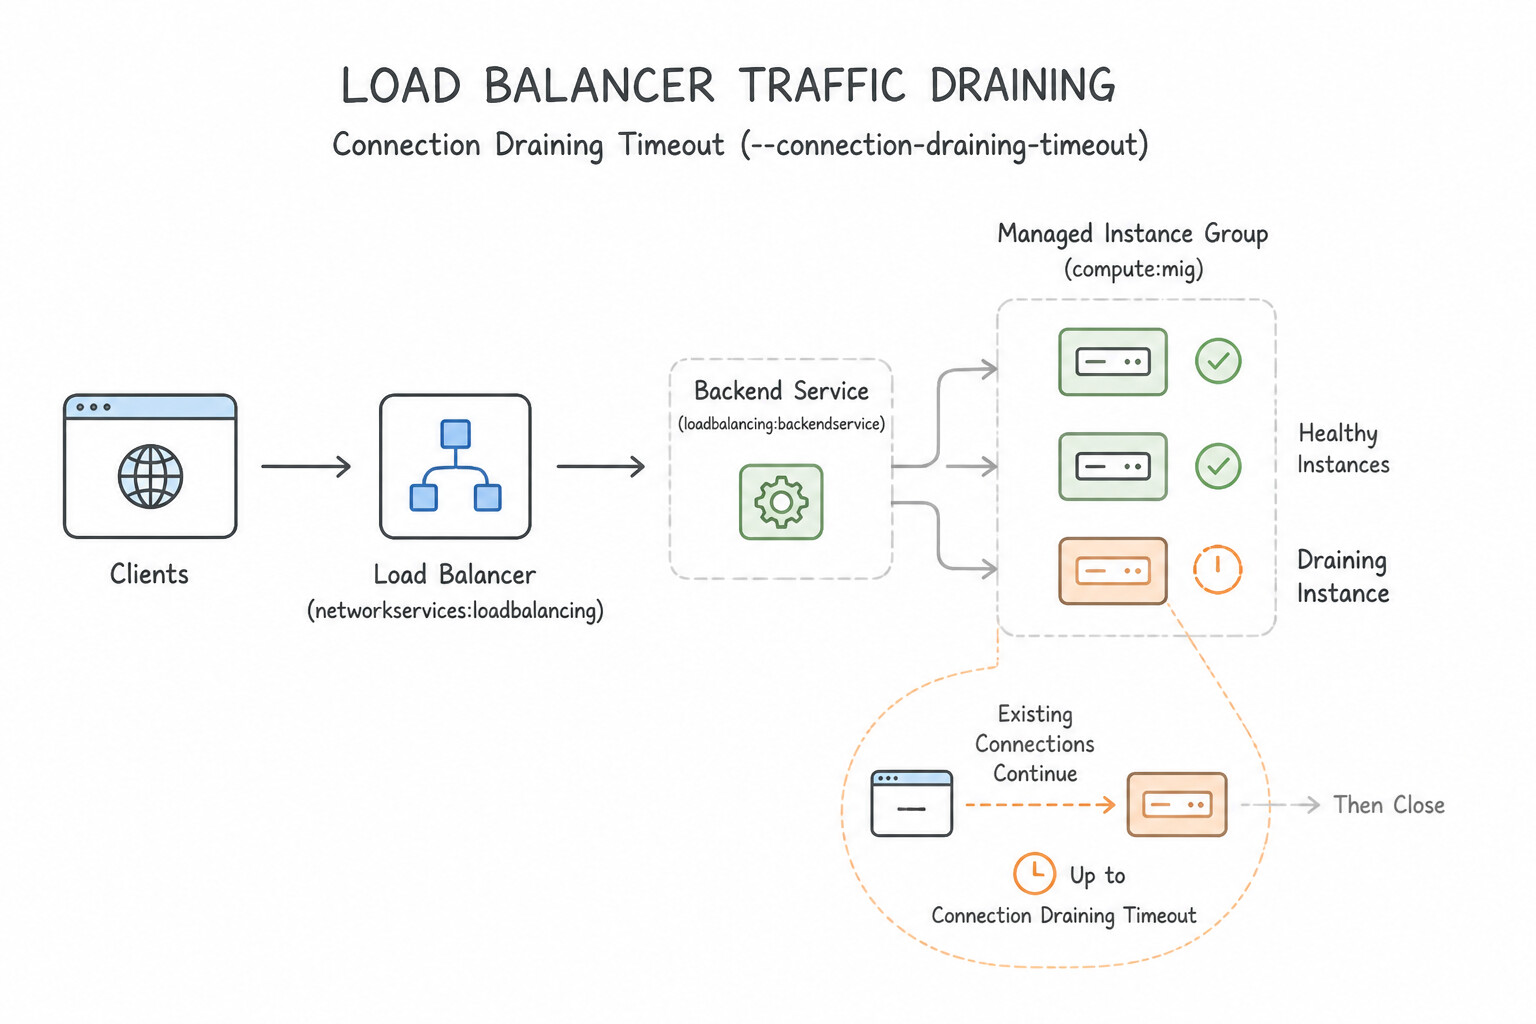
To evacuate traffic from a region, zone, or Managed Instance Group (MIG) during maintenance or blue/green releases without dropping active user sessions (HTTP 502 resets):
- Connection Draining Timeout (
--connection-draining-timeout): - Configured on the Backend Service (range:
0to3600seconds; default is300son some LBs or0sif unset). When a VM or endpoint is removed from a MIG (during scale-in, rolling update, or manual deletion), the Load Balancer stops sending new requests to that VM immediately, while allowing existing in-flight HTTP/WebSocket connections up to the draining timeout to finish gracefully before the VM is terminated. - Evacuating a Entire Backend MIG Without Deleting Infrastructure (
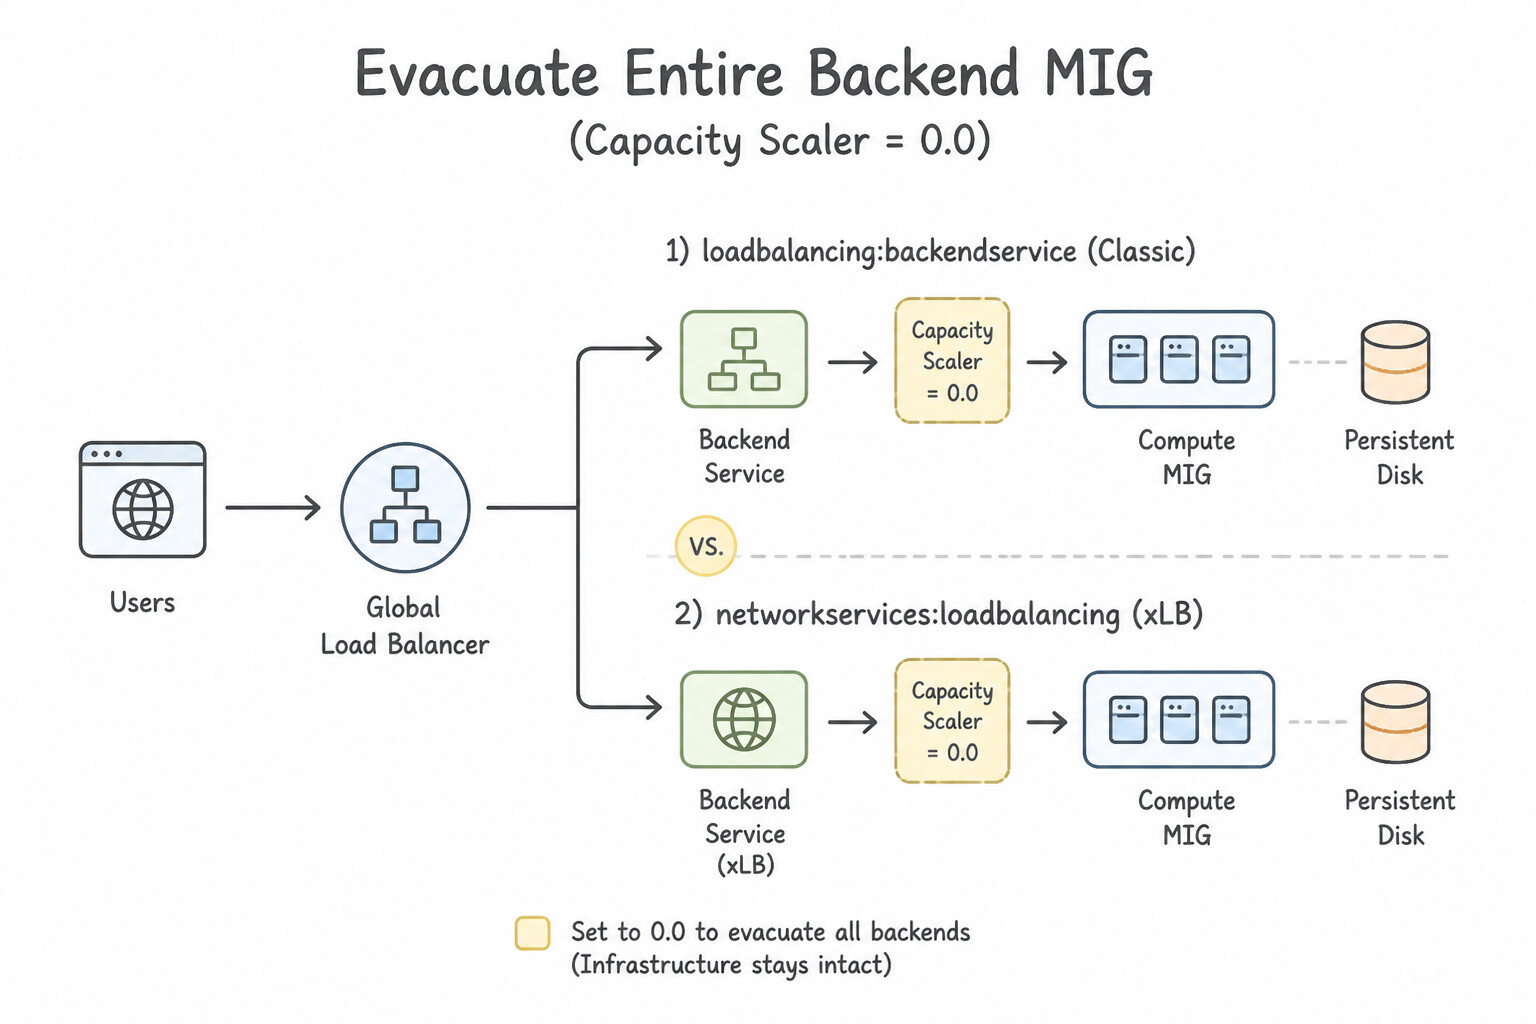
Capacity Scaler = 0.0): - If a regional database fails or you need to drain 100% of traffic away from
us-central1tous-east1on a Global External Application Load Balancer while keeping theus-central1MIG running for diagnostics, set--capacity-scaler=0.0on theus-central1backend in the Backend Service (gcloud compute backend-services update-backend ... --capacity-scaler=0). This triggers Connection Draining for existing requests and shifts all new traffic to healthy regions with remaining capacity. - Canary Rollouts & URL Map Redirects (Envoy Traffic Management):
- On Global External Application Load Balancers (
EXTERNAL_MANAGED), Regional External Application Load Balancers, and Cross-Region/Regional Internal Application Load Balancers, use advancedrouteRulesin the URL Map withweightedBackendServices(e.g., 95% tov1-backend-service, 5% tov2-backend-service) for canary validation,requestMirrorPolicyto shadow live production traffic to a test backend without returning its responses to clients, orurlRedirect(301/302/307/308HTTP status codes) to migrate legacy domains/paths cleanly.
Key Implementation Patterns
- Optimizing Connection Draining for Long-Running Reports: Use Increase the connection draining timeout on the backend service to greater than 900 seconds. The process takes 15 minutes, but the default connection draining timeout is only 5 minutes. You must increase the timeout on the backend service to allow the process to finish.
- Isolating a Problematic Instance for Forensics: Use Run the abandon-instances command specifying the name of the VM. Abandoning an instance removes it from the group logic but keeps the VM running for analysis and triggers connection draining. (Avoid alternative: Deleting the instance destroys the VM, making forensic analysis impossible.)
- Troubleshooting Websocket Disconnections: Use Enable connection draining on the backend service and set the timeout to cover the longest expected chat session. Connection draining allows existing active connections to persist for a specific timeout when an instance is removed from the group.
Key Takeaways (5.2a)
- Connection Draining allows existing requests to complete when an instance is removed from a group.
- The default draining timeout is 300 seconds (5 minutes).
- If your application processes take longer than 5 minutes, you must increase the timeout on the Backend Service.
- Draining applies during autoscaling down events, rolling updates, and manual instance deletion.
Consideration 5.2b: Troubleshooting VPN
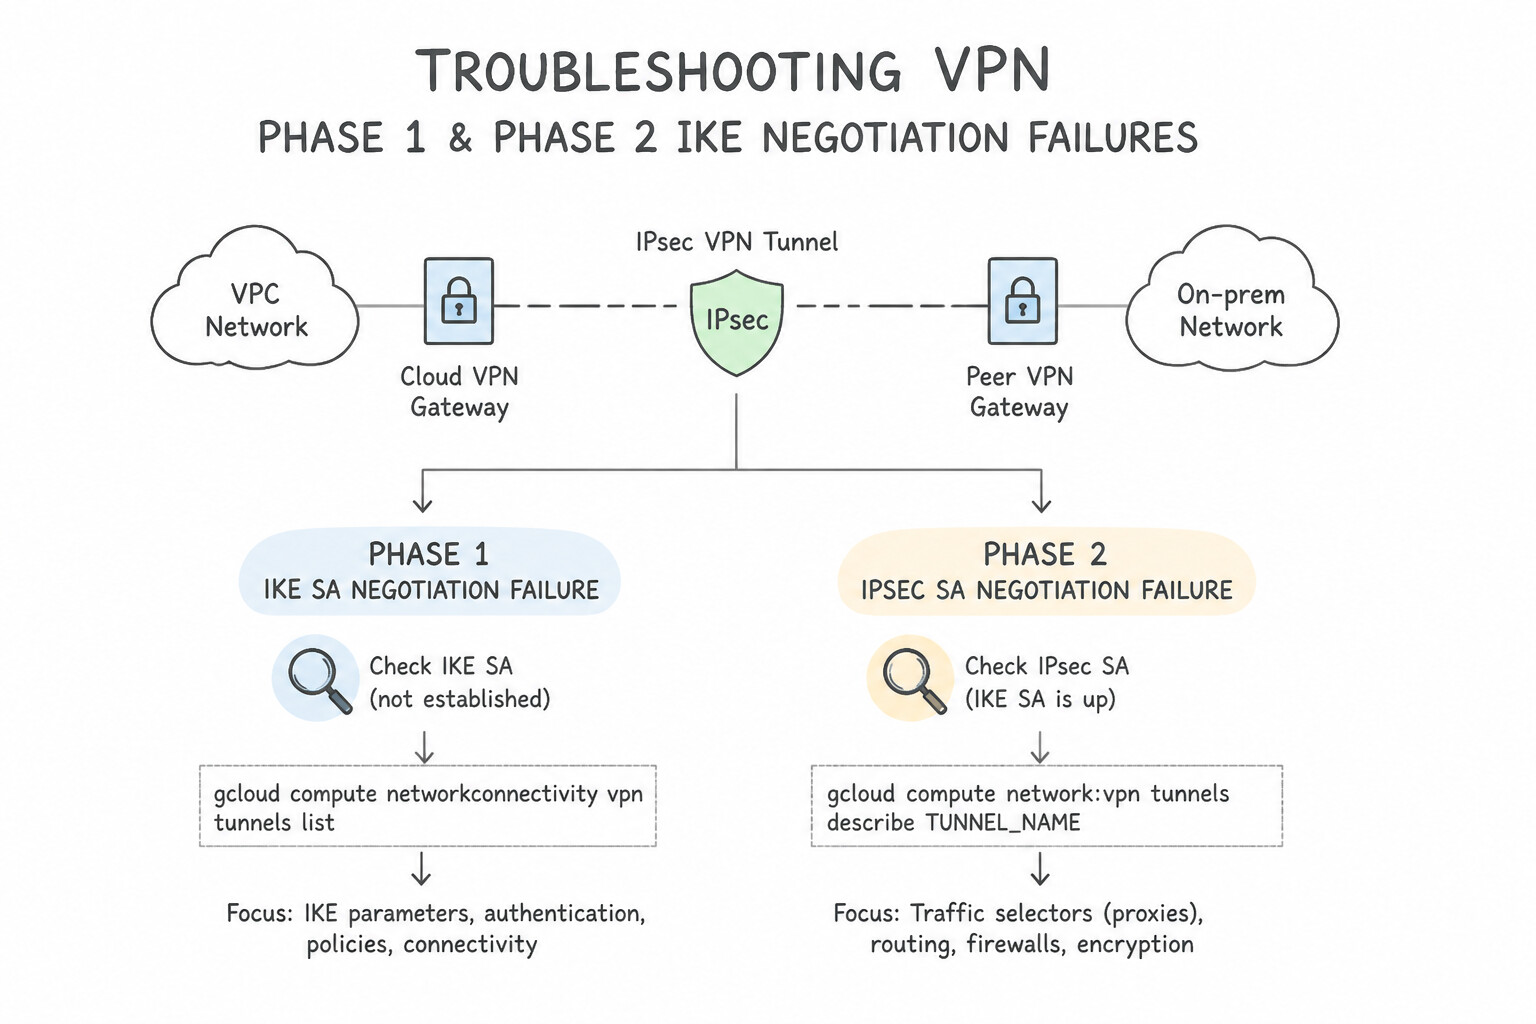
When a Cloud VPN tunnel refuses to come up (tunnel_established = 0) or drops large TCP payloads while small ping packets succeed, walk this systematic checklist:
- Phase 1 & Phase 2 IKE Negotiation Failures:
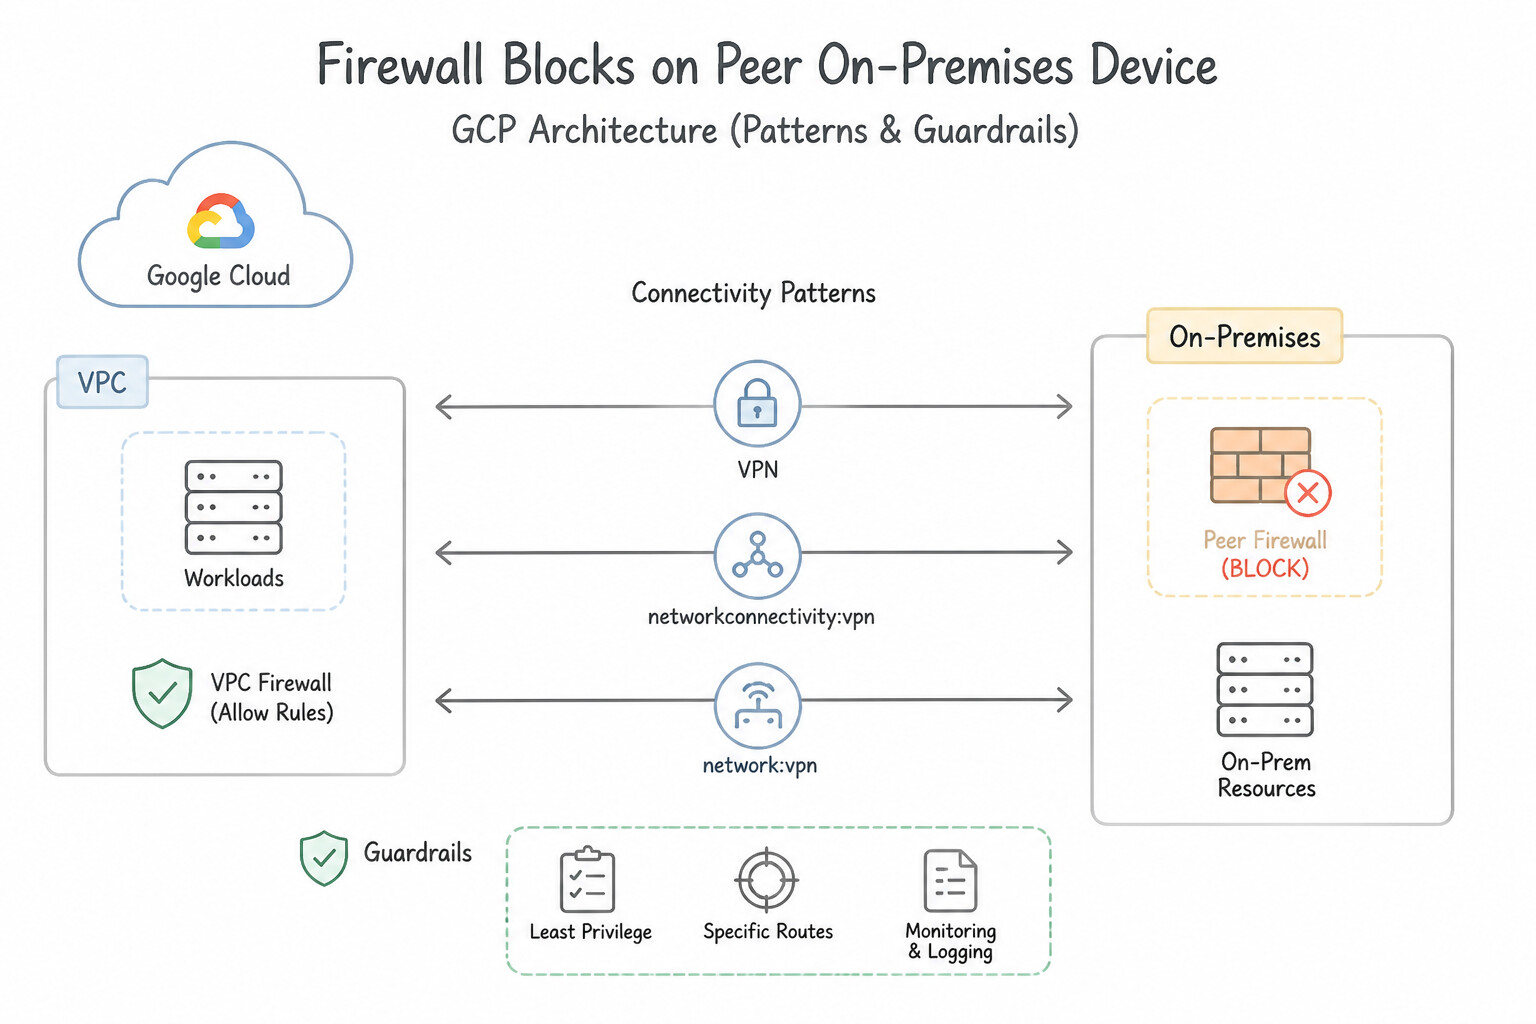
- Firewall Blocks on Peer On-Premises Device: Ensure the on-premises perimeter firewall permits UDP port 500 (IKE), UDP port 4500 (IKE NAT-Traversal—required if the peer VPN gateway sits behind 1:1 NAT, which is only supported with Dynamic / Classic Route-Based where GCP is the responder or HA VPN with supported peer IP mappings), and IP Protocol 50 (
ESP). - Cipher / Proposal / PSK Mismatches: Inspect Cloud Logging (
resource.type="vpn_gateway").AUTHENTICATION_FAILEDindicates a mismatched Pre-Shared Key (PSK) or wrong IKE version (IKEv2 is strongly preferred over IKEv1).NO_PROPOSAL_CHOSENindicates mismatched encryption (AES-CBCvsAES-GCM), integrity (SHA256/SHA512), or Diffie-Hellman (DH) group parameters between Phase 1 or Phase 2 configurations. - Classic VPN Traffic Selector Mismatches (Child SA Splits):
- In Policy-Based Classic VPN, if the on-premises Cisco/Palo Alto device summarizes multiple local/remote CIDRs while Google Cloud specifies a different CIDR list (or if multiple CIDRs are negotiated over IKEv1, which creates separate Child SAs per CIDR pair instead of coalescing them like IKEv2), traffic selectors fail to match. architectures Best Practice: Migrate from Classic VPN to HA VPN (
99.99%SLA) with Cloud Router BGP (which uses0.0.0.0/0traffic selectors and exchanges prefixes dynamically via BGP). - Small Pings Succeed, HTTPS/SSH Hangs (
MTU&TCP MSSBlack Hole): - IPsec ESP encapsulation adds overhead (
~54–78bytes). By default, standard Cloud VPN tunnels support a maximum payload MTU of1460bytes (or up to1500bytes if configured with jumbo/expanded gateway MTU support, while encrypted packets over the internet cannot exceed path MTU). - If a VM with a
1500-byte VPC MTU sends a1500-byte packet with theDF(Don't Fragment) bit set over a1460-byte VPN tunnel, the VPN gateway drops the packet and returns an ICMP Fragmentation Needed (Type 3, Code 4) message. If an overzealous firewall blocks ICMP Type 3 Code 4 (breaking Path MTU Discovery [PMTUD]), large TCP transfers hang silently! Fix this by allowing ICMP Type 3 Code 4, matching VPC/VM MTU to1460bytes, or ensuring TCP MSS clamping (1360–1420bytes) is active on the on-premises VPN gateway.
Key Implementation Patterns
- Diagnosing IKE Handshake Failures: Use Verify that the pre-shared key is identical on both the Cloud VPN gateway and the on-premises gateway. A 'handshake_failure' in Phase 1, despite matching algorithms, typically indicates a mismatched pre-shared key. (Avoid alternative: HA VPN requires IKEv2, so you cannot switch to IKEv1.)
- Firewall Rules for VPN Negotiation: Use Configure the on-premises firewall to allow ingress traffic on UDP port 500 and UDP port 4500. IKE uses UDP port 500 and NAT-Traversal uses UDP port 4500; both must be allowed. (Avoid alternative: VPN negotiation uses UDP, not TCP.)
- BGP Session Stuck in 'Connect' State: Use Verify that the BGP peer IP addresses configured on the Cloud Router match the interface IP addresses on the on-premises router. Since the tunnel is up but BGP is down, the issue is likely a configuration mismatch in the BGP peer IP addresses.
Key Takeaways (5.2b)
- VPN connections establish in two phases: Phase 1 (Auth) and Phase 2 (Tunnel).
- Phase 1 failures are often due to mismatched Pre-shared Keys (Shared Secrets) or mismatched IKE versions.
- HA VPN on Google Cloud requires IKEv2.
- Check logs for 'handshake_failure' to isolate Phase 1 issues.
Consideration 5.2c: Troubleshooting Interconnect
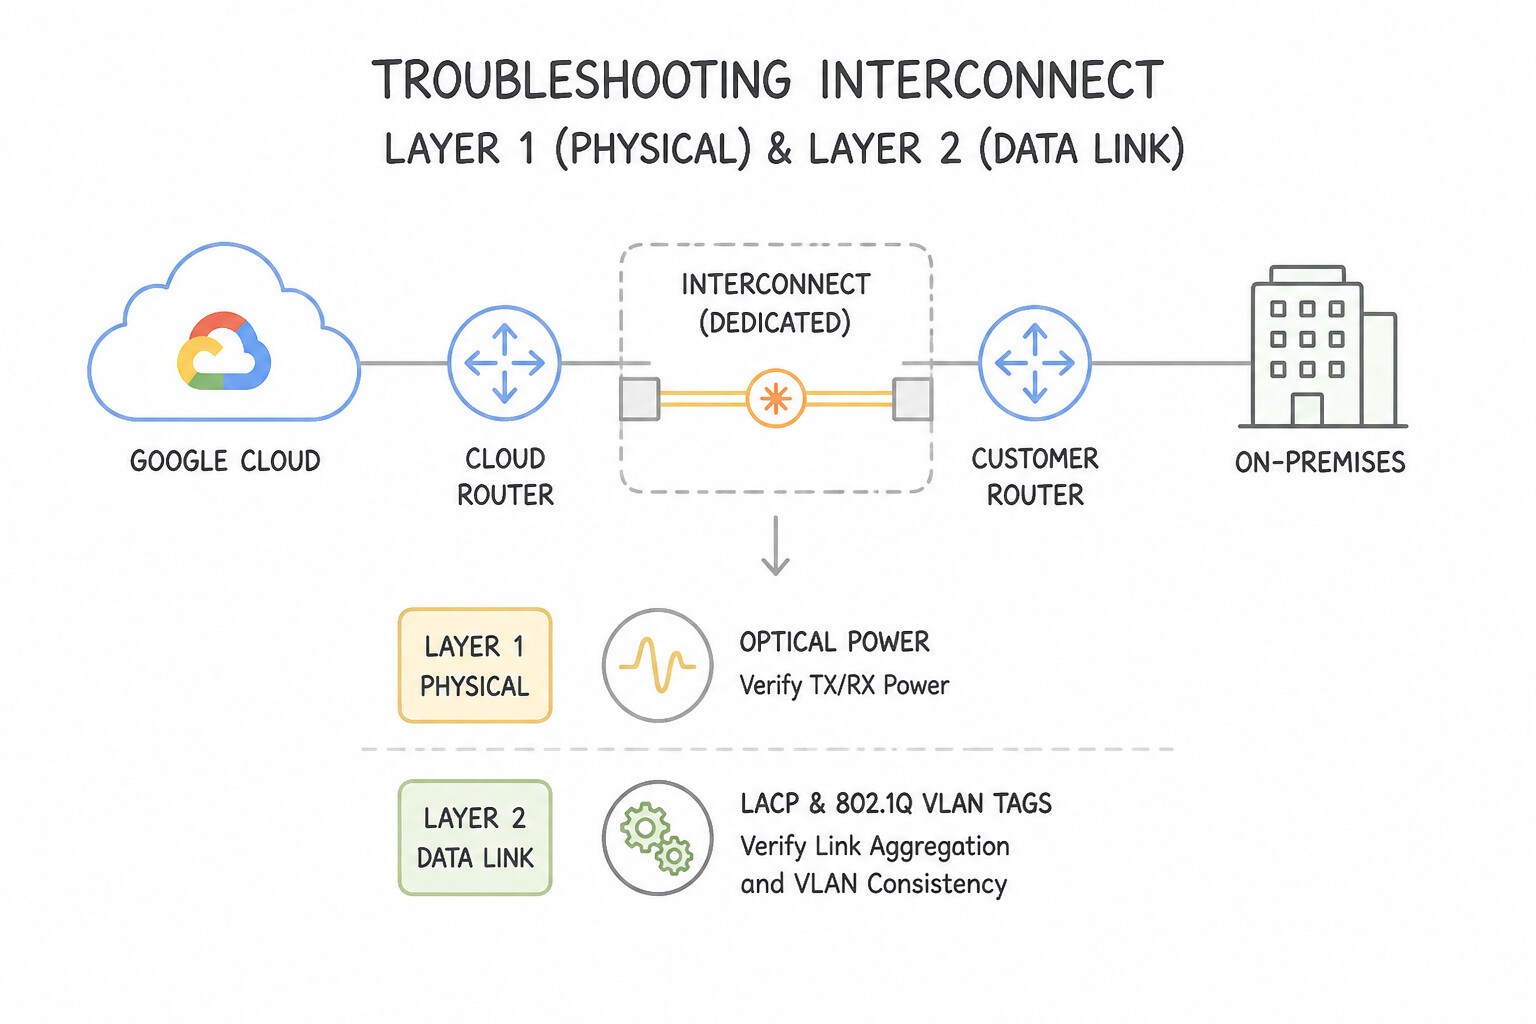
Dedicated and Partner Interconnect troubleshooting spans Layers 1, 2, and 3:
- Layer 1 (Physical Optical Power) & Layer 2 (LACP & 802.1Q VLAN Tags):
- Optical Alarms: If a new Dedicated Interconnect cross-connect stays down, check
rx_optical_powerandtx_optical_powerin Cloud Monitoring. Lowrx_optical_power(<-10to-14dBm depending on 10GBASE-LR vs 100GBASE-LR4 optics) points to a swapped TX/RX fiber pair, dirty patch panel connectors, single-mode vs multi-mode fiber mismatch, or broken cross-connect in the colocation facility. - LACP (
802.3ad) Required: Even a single-link (1 x 10Gor1 x 100G) Dedicated Interconnect connection requires LACP (802.3ad) to be enabled on the customer's on-premises router port! If LACP is disabled on the customer router, the physical port will show optical light (rx_optical_powernormal), but the link bundle (operational_status) will never pass Layer 2 frames. 802.1QVLAN ID Mismatch: If the physical Interconnect and LACP bundle are UP, but ARP/ping to the169.254.x.x/29VLAN attachment link-local IP fails, verify that the on-premises router sub-interface is tagged with the exact802.1QVLAN ID assigned by the Google Cloud VLAN attachment.- Layer 3 MTU Consistency Rule (
1440/1460/1500/8896): - Cloud Interconnect VLAN attachments support MTUs of
1440,1460,1500(recommended standard), or8896(Jumbo Frames). Key Architectural Rule: To achieve end-to-end8896(or1500) MTU across Interconnect, the VPC network MTU, every VLAN attachment connected to that VPC, and the on-premises router interface MTU must all be configured with the exact same MTU value! If one attachment in the VPC is left at1440, the effective MTU can be constrained or cause fragmentation drops. - Asymmetric Routing Drops Across Redundant VLAN Attachments:
- When deploying 2 or 4 redundant VLAN attachments for a
99.9%or99.99%SLA, Google Cloud treats attachments with identical BGP MED (Multi-Exit Discriminator) and AS-Path length as ECMP (Equal-Cost Multi-Path) routes. If traffic exits Google Cloud via Attachment A (Zone 1) and returns from on-premises via Attachment B (Zone 2), a stateful on-premises firewall inspecting only one link will drop the asymmetric return packets! - Fix: Either configure the on-premises stateful firewalls in an active-active state-synced cluster (or disable stateful inspection on trusted internal Interconnect interfaces), OR force Active/Passive symmetric routing by advertising a lower BGP MED (e.g.,
MED 100on Primary Attachment A,MED 200on Backup Attachment B) from on-premises and setting a lower Cloud Router BGP Base Advertised Route Priority on Attachment A.
Key Implementation Patterns
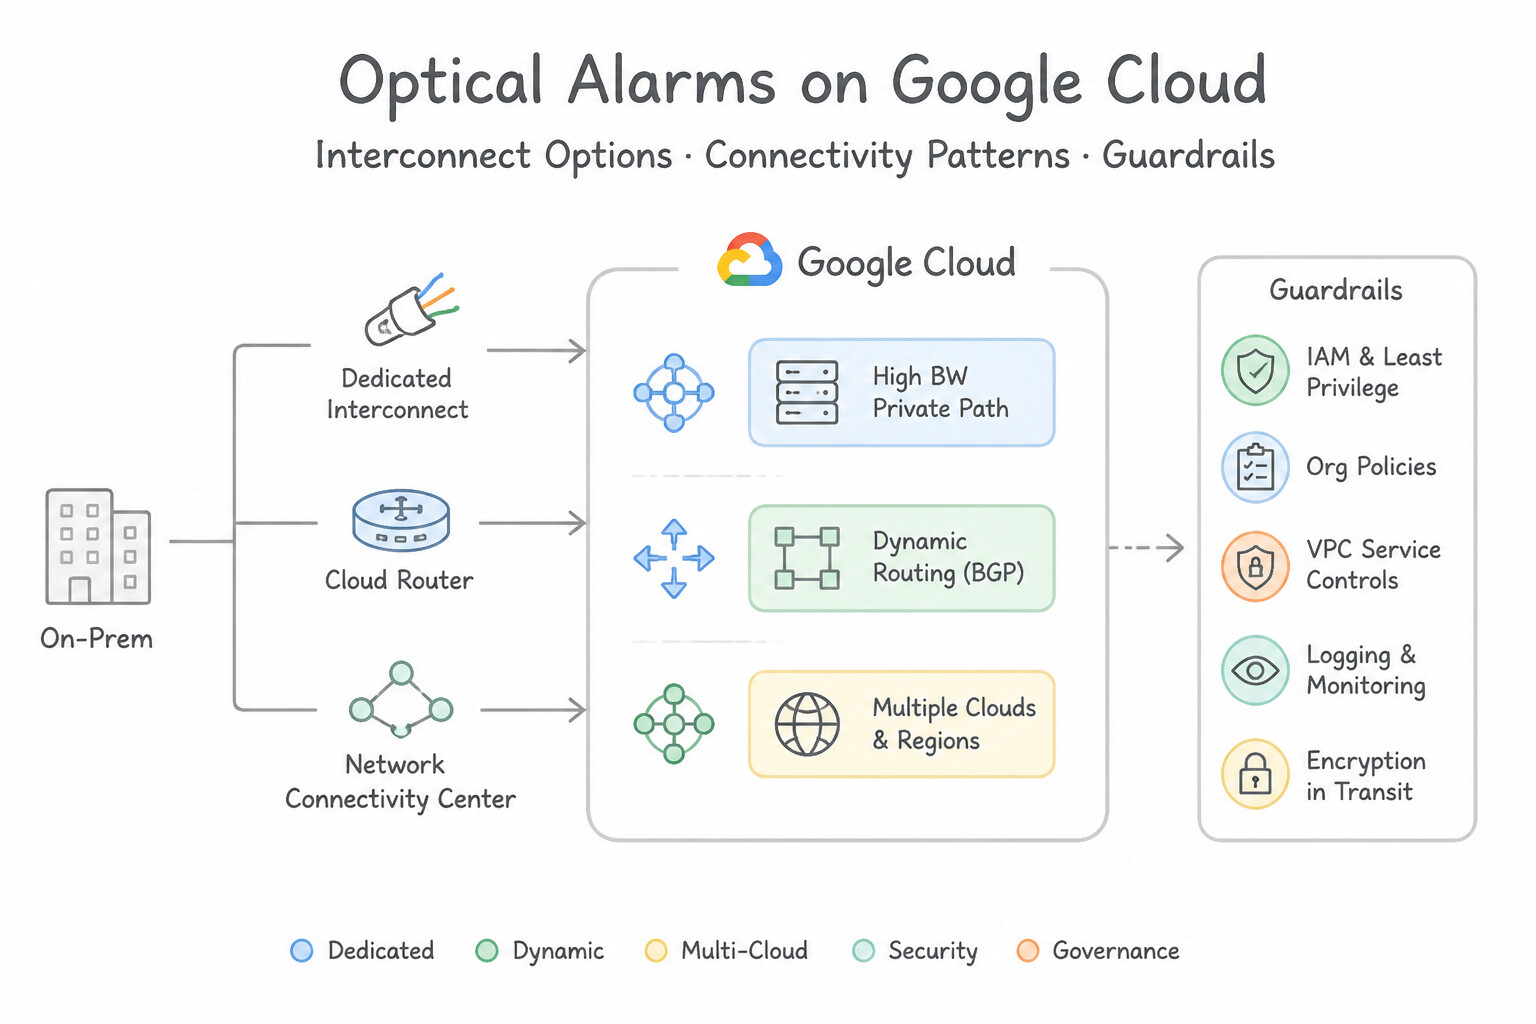
- BGP Session Stuck in CONNECT State: Use Verify that the MD5 authentication key matches on both the Cloud Router and the on-premises router. Authentication failures in logs indicate an MD5 password mismatch between the BGP peers. (Avoid alternative: ASN mismatches usually cause specific 'Bad Peer AS' errors, not authentication failures.)
- Optical Signal Loss Diagnosis: Use Navigate to the Interconnect details page in the Google Cloud Console to view the optical power levels. Checking optical power levels (Rx/Tx) in the Console directly diagnoses physical Layer 1 connectivity issues. (Avoid alternative: BGP status is a Layer 3 indicator and does not reveal Layer 1 physical issues like light levels.)
- Partner Interconnect Paring Status: Use Contact the service provider to configure the VLAN attachment using the pairing key. The status indicates the service provider has not yet finished their configuration steps. (Avoid alternative: Deleting the attachment is unnecessary; the current attachment is valid but waiting for external action.)
Key Takeaways (5.2c)
- Layered Troubleshooting: Verify physical connectivity (Layer 1) before troubleshooting BGP (Layer 3).
- BGP States: 'Connect' or 'Active' states usually indicate TCP or reachability issues, often caused by firewall rules or authentication mismatches.
- Authentication: MD5 authentication mismatches prevent BGP session establishment and are clearly flagged in router logs.
- Verification: Always ensure shared secrets are identical on both peering devices.
Consideration 5.2d: Troubleshooting Cloud Router
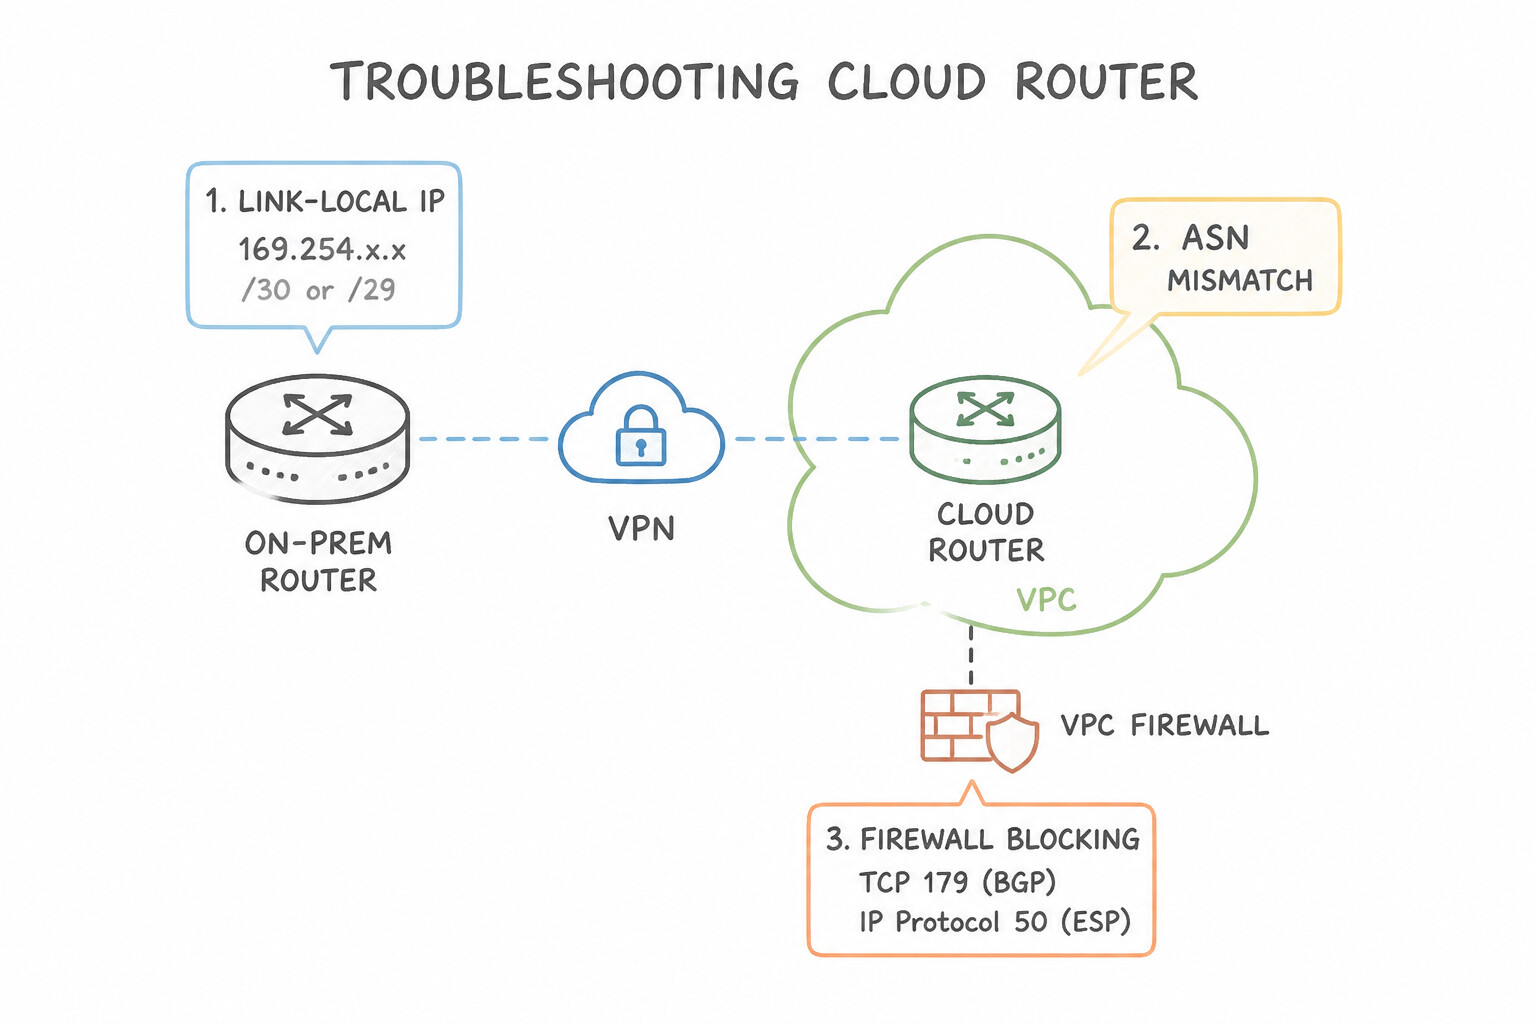
When a physical VPN tunnel or Interconnect VLAN attachment is healthy at Layer 2 (ping 169.254.x.x succeeds), but BGP stays in Idle, Active, or Connect state—or routes are missing from the VPC routing table—check these 6 culprits:
- 1. Link-Local IP (
169.254.x.x/30or/29) or ASN Mismatch: - Verify that the Cloud Router's Cloud Router BGP IP and Peer BGP IP were not transposed on the on-premises router, and check the Autonomous System Numbers (ASN):
- Dedicated Interconnect & HA VPN: Cloud Router must use a private ASN (
64512–65534or4200000000–4294967294) that does not match the on-premises ASN (eBGP is required). - Layer 2 Partner Interconnect: The Cloud Router must be configured with ASN
16550. - Layer 3 Partner Interconnect: The service provider configures BGP on your behalf; the customer's Cloud Router ASN is set according to the partner's handoff requirement.
- 2. MD5 Authentication Key or TCP 179 Filter: If BGP MD5 authentication is enabled on one side with a typo, or if an on-premises router ACL blocks TCP port 179 between the
169.254.x.xlink-local addresses, BGP stays stuck inActive/Connect. - 3. VPC Dynamic Routing Mode (
Regionalvs.Global) Blocking Cross-Region Prefixes: - By default, a new VPC network's Dynamic Routing Mode is
Regional. InRegionalmode, Cloud Routers inus-central1only advertiseus-central1subnets to on-premises and only program learned on-premises routes intous-central1VMs! VMs ineurope-west1in the same VPC will have zero route to on-premises! - Fix: Change the VPC's Dynamic Routing Mode to
Global(gcloud compute networks update VPC_NAME --bgp-routing-mode=global). Note that cross-region dynamic routes automatically have a Dynamic Route Control penalty added to their MED so on-premises routers prefer the closest regional attachment. - 4. Missing Secondary / Non-Subnet Ranges (Cloud Router Custom Advertised Routes):
- By default (
DEFAULTadvertise mode), Cloud Router advertises primary and secondary subnet IP ranges in the VPC (according to regional/global mode). However, if someone switches the Cloud Router or BGP peer toCUSTOMadvertise mode without checking "Advertise all subnets", or if you need to advertise Private Service Access (PSA) ranges, PSC endpoints, on-premises transit prefixes, or a NAT/VIP range, you must explicitly add those CIDRs as Custom Advertised Routes on the Cloud Router. - 5. BFD (Bidirectional Forwarding Detection) Misconfiguration:
- BFD detects forwarding-plane failures in sub-seconds (
min transmit/receive interval = 1000 ms,multiplier = 5→5sfailover, vs60sBGP Hold Timer). Note that BFD (Single-Hop) is supported on Cloud Interconnect VLAN attachments and HA VPN tunnels, and both peers must support and agree on BFD parameters (or use Passive/Active initialization compatibly) so BFD doesn't tear down a healthy BGP session. - 6. Learned Route Quota Exceeded: If an on-premises router advertises more prefixes than theVPC's Unique Dynamic Routes per VPC quota (default
100to250depending on configuration), Cloud Router logs a quota exceeded event and drops the BGP session or ignores excess prefixes! Fix by summarizing routes into supernets on the on-premises router.
Key Implementation Patterns
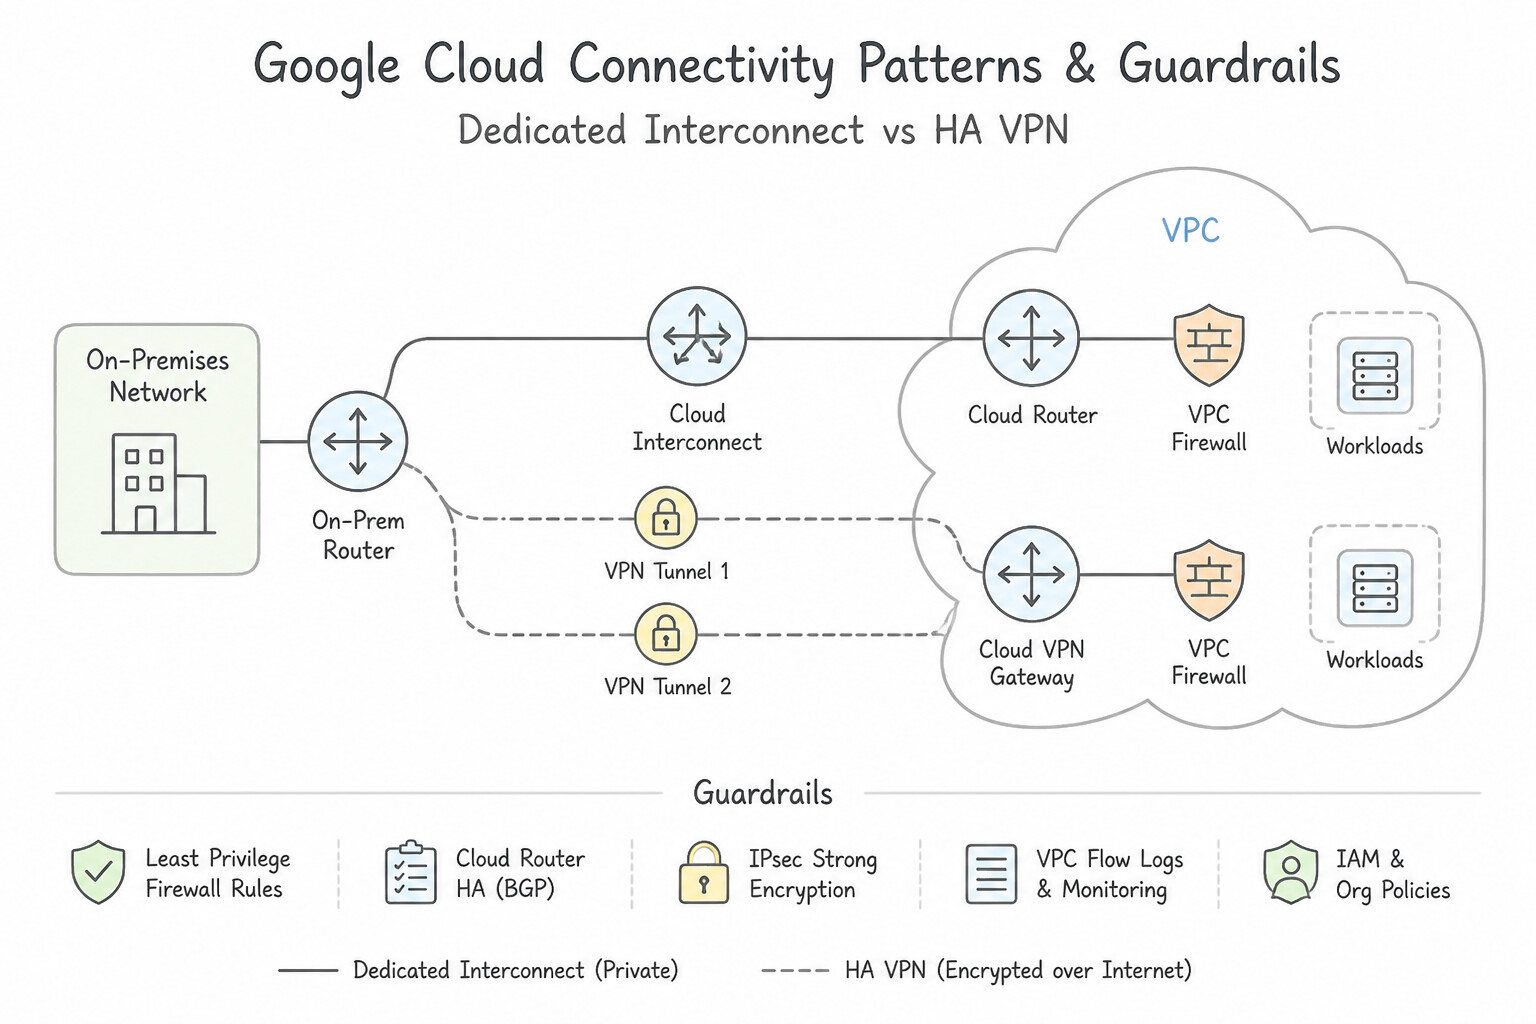
- BGP Session Stuck in 'Connect' State: Use Verify that the on-premises firewall allows bidirectional TCP traffic on port 179. BGP requires TCP port 179 to be open; the "Connect" state often indicates this traffic is blocked. (Avoid alternative: Static routes do not fix BGP session handshake failures and defeat the purpose of dynamic routing.)
- Packet Loss During Cloud Router Maintenance: Use Enable BGP Graceful Restart on your on-premises router. BGP Graceful Restart allows the on-premises router to keep forwarding traffic while the Cloud Router control plane restarts. (Avoid alternative: BFD is for fast failure detection, not for preserving routes during maintenance restarts.)
- Missing On-Premises Routes in VPC: Use Configure route summarization on the on-premises gateway to advertise fewer prefixes. The number of routes exceeds the Cloud Router limit; summarization reduces the route count while keeping connectivity. (Avoid alternative: Hiding the logs does not fix the route drop issue.)
Key Takeaways (5.2d)
- BGP uses TCP port 179; ensure firewalls allow this traffic.
- 'Connect' state usually implies a TCP connectivity issue (firewall or routing).
- 'Active' state often means the local router is initiating TCP but failing.
- Verify Layer 3 (VPN tunnel) status before troubleshooting Layer 4 (BGP) issues.
Consideration 5.2e: Troubleshooting with VPC Flow Logs, firewall logs, and Packet Mirroring
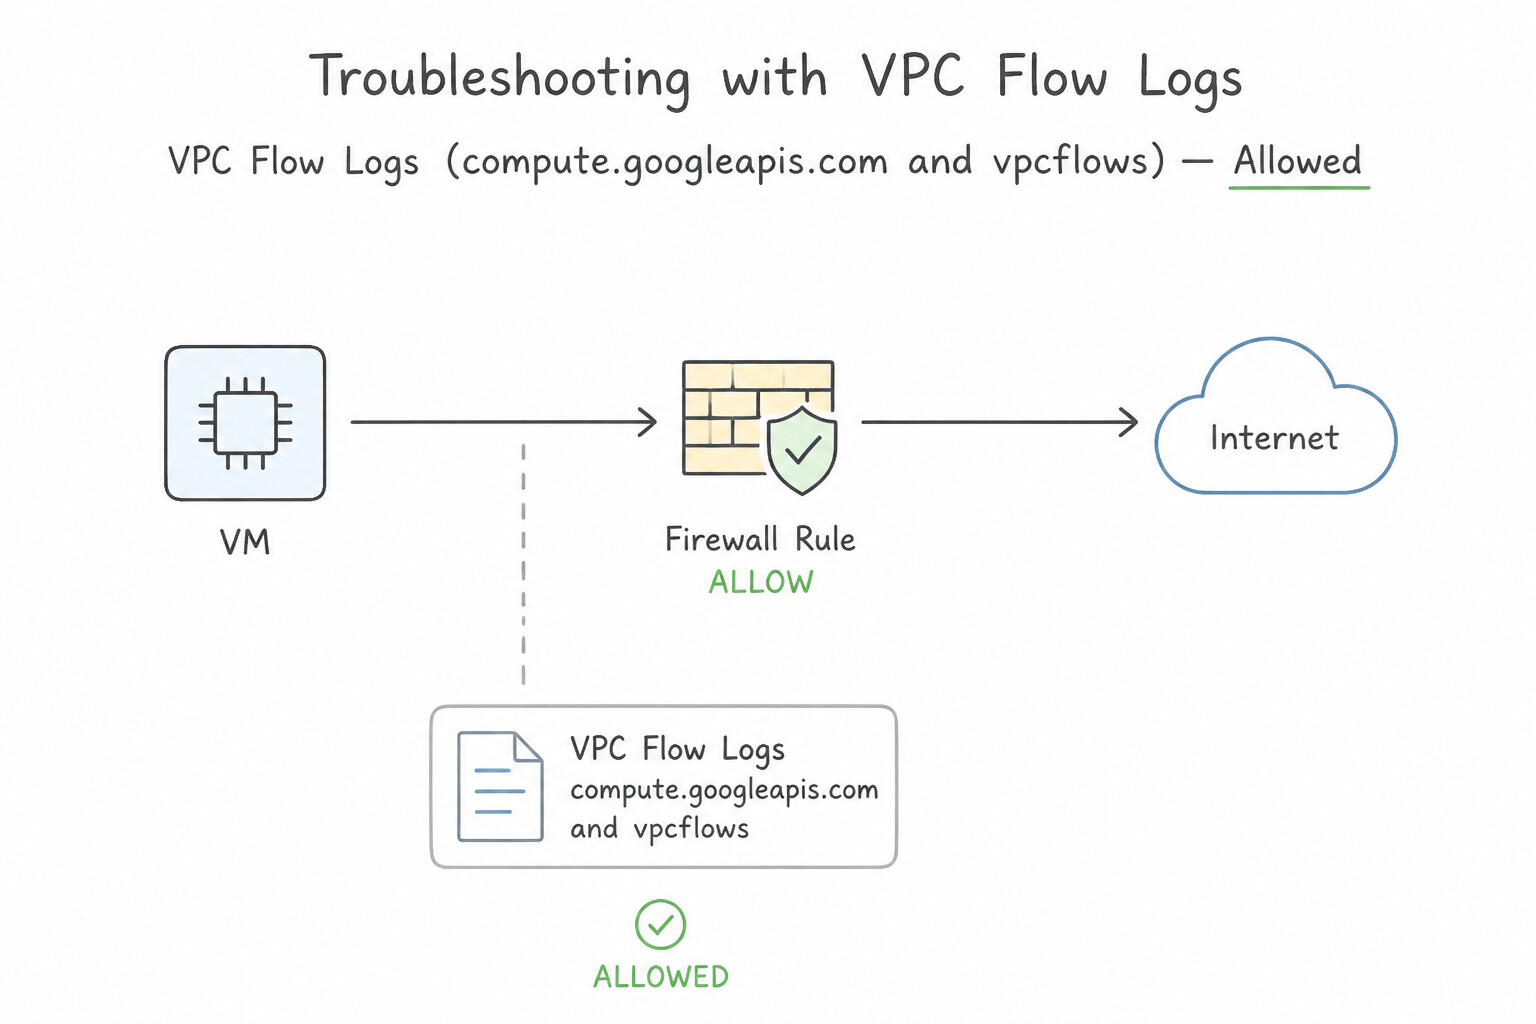
To solve "Where did my packet go?" scenarios In production architectures, memorize the exact visibility boundaries of the three Andromeda packet telemetry tools:
- 1. VPC Flow Logs (
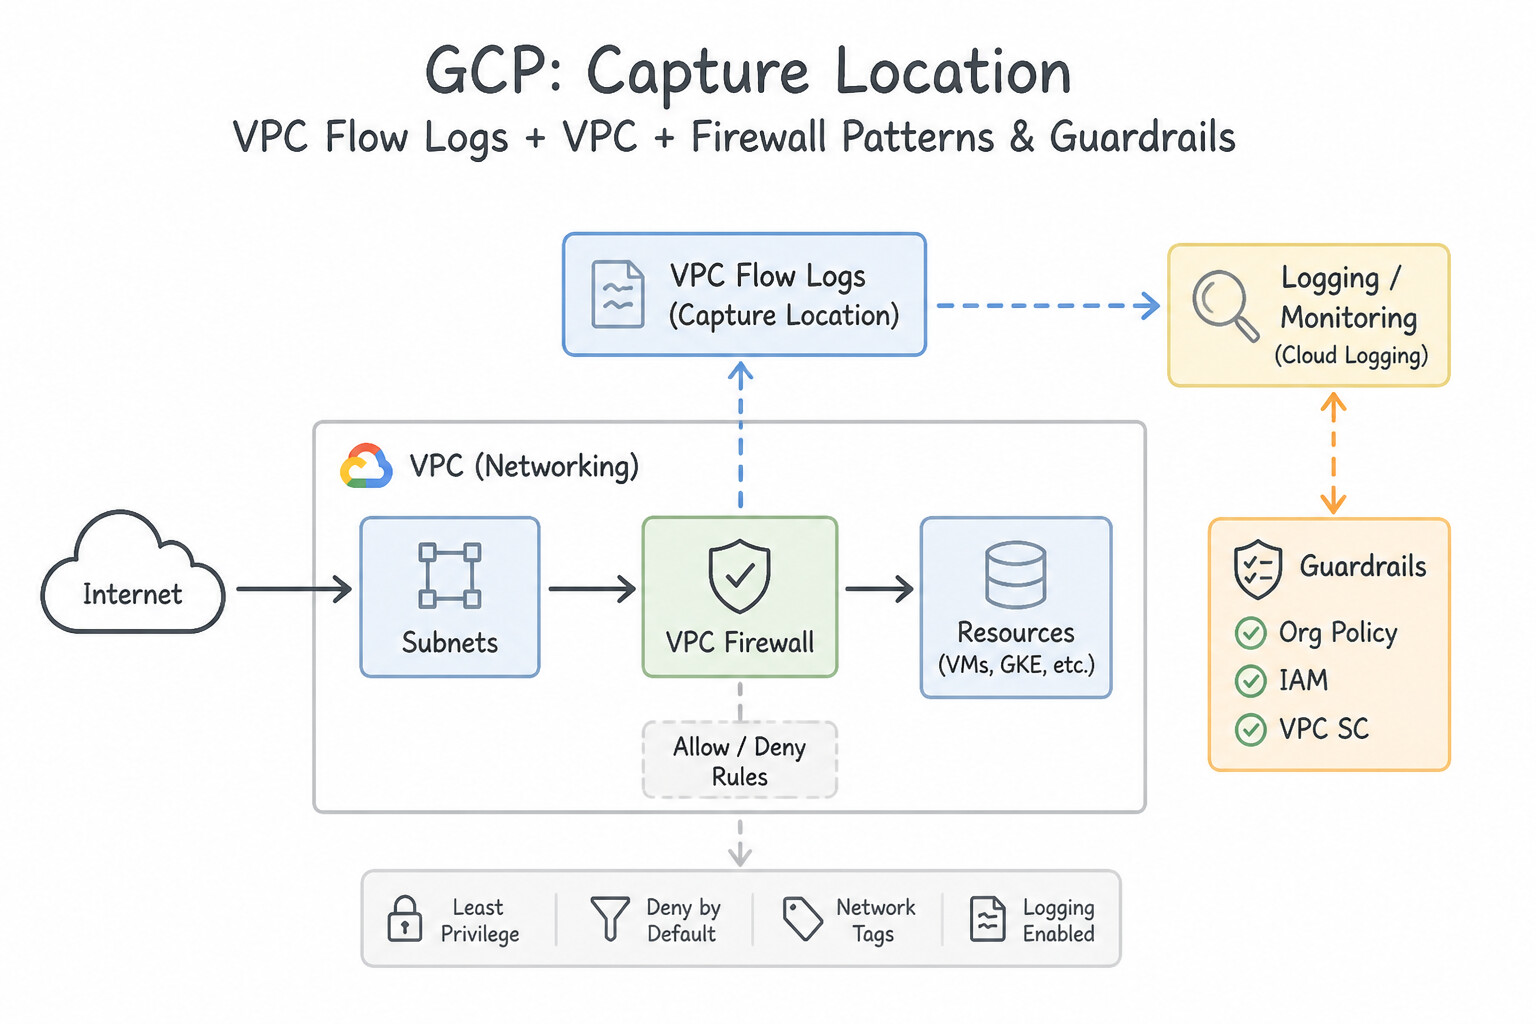
compute.googleapis.com/vpc_flows) — Allowed Traffic Only on Ingress! - Capture Location: Recorded at the Compute Engine VM's vNIC (and supported on GKE Nodes/Pods, Cloud NAT, and VLAN attachments/VPN tunnels via Network Management flow logs).
- The Ingress vs. Egress Firewall Rule Ordering Trap:
- Ingress: Packet arrives → Ingress Firewall Rules evaluated → VPC Flow Logs sampled → Delivered to VM. Consequence: If an ingress firewall rule denies a packet, it NEVER reaches the VPC Flow Log stage! Looking for blocked incoming traffic in VPC Flow Logs is a common configuration mistake.
- Egress: Packet leaves VM → VPC Flow Logs sampled → Egress Firewall Rules evaluated → Sent to network. Consequence: An outgoing packet from a VM that is subsequently denied by an egress firewall rule WILL appear in VPC Flow Logs and in Firewall Rules Logging!
- What VPC Flow Logs Never Capture: Traffic to Google metadata/DNS/NTP (
169.254.169.254), ARP, DHCP, or layer-7 payloads. - 2. Firewall Rules Logging (
compute.googleapis.com/firewall) — Why Was My Connection Blocked or Allowed? - Captures a connection-level log record (5-tuple + matched firewall rule name, priority, action
ALLOWED/DENIED, and VPC/instance metadata) whenever a new TCP/UDP connection matches a rule with logging enabled. - Best Use Case: Proving which specific Hierarchical Policy, Network Firewall Policy, or VPC Firewall Rule dropped a packet (or inadvertently allowed unauthorized traffic).
- 3. Packet Mirroring — Full Layer 2–7 Packet Payload & Header Capture (
pcap): - Clones 100% of matching packets (both headers and full L7 payloads, up to the filter criteria) at the monitored VM's vNIC and encapsulates them to a Collector Internal Passthrough Network Load Balancer (
--is-mirroring-collector) fronting IDS/Zeek/Suricata/Wireshark VMs. - Order of Operations: Just like VPC Flow Logs, Packet Mirroring captures ingress traffic after ingress firewall rules allow it, and captures egress traffic before egress firewall rules drop it. Use Packet Mirroring only when you need deep packet payload inspection (
pcap) or TCP flag/retransmission analysis that 5-tuple flow logs cannot provide.
Key Implementation Patterns
- Valid aggregation interval settings supported by Google Cloud VPC Flow Logs: Use 5s, 30s, 1m, 5m, 15m. VPC Flow Logs supports aggregation intervals of 5 seconds, 30 seconds, 1 minute, 5 minutes, and 15 minutes. (Avoid alternative: VPC Flow Logs does not support 10-minute, 30-minute, or 1-hour aggregation windows.)
- Optimizing VPC Flow Logs for Cost: Use Verify that the jsonPayload.disposition field has the value DENIED. The jsonPayload.disposition field in a firewall log entry specifies whether the traffic was ALLOWED or DENIED. (Avoid alternative: A disposition of ALLOWED means the traffic passed through the firewall, which contradicts the goal of diagnosing a block.)
- Logging feature that appends resource context such as virtual machine (VM) names: Use Metadata annotations. Metadata annotations add contextual resource information such as VM names, zones, regions, and project IDs to VPC Flow Logs. (Avoid alternative: IAM handles permissions and access control, not network log telemetry enrichment.)
Key Takeaways (5.2e)
- VPC Flow Logs aggregation intervals can be set to 5s, 30s, 1m, 5m, or 15m.
- The default aggregation interval is 5 seconds.
- Shorter intervals provide near-real-time monitoring, whereas longer intervals reduce log volume and ingestion costs.
- Firewall Rules Logging must be enabled per rule to generate logs.
Quick Decision Cheat Sheet (Subsection 5.2)
If the Scenario Requires... | Choose This Google Cloud Pattern | Avoid This Common Mistake |
|---|---|---|
"Packet dropped by an Ingress Firewall Rule does not show up in VPC Flow Logs" | Expected behavior! Ingress firewall rules execute before VPC Flow Logs; use Firewall Rules Logging instead | Setting VPC Flow Log sample rate to 1.0 (100%)—it still won't capture packets dropped by ingress firewalls |
"Packet dropped by an Egress Firewall Rule DOES show up in VPC Flow Logs" | Expected behavior! VPC Flow Logs capture outgoing packets at the vNIC before Egress Firewall evaluation | Assuming the packet actually left the VPC just because it appeared in VPC Flow Logs |
"Prevent 502 Bad Gateway errors when autoscaler scales in or during rolling MIG updates" | Configure Connection Draining ( --connection-draining-timeout) on the Backend Service | Increasing health check intervals to 300 seconds |
"Classic Policy-Based VPN tunnel drops subnets or resets Child SAs when connecting to third-party IKEv1 router" | Migrate to HA VPN ( IKEv2) with Cloud Router BGP (or collapse traffic selectors to a single supernet / use IKEv2) | Adding 20 separate Classic VPN tunnels on the same static IP |
"Layer 2 Partner Interconnect BGP session fails to establish on Cloud Router" | Configure the Cloud Router with Google's required ASN 16550 and apply the partner Pairing Key / VLAN activation | Using a custom private ASN like 65001 on a Layer 2 Partner Interconnect Cloud Router |
"GKE Pods (Secondary Alias IP range) cannot reach on-premises after switching Cloud Router to Custom Advertise Mode" | Explicitly add the GKE Pod secondary CIDR range to the Cloud Router's Custom Advertised Routes | Enabling can-ip-forward on GKE nodes or creating static routes on the VPC |
"Inspect full HTTP/TLS packet payloads ( pcap) from compromised VMs for forensic investigation" | Configure Packet Mirroring sending cloned traffic to an Internal Passthrough NLB collector ( --is-mirroring-collector) | Enabling VPC Flow Logs with include-all-metadata (Flow Logs only record 5-tuple headers, never packet payloads) |
Further Reading (Subsection 5.2)
- Enabling connection draining — Documentation explaining how connection draining works on backend services and how to configure the timeout duration.
- gcloud compute instance-groups managed delete-instances — Describes the difference between deleting and abandoning instances in a Managed Instance Group.
- Enabling connection draining — Explains how connection draining works to minimize disruption to users during instance removal.
- Enable connection draining — Documentation explaining how connection draining works, how to enable it on backend services, and how it interacts with instance termination.
- Troubleshooting Cloud VPN — Refer to the section on 'Phase 1 negotiation failed' which lists checking the shared secret as a primary troubleshooting step.
- Cloud VPN troubleshooting — Refer to the section on Firewall rules to see the requirement for allowing UDP 500 and UDP 4500.
Subsection 5.3: Using Network Intelligence Center to monitor and troubleshoot common networking issues
The Big Picture
In a modern enterprise Google Cloud footprint—spanning Shared VPCs, Network Connectivity Center (NCC) hubs, HA VPNs, Dedicated Interconnects, Private Service Connect (PSC) endpoints, and hundreds of hierarchical and NGFW firewall rules—troubleshooting by manually running gcloud compute routes list and gcloud compute firewall-rules list across 50 projects is humanly impossible. Worse, waiting until a GKE Pod subnet hits 100% IP utilization or a misconfigured route blackholes production traffic leads to avoidable outages.
Network Intelligence Center (NIC) is Google Cloud's unified network observability, verification, and optimization suite. In Google Cloud architectures, Section 5.3 tests your ability to pick the exact right module among the six Network Intelligence Center tools—Network Topology (5.3a), Connectivity Tests (5.3b), Performance Dashboard (5.3c), Firewall Insights (5.3d), Network Analyzer (5.3e), and Flow Analyzer (5.3f)—without confusing their capabilities. Over 90% of Section 5.3 architecture reviews present a specific diagnostic symptom and ask which NIC module solves it with the least operational effort.
Consideration 5.3a: Using Network Topology to visualize throughput and traffic flows
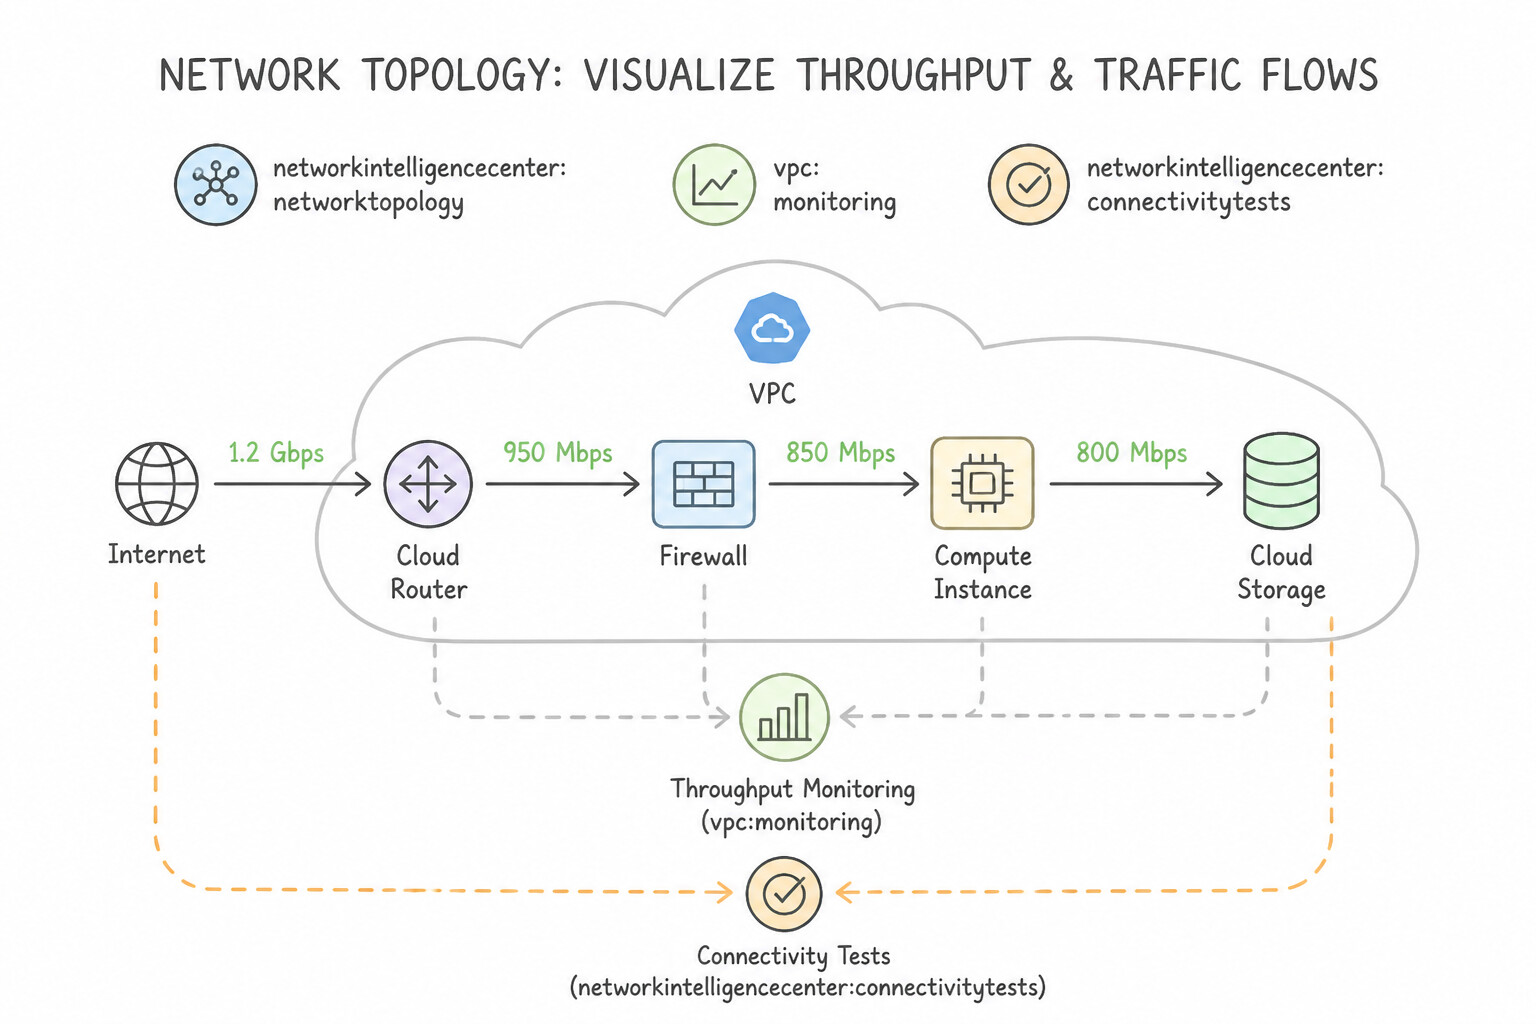
Network Topology automatically discovers and renders an interactive visual graph of your infrastructure (requiring zero agent installation on VMs):
- Entities Visualized: VPC networks, Regions, Zones, Subnets, Instance Groups, GKE Clusters/Nodes/Workloads, Cloud Load Balancers, Cloud VPN/Interconnect attachments, PSC endpoints, and external/on-premises client Geographies or CIDRs.
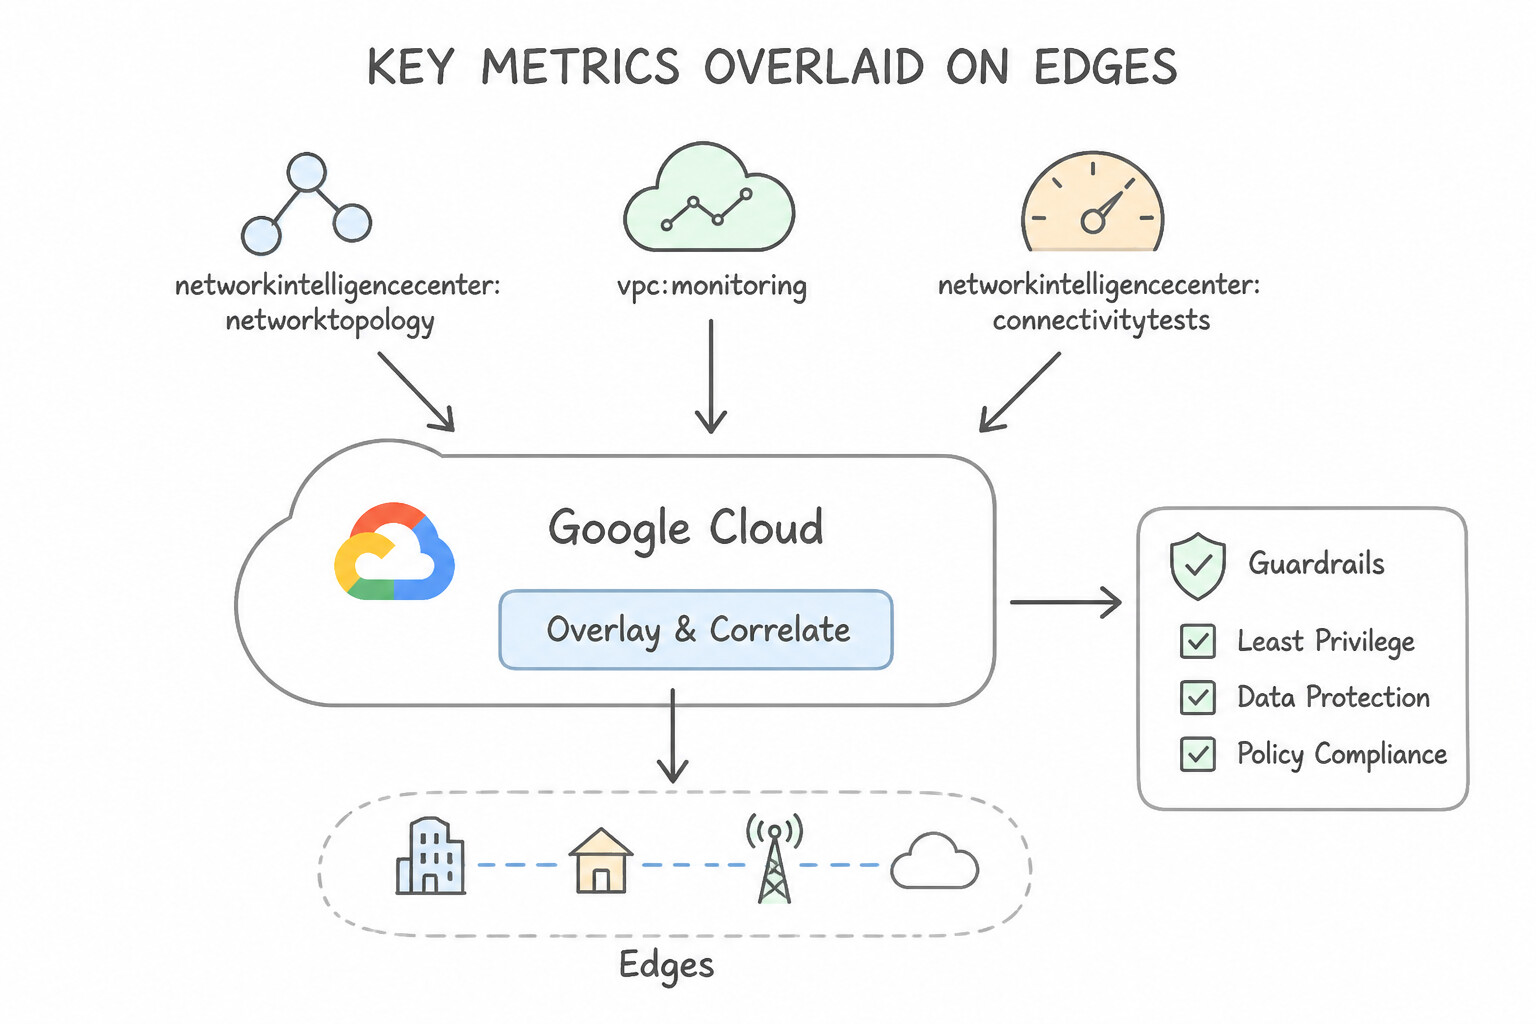
- Key Metrics Overlaid on Edges:
- VM-to-VM & Hybrid Throughput: Bandwidth (bytes/sec) and packet loss/RTT latency on edges between zones, regions, and hybrid VLAN attachments/tunnels.
- Load Balancer Performance: Requests per second (RPS) and 75th/95th/99th percentile backend latency from Google Front Ends (GFEs) to each backend MIG.
- Primary architectures Use Case: Visually spotting unexpected cross-region or cross-zone traffic flows (which incur $0.01/GiB inter-zone egress charges), seeing which specific GKE workload or MIG is saturating a hybrid Interconnect link, or correlating a spike in Load Balancer latency to a specific regional backend group on an interactive topology map.
Key Implementation Patterns
- Network Intelligence Center module that visualizes traffic metrics, cross-zone egress: Use Network Topology. Network Topology visualizes VPC traffic flows, throughput, cross-zone network egress, and associated data transfer costs. (Avoid alternative: Connectivity Tests analyzes reachability between network endpoints rather than visualizing egress traffic or data transfer costs.)
- Connectivity Tests capability that validates live end-to-end data plane reachability: Use Dynamic packet probing. Dynamic packet probing transmits real diagnostic packets across the data path to evaluate live TCP handshake responses. (Avoid alternative: Static configuration analysis checks configuration rules on the control plane and does not transmit live data packets.)
Key Takeaways (5.3a)
- Network Topology provides a visual layout of VPC topologies and shows inter-zone and inter-region egress traffic alongside data transfer costs.
- Connectivity Tests diagnoses reachability issues between specific network endpoints.
- Network Analyzer proactively detects misconfigurations and network failures.
- Packet Mirroring captures raw packets for security analysis and anomaly detection.
Consideration 5.3b: Using Connectivity Tests to diagnose route and firewall misconfigurations
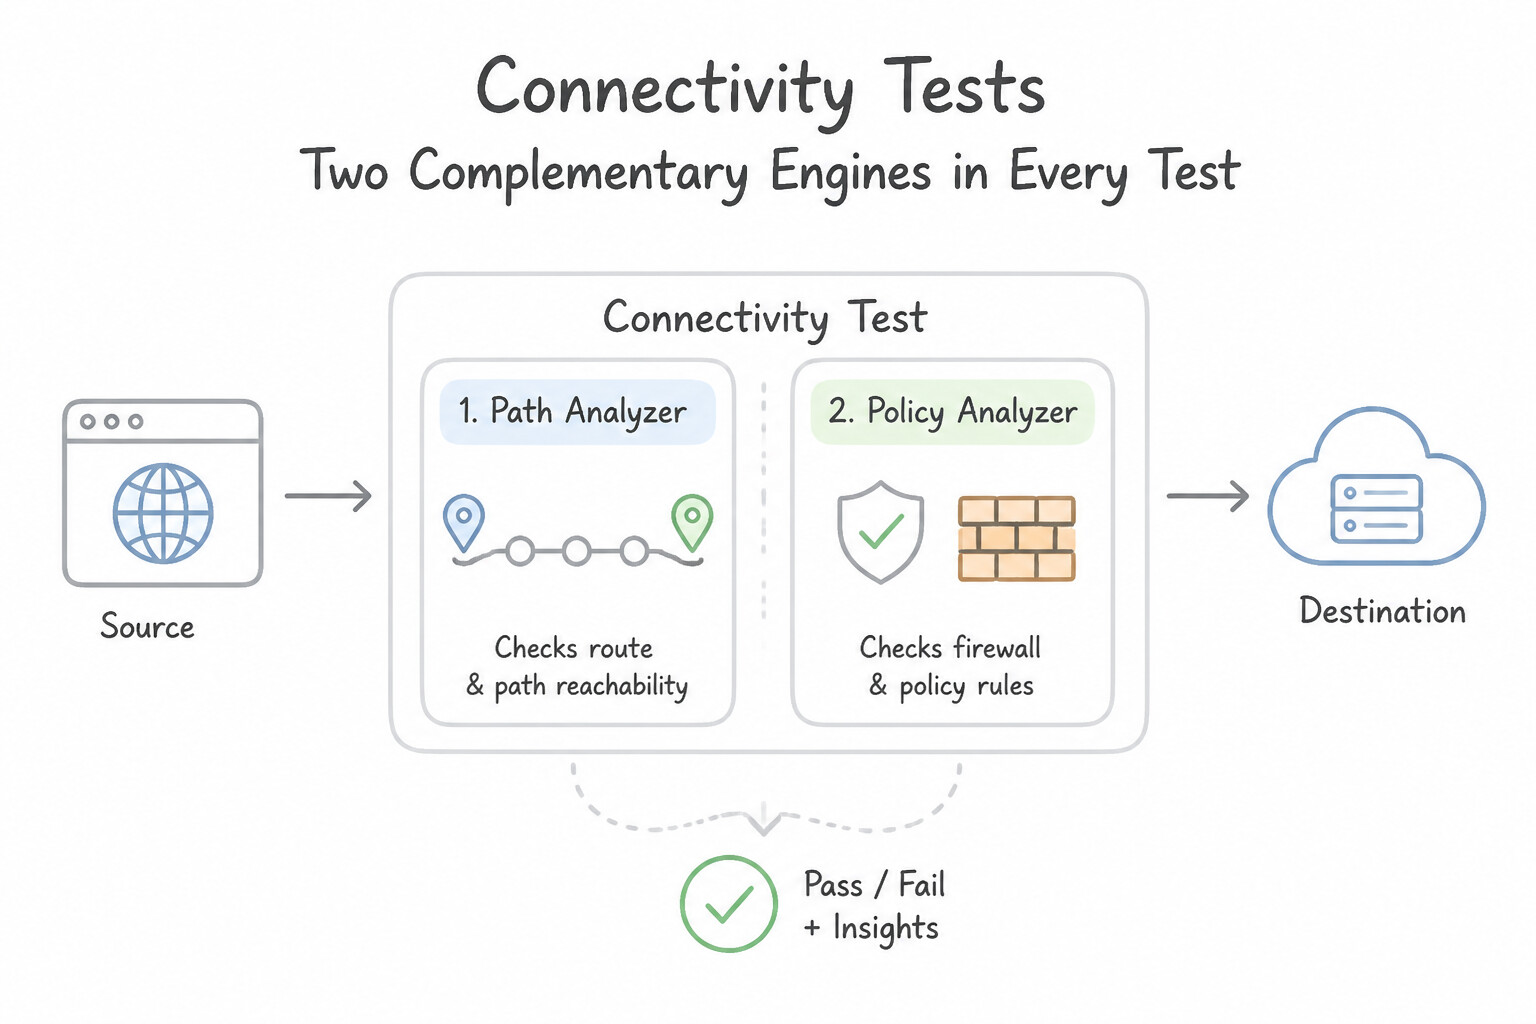
Connectivity Tests (networkmanagement.googleapis.com) is the gold-standard tool in production whenever a question asks "Why can't Resource A reach Resource B?":
- Two Complementary Engines in Every Test:
- Configuration Analysis (Static Control-Plane Simulation): Evaluates Google Cloud's live control-plane metadata (Hierarchical/NGFW/VPC Firewall rules, VPC Routes, Policy-Based Routes, VPC Peering, NCC spokes, Cloud NAT, PSC, and Load Balancers) using formal verification models. Crucial architectures Advantage: Because it evaluates configuration metadata rather than relying solely on live pings, it can test connectivity to a stopped VM, verify whether a new firewall rule would block traffic before production cutover, and pinpoint the exact name and priority of a blocking egress/ingress firewall rule or blackhole route.
- Live Data-Plane Analysis (Probing): Injects actual synthetic probe packets through the Andromeda data plane to measure real-time packet delivery, latency, and packet loss percentage across the active path (including across HA VPN and Cloud Interconnect to on-premises endpoints).
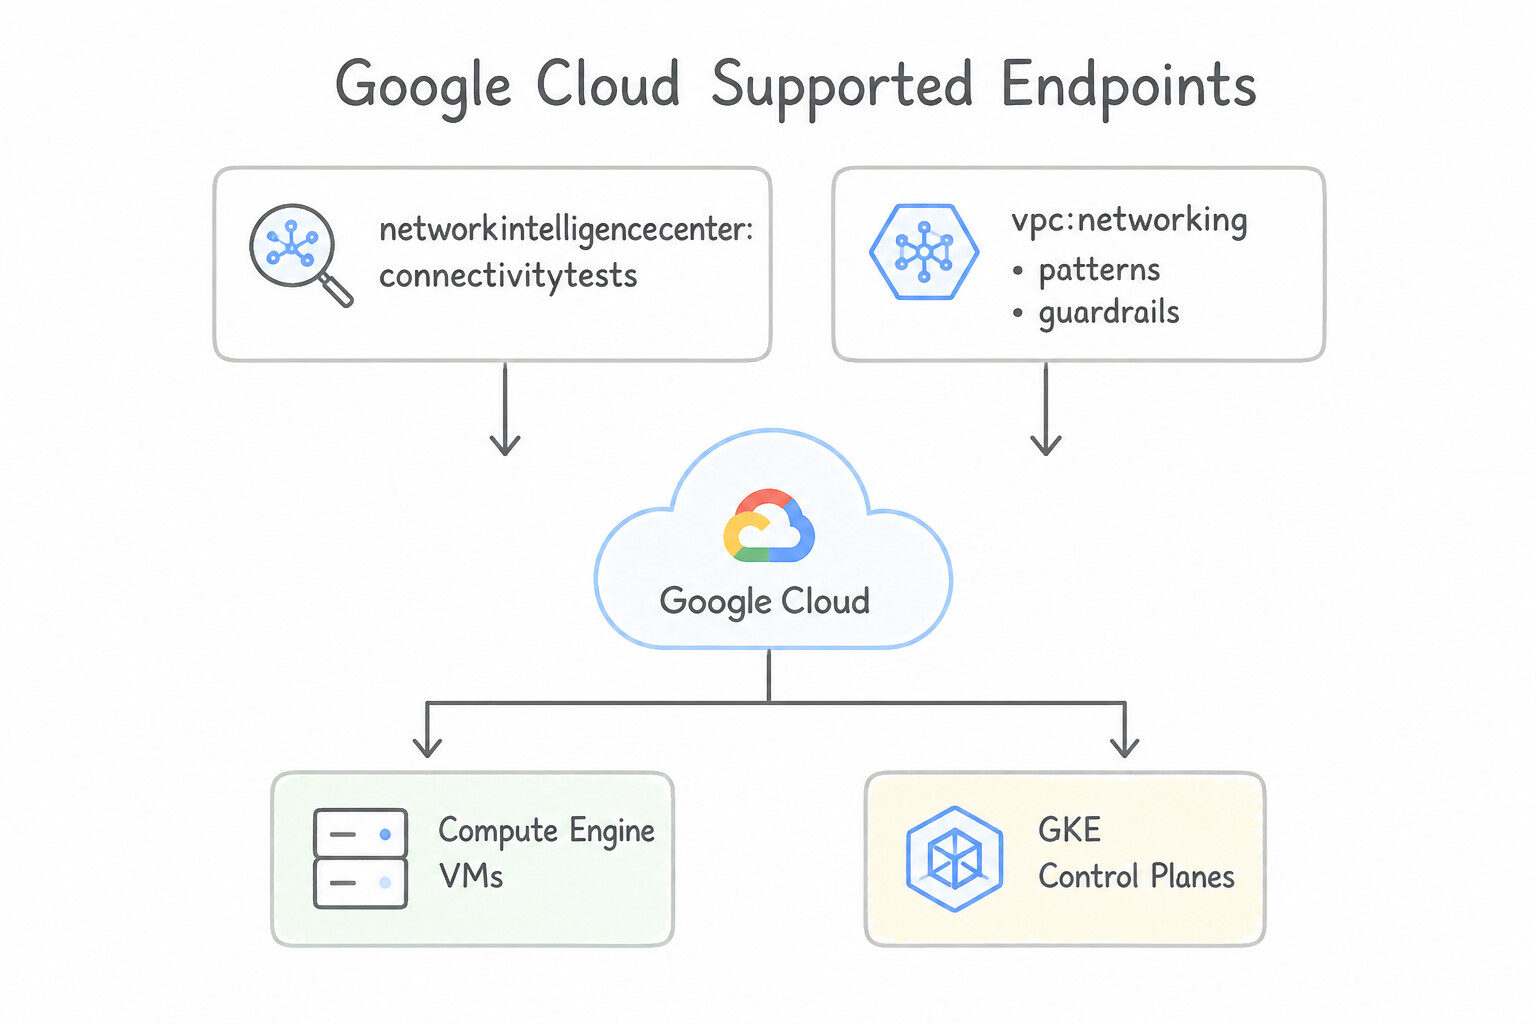
- Supported Endpoints: Compute Engine VMs, GKE Control Planes, Nodes, and Pods, App Engine Standard/Flexible, Cloud Run, Cloud Functions, Cloud SQL (Private IP / PSC), Load Balancer VIPs, Private Service Connect (
PSC) endpoints/producers, and arbitrary external/on-premises IP addresses. - Shared VPC & Cross-Project Tracing: If a test traverses a Shared VPC or peered VPCs across multiple projects, the user running the test needs
roles/networkmanagement.viewer(ornetworkmanagement.connectivityTestsAdmin) in all projects along the path to see the full hop-by-hop details instead of anUnverifiedorPermission Deniedboundary hop.
Key Implementation Patterns
- Network Intelligence Center feature that performs static configuration modeling and path: Use Connectivity Tests. Connectivity Tests statically analyzes VPC configurations and simulates packet paths without injecting live packets into the network data plane. (Avoid alternative: Packet Mirroring captures and duplicates real data plane traffic rather than simulating network configurations.)
Key Takeaways (5.3b)
- Connectivity Tests uses static configuration analysis to simulate packet reachability between endpoints.
- No actual data plane traffic is generated or injected across network links during a connectivity test.
- The simulation validates firewall rules, route tables, Cloud NAT, and load balancers to detect misconfigurations or reachability drops.
Consideration 5.3c: Using Performance Dashboard to identify packet loss and latency (Google-wide and project scoped)
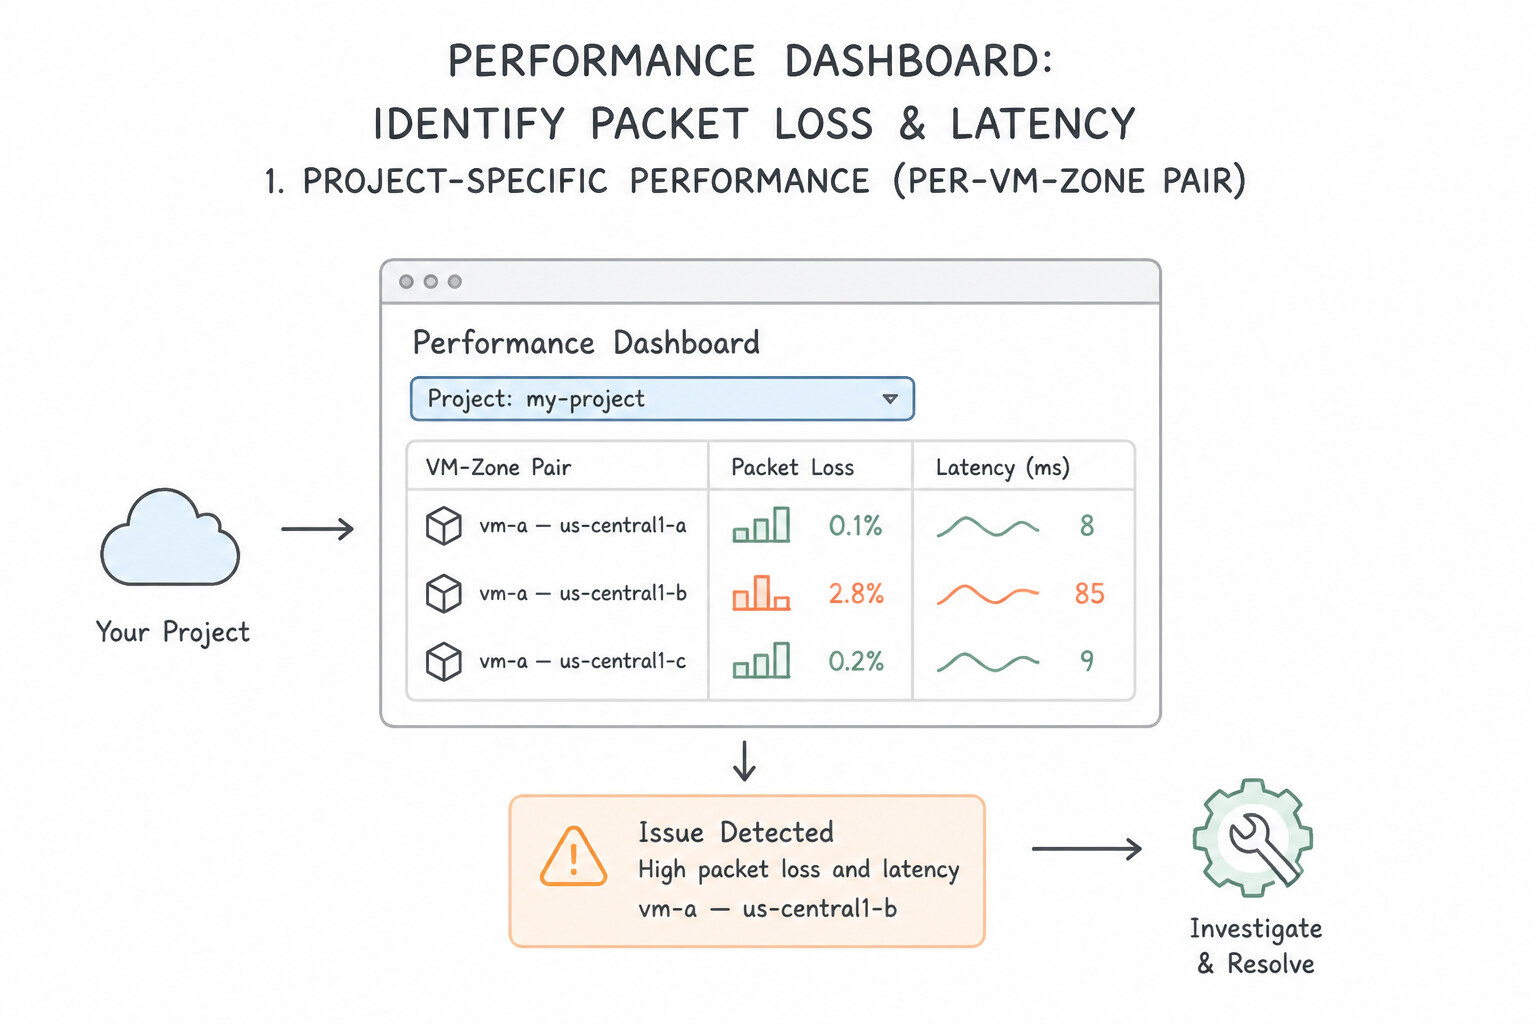
Performance Dashboard monitors Layer 3 network health (packet loss and round-trip time [RTT] latency) at two distinct scopes:
- 1. Project-Specific Performance (Per-VM-Zone Pair):
- Uses active probing and live traffic telemetry between VMs in your project (requires at least enough VM traffic/instances across zones to establish a baseline) to report Packet Loss (%) and Median / 95th Percentile RTT Latency (ms) between every
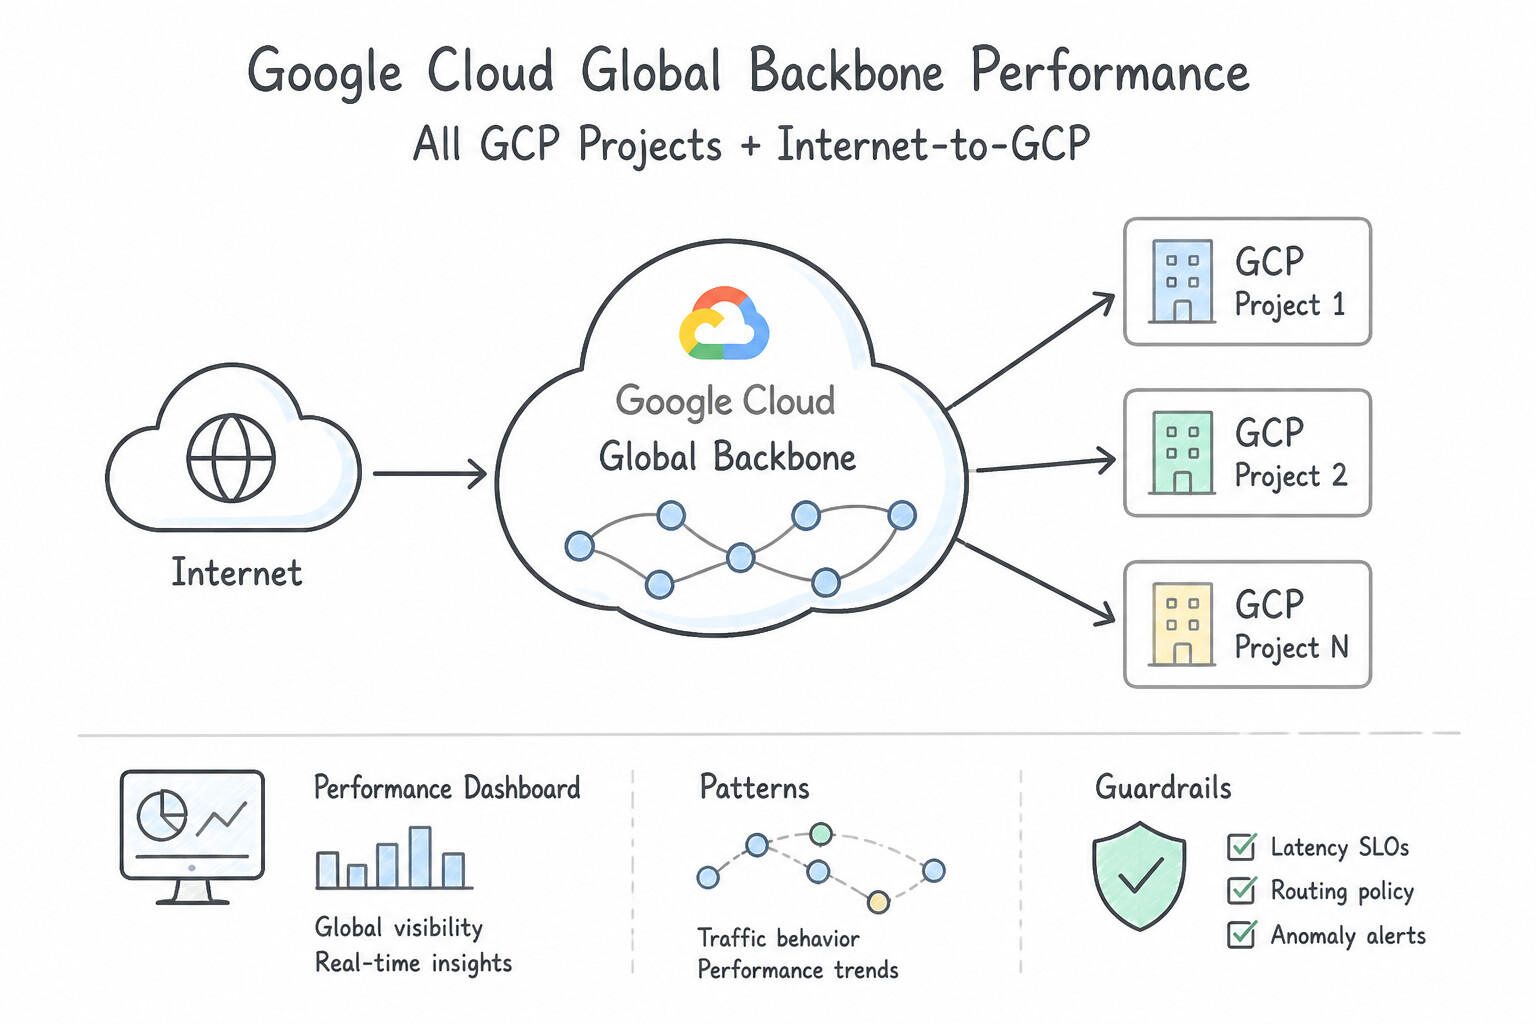
[Source Zone] -> [Destination Zone]pair. - 2. Google Cloud Global Backbone Performance (All Google Cloud Projects + Internet-to-GCP):
- Displays the real-time packet loss and RTT heatmap across all of Google Cloud's global regions/zones (and from external Internet ASNs/cities to Google Cloud regions).
- production architecture Decision Pattern: When an application team complains of sudden packet loss or latency spikes between
us-central1-aandeurope-west1-b, open Performance Dashboard to compare Project-Specific packet loss against Google Cloud-wide packet loss for that exact zone pair: - If Project-Specific loss is high (e.g., 8%) while Google Cloud-wide loss is 0%, the problem is inside your project (e.g., an overloaded target VM hitting its per-VM egress bandwidth cap or vCPU softirq saturation, or a choked NVA appliance).
- If Google Cloud-wide loss is also elevated, it is an underlying Google infrastructure issue between those zones, and you should fail traffic over to an unaffected region/zone.
Key Implementation Patterns
- Network Intelligence Center component that measures and displays inter-region packet: Use Performance Dashboard. Performance Dashboard provides visibility into Google Cloud global backbone network latency and packet loss between regions. (Avoid alternative: Flow Analyzer queries VPC Flow Logs to inspect granular traffic patterns rather than measuring backbone latency.)
Key Takeaways (5.3c)
- Performance Dashboard tracks inter-region packet latency and packet loss across Google's global network backbone.
- Network Topology illustrates traffic flows and infrastructure architecture graphs.
- Firewall Insights audits and optimizes VPC firewall configurations.
- Flow Analyzer inspects and aggregates VPC Flow Logs for detailed traffic analysis.
Consideration 5.3d: Using Firewall Insights to monitor, identify, and improve rules
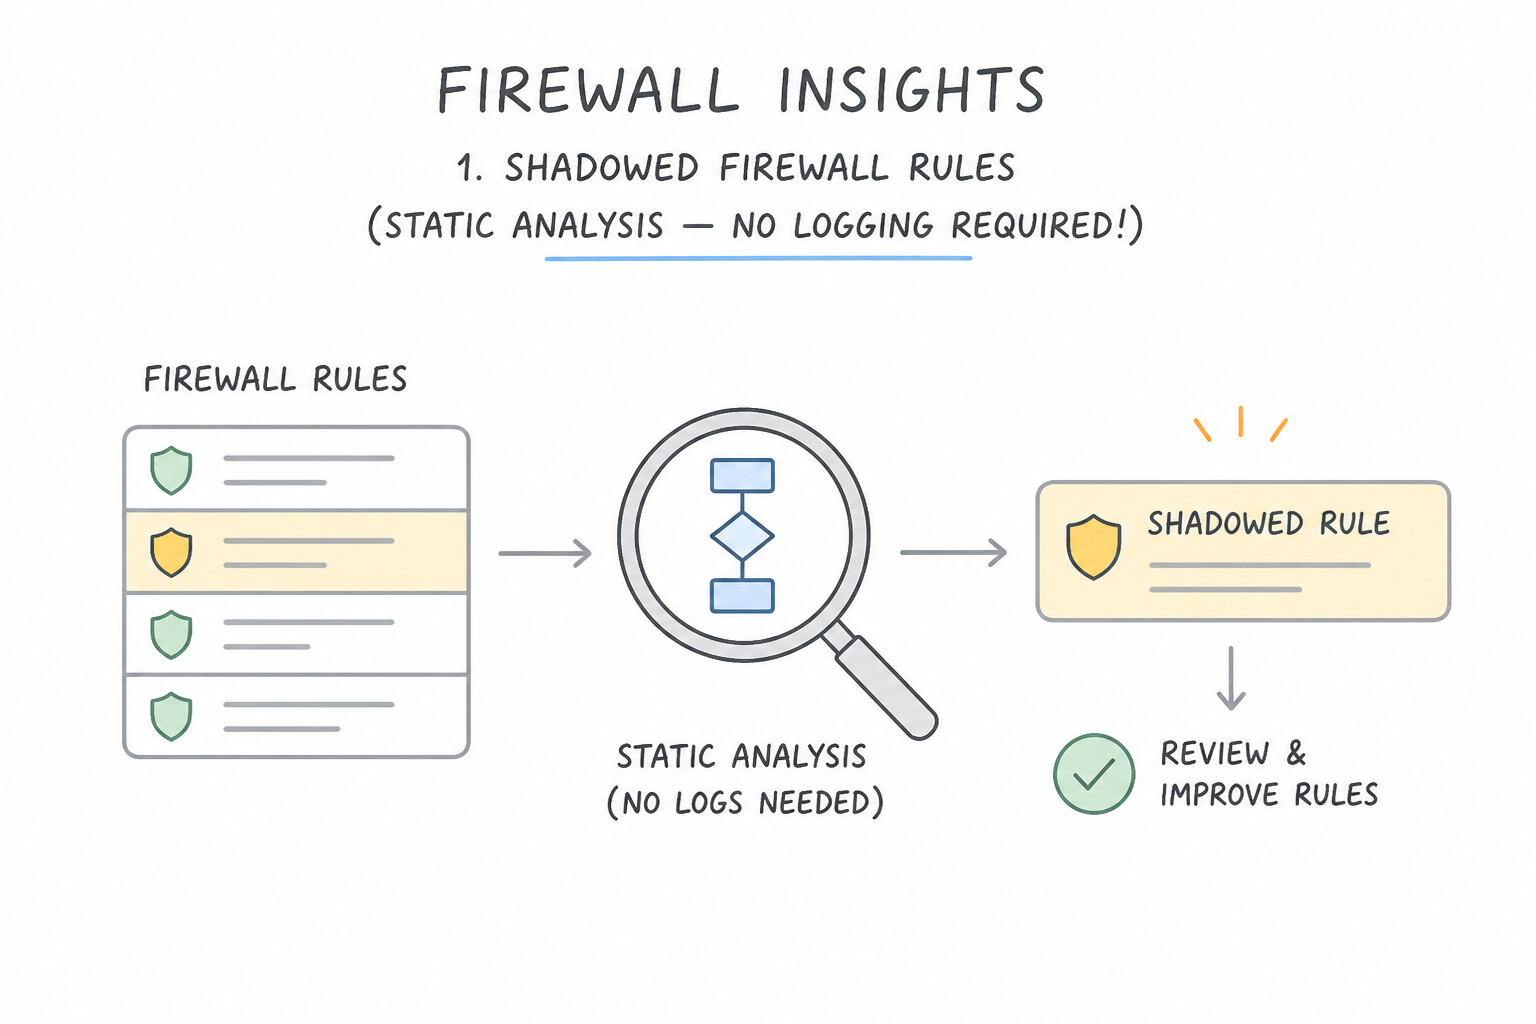
Firewall Insights combines control-plane static analysis with Firewall Rules Logging hit metrics and machine learning to harden least-privilege firewall posture:
- 1. Shadowed Firewall Rules (Static Analysis — No Logging Required!):
- Identifies rules that can never be matched because a higher-priority rule (lower numerical value, e.g., Priority
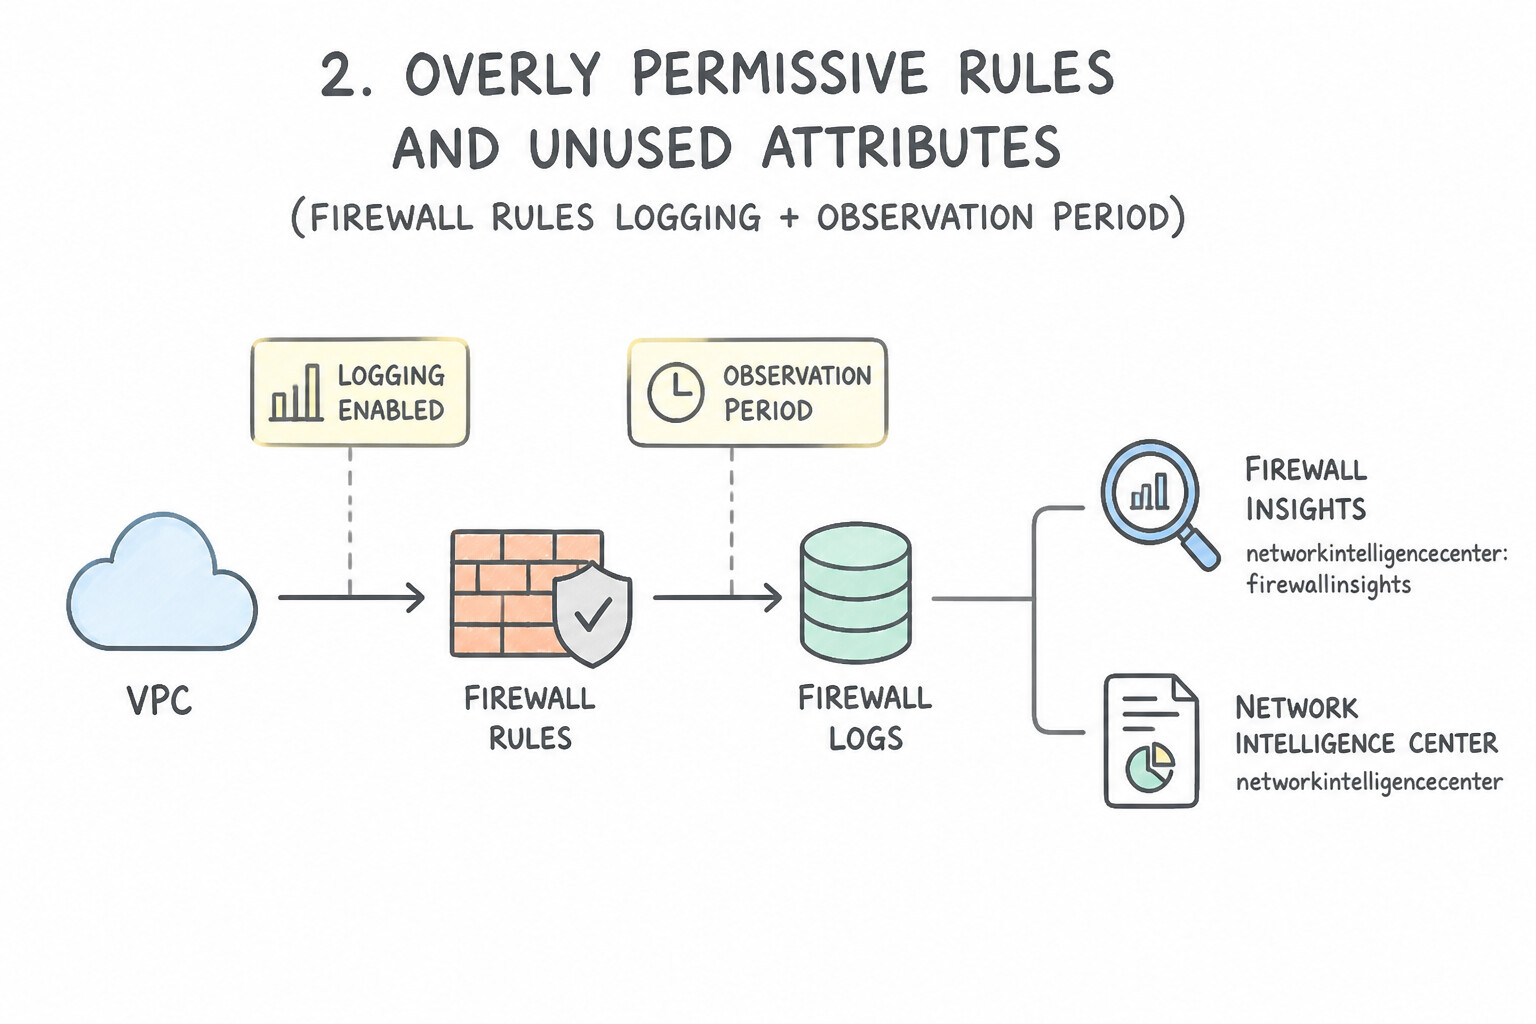
900) already matches a superset of the same IP ranges, protocols,ports, and targets as the lower-priority rule (e.g., Priority1000). Note: Detecting shadowed rules requires only static config analysis (Firewall Rules Logging does not even need to be enabled!). - 2. Overly Permissive Rules & Unused Attributes (Requires Firewall Rules Logging + Observation Period):
- Analyzes actual connection hits over an adjustable Observation Period (default
6weeks, configurable from1 dayto365 days) and flags: - Rules with Zero Hits: Firewall
allowrules that have not matched a single packet during the entire observation window (prime candidates for removal). - Allow Ranges with No Hits / Unused Port or IP Attributes: E.g., a rule permits
10.0.0.0/8ontcp:1-65535, but over 6 weeks only10.10.4.0/24ontcp:443andtcp:8443ever matched traffic. - ML Predictions (
Future Usage Prediction): Firewall Insights uses machine learning on historical traffic patterns across similar workloads to mark whether an unused port/subnet attribute is likely to be needed in the near future, preventing you from tightening a rule that is only used during monthly batch jobs!
Key Implementation Patterns
- Specific Network Intelligence Center module designed to audit, optimize, and detect: Use Firewall Insights. Firewall Insights detects unused, shadowed, and overly permissive firewall rules to optimize network security policies. (Avoid alternative: Network Analyzer monitors overall network configurations and health rather than detailing firewall rule utilization.)
- BGP Session Stuck in 'Connect' State: Use Enable Firewall Insights. Review the 'Unused rules' insight to identify rules with no hit counts over the past six weeks. Firewall Insights provides native, automated detection of unused rules using historical hit counts over extended periods.
Key Takeaways (5.3d)
- Firewall Insights is the dedicated Network Intelligence Center feature for evaluating firewall rule hit counts, shadowing, redundancy, and over-permissiveness.
- Use Connectivity Tests to analyze hop-by-hop reachability between specific endpoints.
- Use Network Analyzer to detect broader network misconfigurations and resource limit warnings.
- Use Performance Dashboard for observing latency and packet loss trends across Google Cloud.
Consideration 5.3e: Using Network Analyzer to identify network failures, suboptimal configurations, and utilization warnings
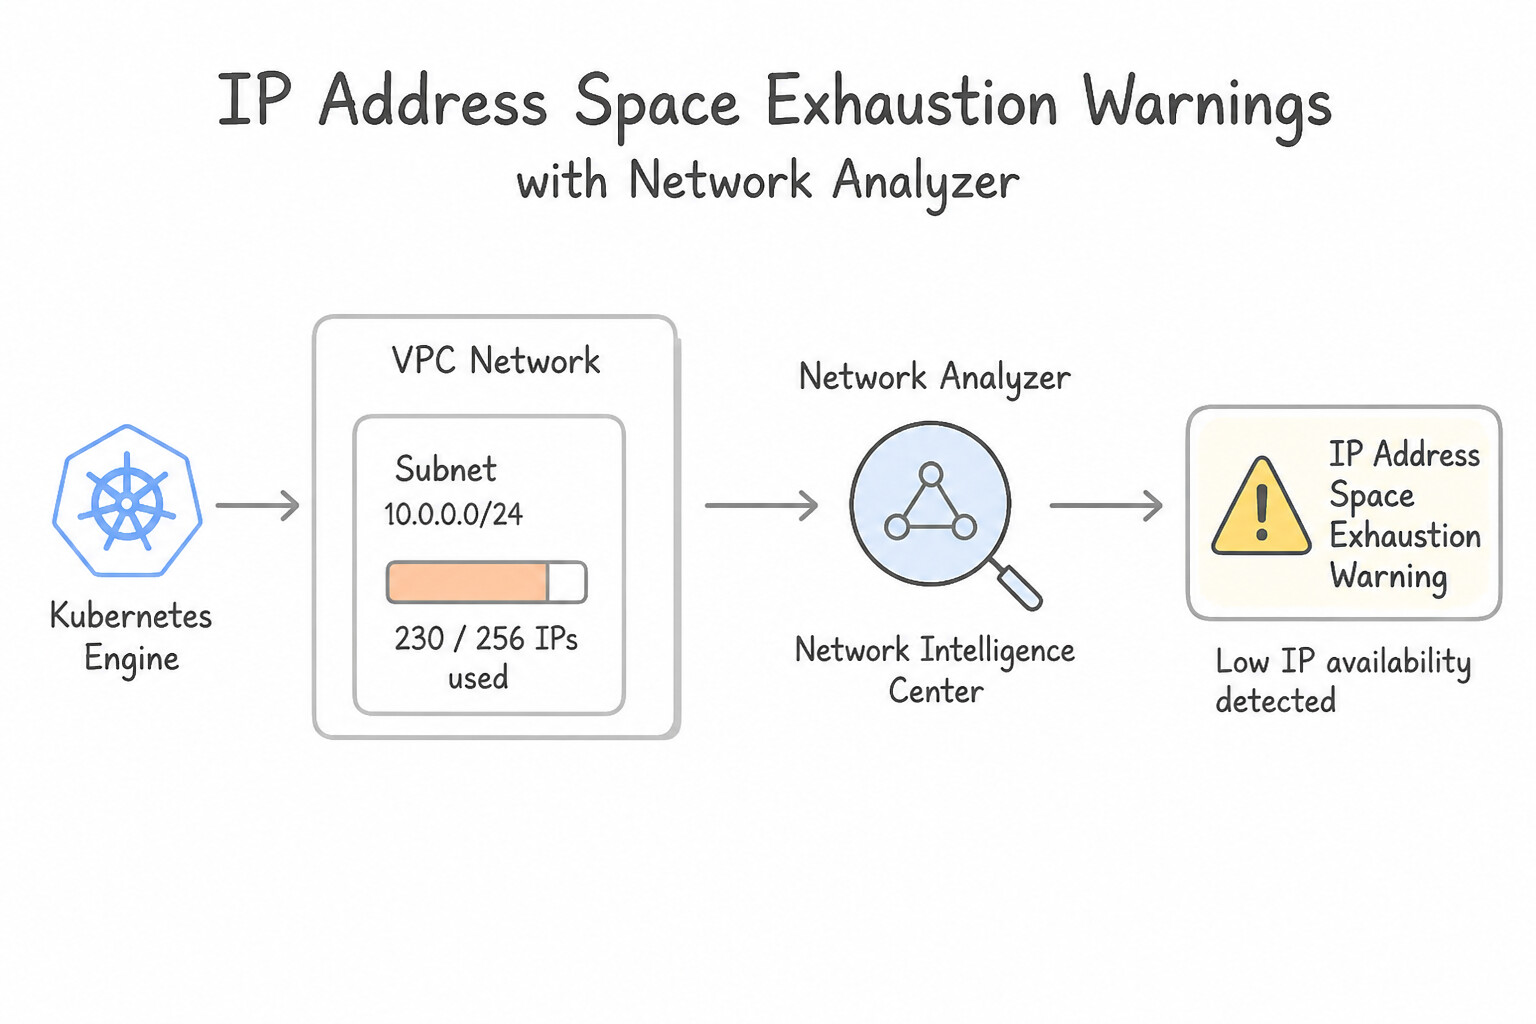
Network Analyzer runs continuously and automatically in the background (publishing findings to Cloud Logging and Cloud Monitoring as networkanalyzer.googleapis.com insights) to catch misconfigurations and resource exhaustion before they cause an outage:
- IP Address Space Exhaustion Warnings:
- Automatically monitors IP utilization across VPC Subnets, GKE Node & Pod secondary alias IP ranges, and Private Service Access (PSA) allocated ranges (for Cloud SQL / Memorystore). Fires Medium/High priority insights when a subnet or GKE Pod range exceeds 80% allocation (and Critical at 95–100% when GKE autoscaler fails to schedule new Pods/Nodes).
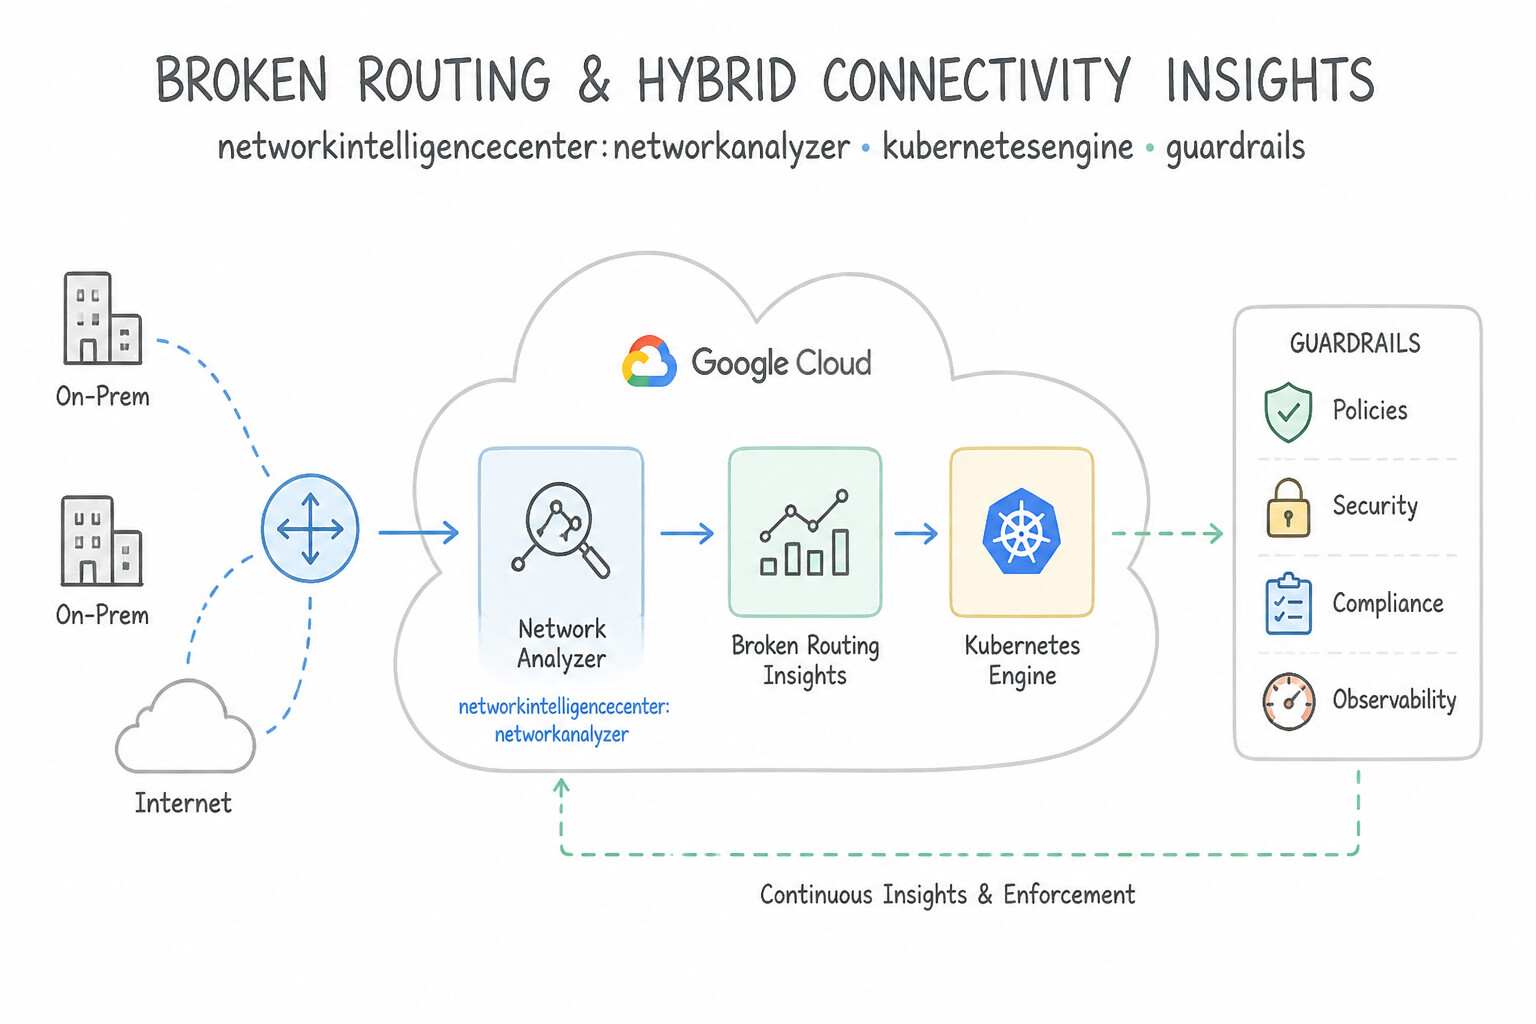
- Broken Routing & Hybrid Connectivity Insights:
- Detects Next-Hop Failure (a custom static route pointing to a deleted, stopped, or unassigned next-hop VM or a down VPN tunnel), Shadowed Routes, Dynamic Route Quota Approaching Limit, and Asymmetric Routing risks on Cloud Interconnect/VPN.
- Load Balancing & GKE Misconfiguration Insights:
- Automatically flags Load Balancer Health Check Firewall Not Configured (when a firewall rule blocks Google health check probers
35.191.0.0/16and130.211.0.0/22from reaching backend VMs/GKE nodes!), GKE Control Plane to Node Connectivity Blocked (when webhooks/metrics-server ports from the GKE control plane CIDR are blocked by VPC firewall rules), and Cloud NAT Port Exhaustion / Suboptimal NAT Configuration.
Key Implementation Patterns
- Network Intelligence Center component that proactively detects and alerts on IP address: Use Network Analyzer. Network Analyzer provides automated monitoring and proactive alerts for IP address exhaustion in VPC and GKE subnets. (Avoid alternative: Cloud Armor provides DDoS and WAF security filtering, not subnet IP address capacity monitoring.)
Key Takeaways (5.3e)
- Network Analyzer continuously evaluates VPC network health and automatically surfaces proactive alerts and recommendations.
- Network Analyzer includes dedicated insight checks for GKE, including IP address exhaustion across primary subnet ranges (nodes) and secondary subnet ranges (Pods and Services).
- Flow Analyzer inspects VPC Flow Logs, while Network Topology visualizes network graphs and performance metrics.
Consideration 5.3f: Using Flow Analyzer and VPC Flow Logs to evaluate network traffic
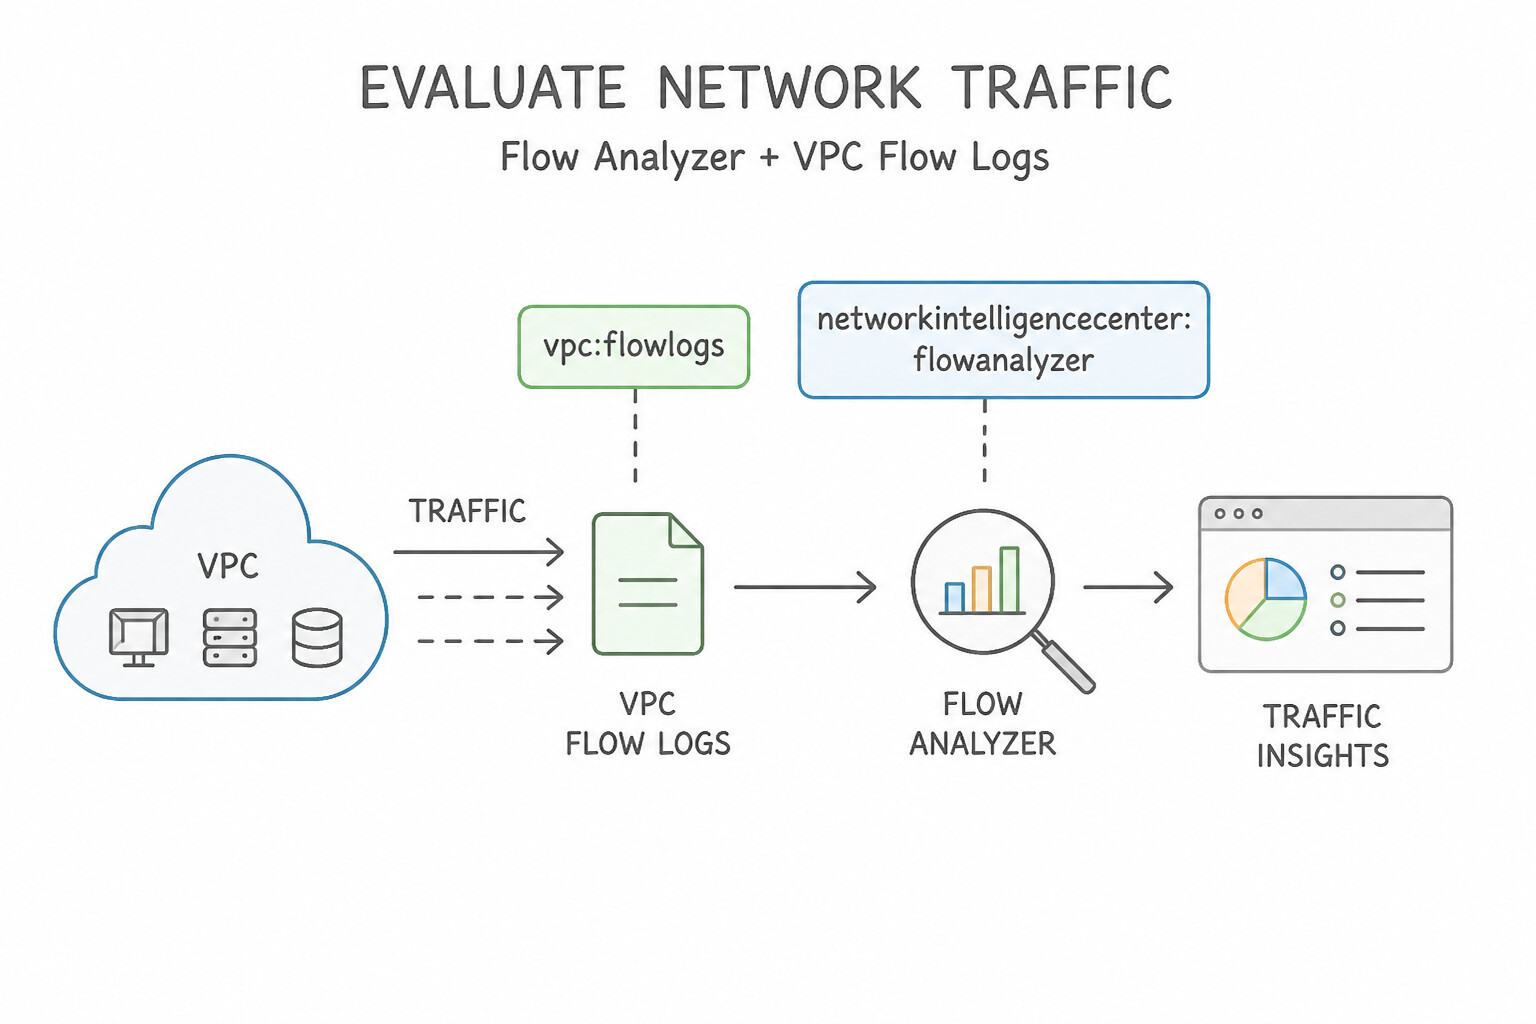
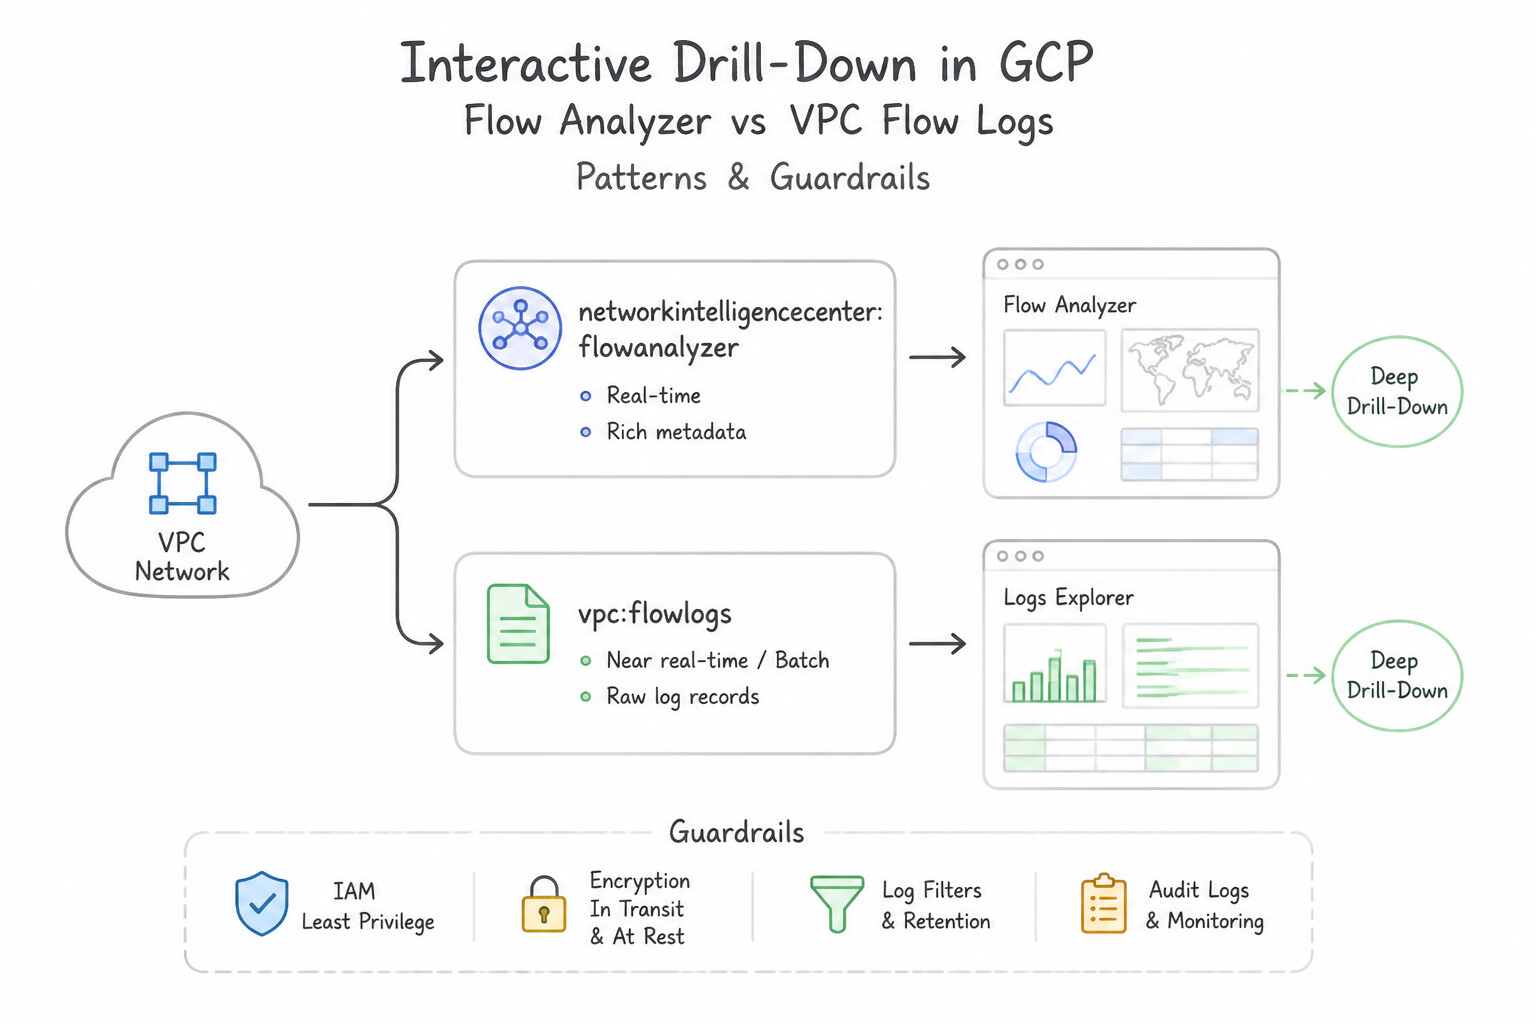
Flow Analyzer (part of Network Intelligence Center, powered by Cloud Logging Log Analytics on _Default or custom log buckets upgraded to Log Analytics) turns raw VPC Flow Logs into an interactive multidimensional traffic explorer without requiring you to write complex BigQuery SQL from scratch:
- Prerequisites: VPC Flow Logs must be enabled on the target subnets/VPCs, and the Cloud Logging bucket receiving
compute.googleapis.com/vpc_flowsmust have Log Analytics enabled. - Interactive Drill-Down Capabilities:
- Filter and group traffic by 5-Tuple (
src_ip,dest_ip,src_port,dest_port,protocol), Google Cloud Resource Metadata (VPC, Subnet, Zone, Region, VM Instance Name, GKE Cluster, GKE Namespace, GKE Pod/Workload), or External Geography / ASN. - Top Talkers & Bandwidth Spike Attribution: Instantly ranks the top N source-destination pairs by Total Bytes or Avg/Peak Throughput (bps/pps) over any time window.
- How to Distinguish
Flow Analyzervs.Network Topologyin Production: - Choose Network Topology (5.3a) when you want an architectural dependency map showing how VPCs, Load Balancers, GKE clusters, and Regions connect at a high level with overlaid latency/RPS.
- Choose Flow Analyzer (5.3f) when you need to slice and dice VPC Flow Logs by exact IP addresses, TCP/UDP port numbers, protocols, or specific GKE Pod/VM top talkers to investigate a sudden bandwidth bill spike or anomalous port scan.
Key Implementation Patterns
- Network Intelligence Center module designed specifically for interactive querying: Use Flow Analyzer. Flow Analyzer is specifically designed to provide interactive exploration, visualization, and filtering of VPC Flow Logs. (Avoid alternative: Connectivity Tests performs static configuration checks and active probes to test reachability, not flow log analysis.)
Key Takeaways (5.3f)
- Flow Analyzer is the designated interactive visualization and filtering tool for VPC Flow Logs in Network Intelligence Center.
- Connectivity Tests evaluates end-to-end network reachability through static policy modeling and active probing.
- Network Topology shows high-level cross-resource and cross-region visual connections and bandwidth utilization.
- Performance Dashboard focuses on latency and packet loss trends across Google Cloud zones, regions, and internet endpoints.
Quick Decision Cheat Sheet (Subsection 5.3)
If the Scenario Requires... | Choose This Google Cloud Pattern | Avoid This Common Mistake |
|---|---|---|
"Visual map of traffic throughput between VPCs, regions, GKE clusters, and Load Balancer backend latency" | Network Topology ( 5.3a) | Performance Dashboard or manual Cloud Monitoring charts |
"Pinpoint the exact firewall rule or route blocking traffic between a GKE Pod and an on-premises IP (or stopped VM)" | Connectivity Tests ( 5.3b) | Flow Analyzer (cannot see packets dropped by ingress firewalls or simulate stopped VMs) |
"Connectivity Test across a Shared VPC or peered projects shows Unverified for intermediate hops" | Grant roles/networkmanagement.viewer in all projects traversed by the packet path | Enabling Packet Mirroring on the Shared VPC host project |
"Distinguish project-specific VM packet loss from a Google Cloud-wide regional backbone outage" | Performance Dashboard ( 5.3c) | Network Analyzer (analyzes control-plane configuration errors, not live backbone vs project packet loss) |
"Find shadowed firewall rules, zero-hit rules, and tighten overly broad tcp:0-65535 rules using ML predictions" | Firewall Insights ( 5.3d) | Cloud Security Command Center alone (does not provide ML-based unused port/subnet attribute predictions) |
"Automated continuous detection of GKE Pod IP exhaustion (>80%), broken next-hop routes, or missing LB health check rules" | Network Analyzer ( 5.3e) | Writing custom Python cron scripts to poll gcloud compute networks subnets describe |
"Interactive drill-down on VPC Flow Logs by exact port, protocol, IP, and GKE Pod to find top talkers" | Flow Analyzer ( 5.3f) (with Log Analytics enabled on the log bucket) | Network Topology (does not break down flows by raw TCP/UDP port numbers) |
Further Reading (Subsection 5.3)
- Network Topology overview — Describes how Network Topology visualizes VPC networks, hybrid connections, traffic volumes, and data transfer costs.
- Network Intelligence Center overview — Provides an architectural overview of all Network Intelligence Center modules, including Network Topology, Connectivity Tests, and Network Analyzer.
- Connectivity Tests overview — Describes how Connectivity Tests performs static configuration analysis and dynamic packet probing to evaluate network paths.
- Dynamic probing overview — Details how dynamic probing injects live probe packets into the network to test data-plane connectivity and validate TCP handshake responses.
- Network Intelligence Center overview — Explains the comprehensive suite of diagnostic and visualization modules including Network Topology, Connectivity Tests, Performance Dashboard, and Firewall Insights.
- Performance Dashboard overview — Provides detailed information about how Performance Dashboard monitors inter-region and intra-zone packet latency and packet loss across Google Cloud.
Book TOC · Previous · Chapter 6 of 8 · Next
AwesomeGCP.com Learning
The approach taken is a question-led learning approach: you explore realistic project scenarios where you need to make decisions or take actions to achieve business goals within specific constraints. Instead of passive learning, you are challenged to think and work through the options to master the Professional Cloud Network Engineer (PCNE) certification!