Book TOC · Previous · Chapter 6 of 8 · Next
Chapter 6: Cloud Observability: Monitoring, Logging Pipelines, Audit Logs & Diagnostics
Chapter Focus: Ops Agent, custom metrics, alerting policies, Uptime checks, Cloud Logging sinks (BigQuery, Storage, Pub/Sub), Cloud Audit Logs, Cloud Trace, and Cloud Hub.
Subsection 3.4: Monitoring and Logging
The Big Picture
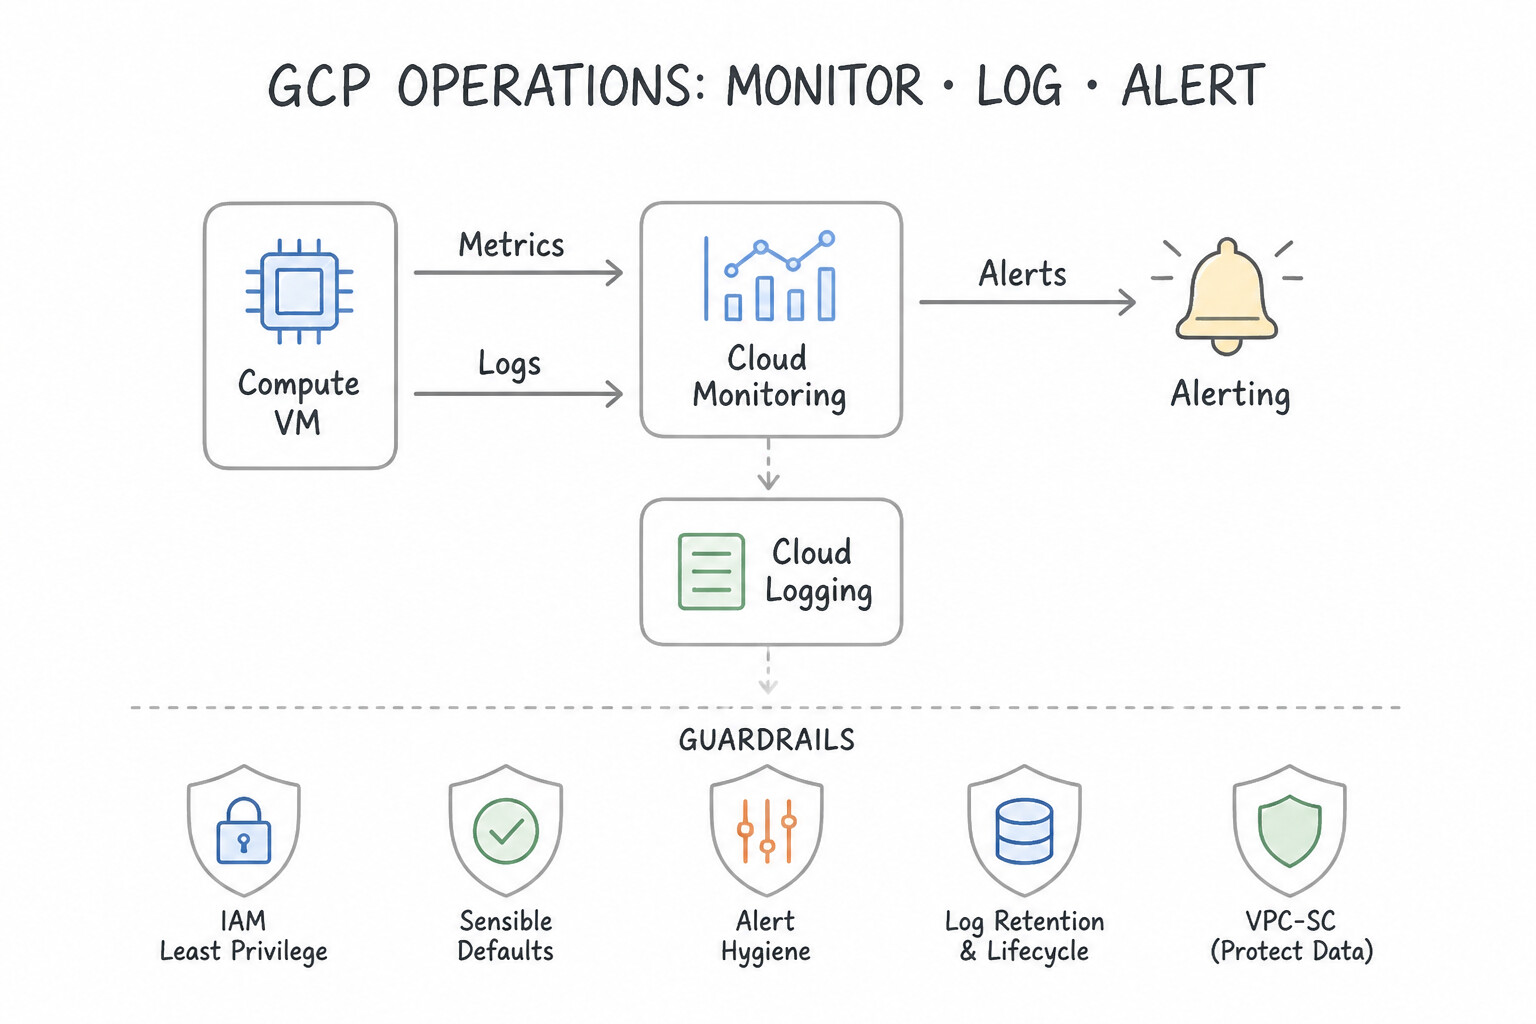
Out of the box, Google Cloud automatically collects hypervisor-level VM metrics (CPU utilization, disk I/O bytes, network packets) and Admin Activity audit logs. However, engineering teams that rely solely on default settings get blindsided during real production outages for four reasons:
- The Missing RAM & Disk Space Metric Trap (
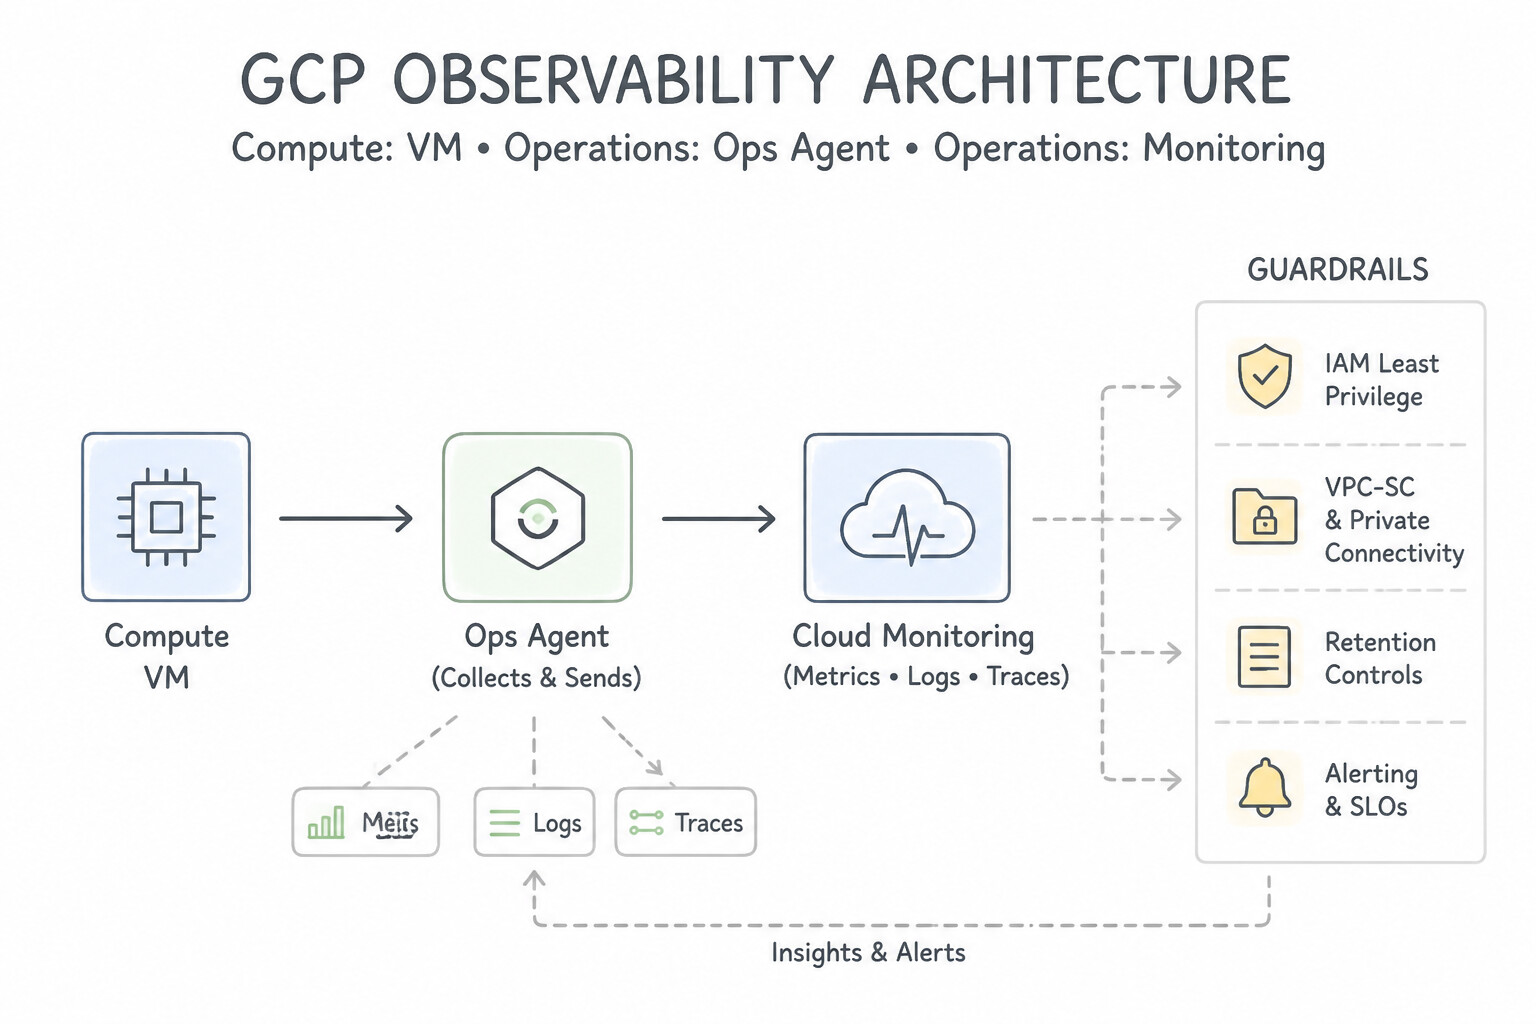
3.4a,3.4b,3.4j): Because the Compute Engine hypervisor cannot look inside a guest operating system's kernel memory table or mounted filesystem without violating isolation, Compute Engine does NOT report VM Memory (RAM) utilization or free disk space (% used) by default! To monitor or alert on VM memory or disk utilization, or to tail application log files (/var/log/nginx/access.log), you must install the unified Google Cloud Ops Agent on the VM. - The Audit Log Blindness & Log Retention Cost Trap (
3.4c,3.4d,3.4e):Admin Activityaudit logs (who created/deleted a resource) are always on and free, butData Accessaudit logs (who read an object in Cloud Storage or queried a sensitive BigQuery table) are disabled by default (except for BigQuery) because they can generate high volume and ingestion costs. Similarly, leaving 10 TB of compliance logs in the_Defaultlog bucket with custom 7-year retention costs far more than routing them via a Log Router Sink to a Cloud Storage Archive bucket (for cold compliance) or upgrading a Log Bucket to Log Analytics (for zero-ETL SQL analysis in BigQuery). - The Wrong Diagnostic Tool Trap (
3.4f,3.4g,3.4h): UsingCloud Profilerwhen you need to find which microservice hop in a 12-service call chain added 800ms of network latency (where Cloud Trace is required), or usingCloud Tracewhen a single Java service is burning 95% CPU in a tight loop (where Cloud Profiler flame graphs identify the exact function), or manually guessing missing database indexes instead of checking Cloud SQL / AlloyDB Query Insights & Index Advisor. - The Modern 2026 Observability Ecosystem (
3.4i,3.4k–3.4n): Not knowing when to use Google Cloud Managed Service for Prometheus (GMP) (for PromQL monitoring on GKE without managing Prometheus storage servers), Personalized Service Health (for project-specific Google Cloud outage alerts), Active Assist (for idle VM and over-privileged IAM right-sizing), Gemini Cloud Assist for Monitoring (for natural-language incident summarization), and Cloud Hub (for unified application-centric health, active incidents, capacity, and deployment tracking).
Consideration 3.4a: Creating cloud monitoring alerts
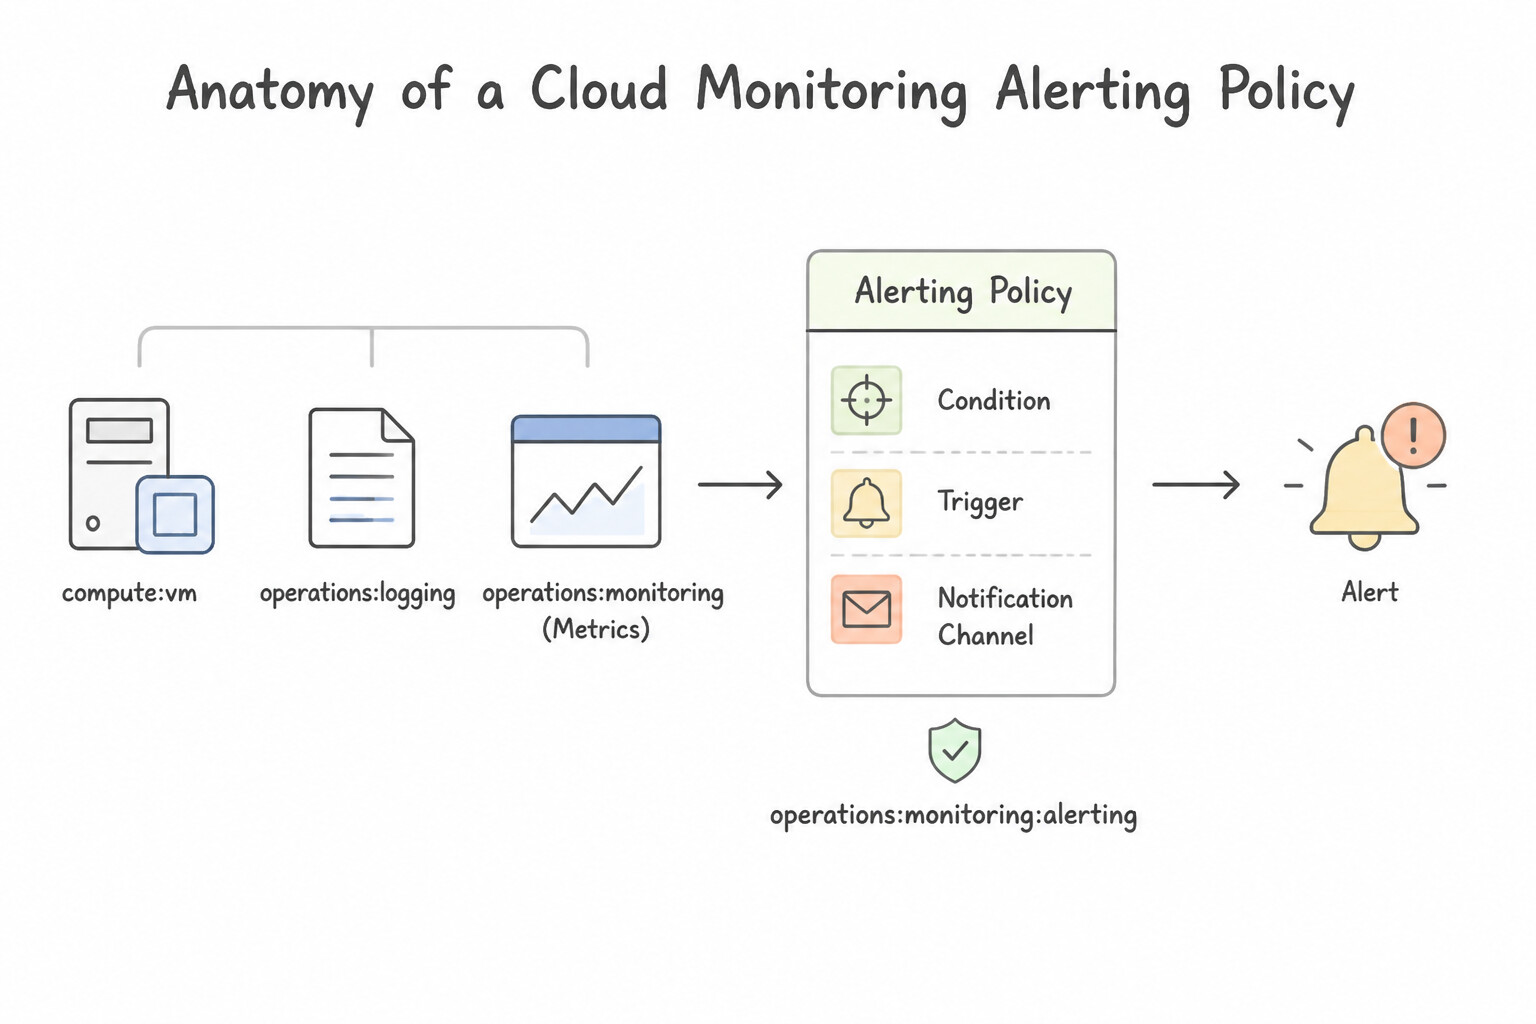
- Anatomy of a Cloud Monitoring Alerting Policy:
- Condition (What to Watch): A time-series metric (e.g.,
compute.googleapis.com/instance/cpu/utilization), an Uptime Check (global external or private internal HTTP/TCP synthetic probe), a PromQL query, or a Log-Match Condition (fires immediately when a specific log entry appears, such as an audit log of a firewall edit). - Alignment & Duration Window: Define an Aligner (e.g.,
mean,max,99th percentileover 5 minutes) and a Duration (e.g., condition must hold continuously for10 minutes) so brief 2-second spikes do not wake up the on-call engineer at 3 AM. - Notification Channels & Documentation: Route alerts to Email, SMS, PagerDuty, Slack, Webhooks, or Pub/Sub, and include Markdown runbook instructions in the alert payload.
Key Implementation Patterns
- Basic Infrastructure Threshold Alert: Use In Cloud Monitoring, create an Alerting Policy using the "VM Instance - CPU utilization" metric. Set the condition to be above a threshold of 90% for a duration of 5 minutes. Add an email notification channel. Use Cloud Monitoring Alerting Policies with the CPU utilization metric, a 90% threshold, and a 5-minute duration window.
- Log-Based Alerting for Application Errors: Use Create a log-based alert policy that uses a query to match the "CRITICAL_PAYMENT_FAILURE" string. Log-based alerts trigger notifications when specific text patterns appear in Cloud Logging. (Avoid alternative: BigQuery exports and scheduled queries introduce latency and are not suitable for immediate alerting.)
- External Availability Monitoring: Use Create an Uptime Check in Cloud Monitoring for the website's public URL. Configure the check to use the specified source regions and create an alerting policy. Uptime Checks specifically test external availability from global locations and support alerting policies.
Key Takeaways (3.4a)
- Cloud Monitoring is the managed service for observability in Google Cloud.
- Alerting Policies require a Metric, a Condition (Threshold + Duration), and a Notification Channel.
- Use 'Duration' or 'Retest Window' settings to prevent alerts on transient spikes.
- Uptime checks monitor reachability, while metrics monitor performance/resource usage.
Consideration 3.4b: Creating and ingesting custom metrics
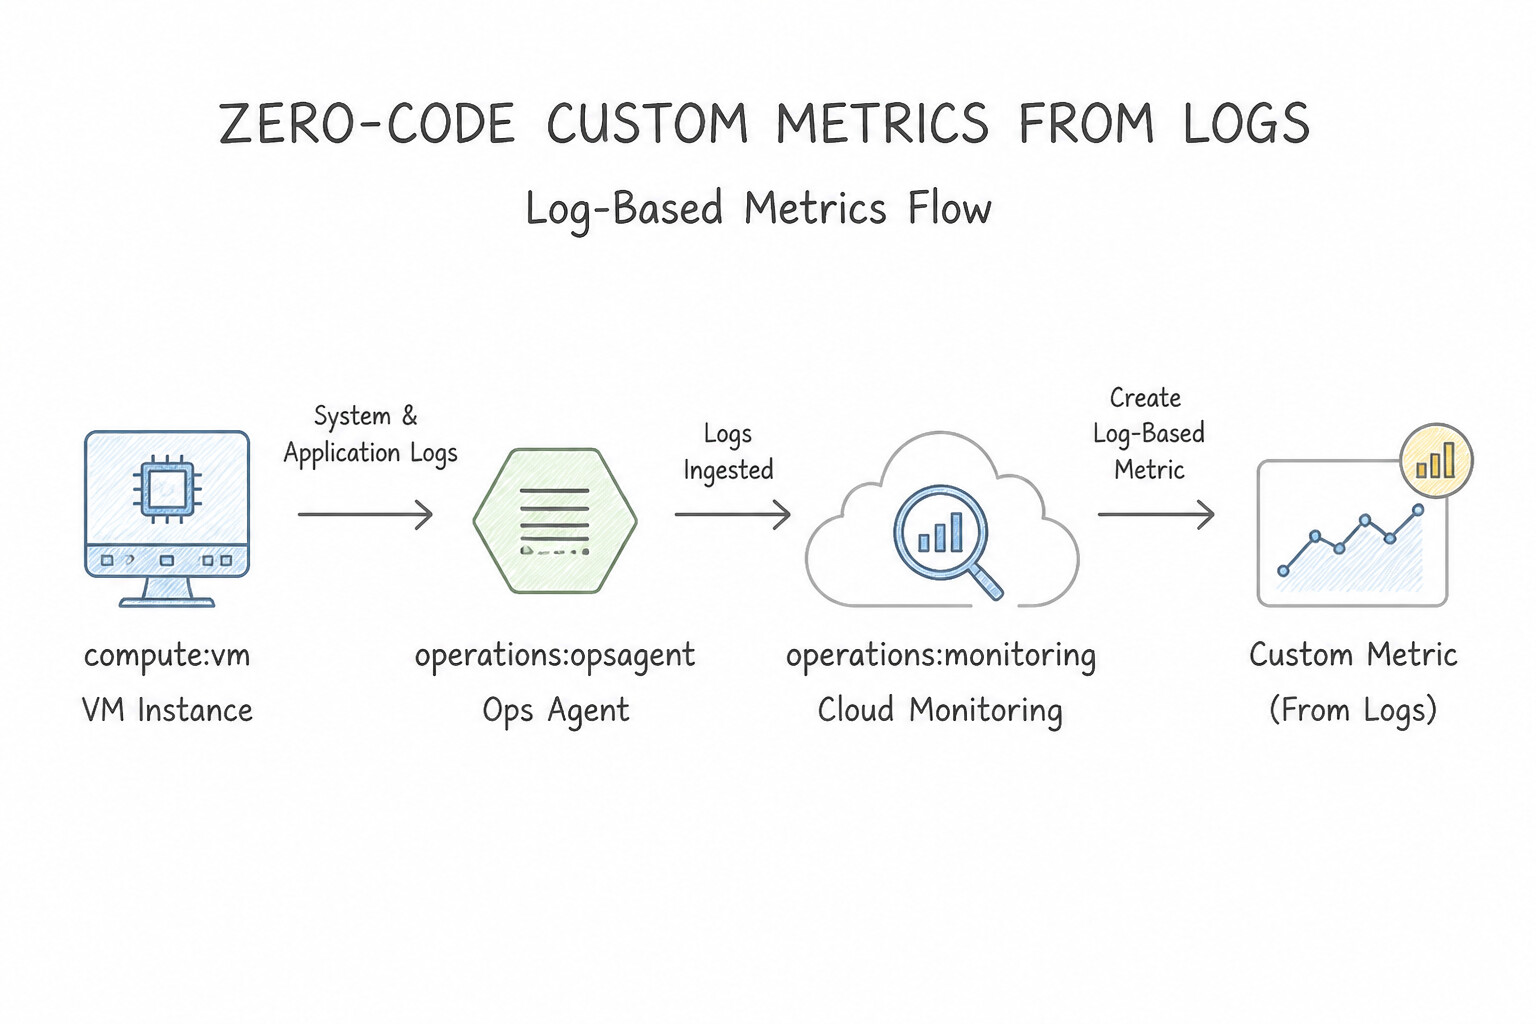
- Log-Based Metrics (Zero-Code Metrics from Logs):
- When an application writes structured or unstructured text logs (e.g.,
"Payment declined: gateway_timeout"or"Checkout latency: 420ms") and you cannot modify its source code to emit metrics directly, create a Log-Based Metric in Cloud Logging: - Counter Metric: Counts the number of log entries matching a filter (ideal for error rates,
HTTP 500counts, or security events). - Distribution Metric: Extracts a numeric field from matching log entries using a regular expression (ideal for tracking p50/p95/p99 latency histograms from log lines).
- Important: Log-based metrics are calculated at ingestion time inside the Log Router—so even if you exclude noisy logs from being stored in a Log Bucket to save storage costs, your Log-Based Metrics still count them!
Key Implementation Patterns
- Ingesting OS-Level Metrics for GCE: Use Install the Google Cloud Ops Agent on each VM instance. Default metrics come from the hypervisor; memory and disk space usage are OS-level metrics requiring the Google Cloud Ops Agent. (Avoid alternative: VPC Flow Logs monitor network traffic samples, not compute resource utilization like memory or disk space.)
- Application-Specific Business Metrics: Use Instrument your application code using the Cloud Monitoring Client Library for Python to write timeSeries data. Use the Cloud Monitoring Client Library to programmatically send custom business metrics directly from your application code.
- Selecting Metric Kinds: Use Configure the metric kind as GAUGE and the value type as DOUBLE. Gauge metrics store instantaneous values that can rise or fall, making them ideal for temperature readings. (Avoid alternative: Cumulative metrics are for strictly increasing values like counters, not for fluctuating values.)
Key Takeaways (3.4b)
- Default Compute Engine metrics are limited to what the hypervisor sees (CPU, Network, Disk I/O).
- To see inside the OS (Memory, Disk Space), you must install the Google Cloud Ops Agent.
- The Ops Agent unifies logging and metric collection into a single binary.
- Use Cloud Monitoring Client Libraries to create and send custom metrics from application code.
Consideration 3.4c: Exporting logs to external systems
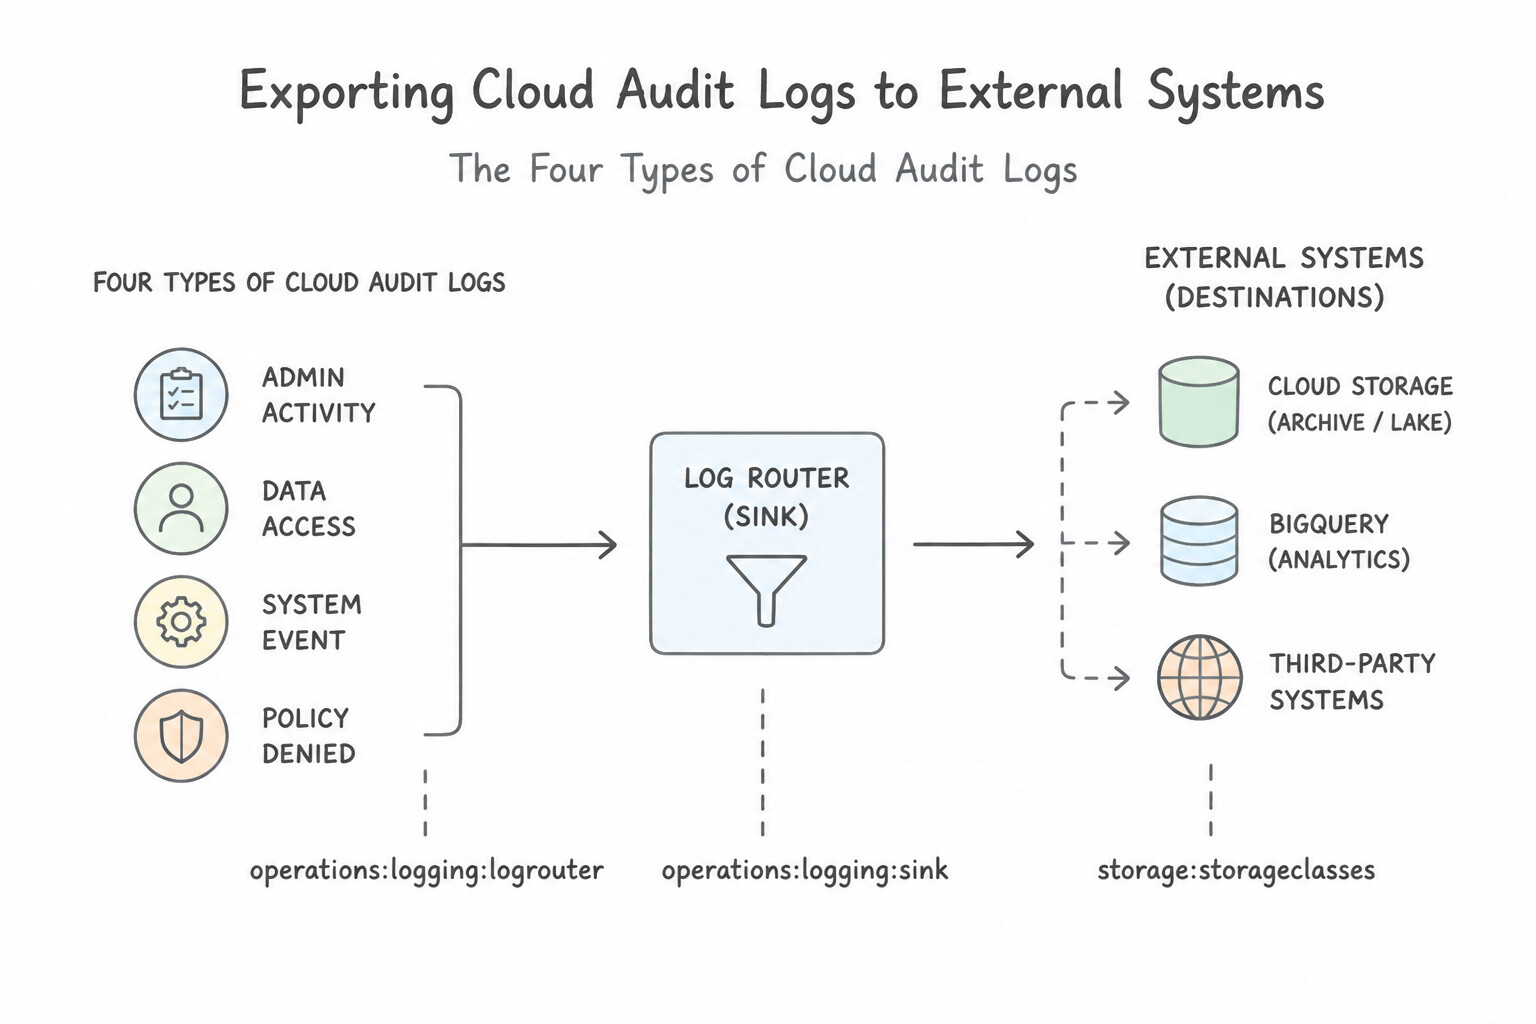
- The Four Types of Cloud Audit Logs:
- Admin Activity (
cloudaudit.googleapis.com/activity): Records control-plane mutations (creating/deleting VMs, changing IAM policies). Always enabled, free of charge, retained for 400 days, cannot be disabled. - System Event (
cloudaudit.googleapis.com/system_event): Records Google-initiated actions (Live Migration, Spot VM preemption). Always enabled, free, retained for 400 days. - Policy Denied (
cloudaudit.googleapis.com/policy): Records when a security policy (such as VPC Service Controls or IAM Deny) blocks access. Enabled by default, billed at standard Cloud Logging ingestion rates (can be excluded), retained for 30 days. - Data Access (
cloudaudit.googleapis.com/data_access): RecordsADMIN_READ,DATA_READ, andDATA_WRITEoperations (who read an object in GCS or wrote a row in Spanner). Disabled by default (except for BigQuery) because of high volume and cost. Must be explicitly enabled per service in IAM & Admin → Audit Logs (with optional Exempted Principals for high-volume trusted service accounts). - Network Telemetry Logs:
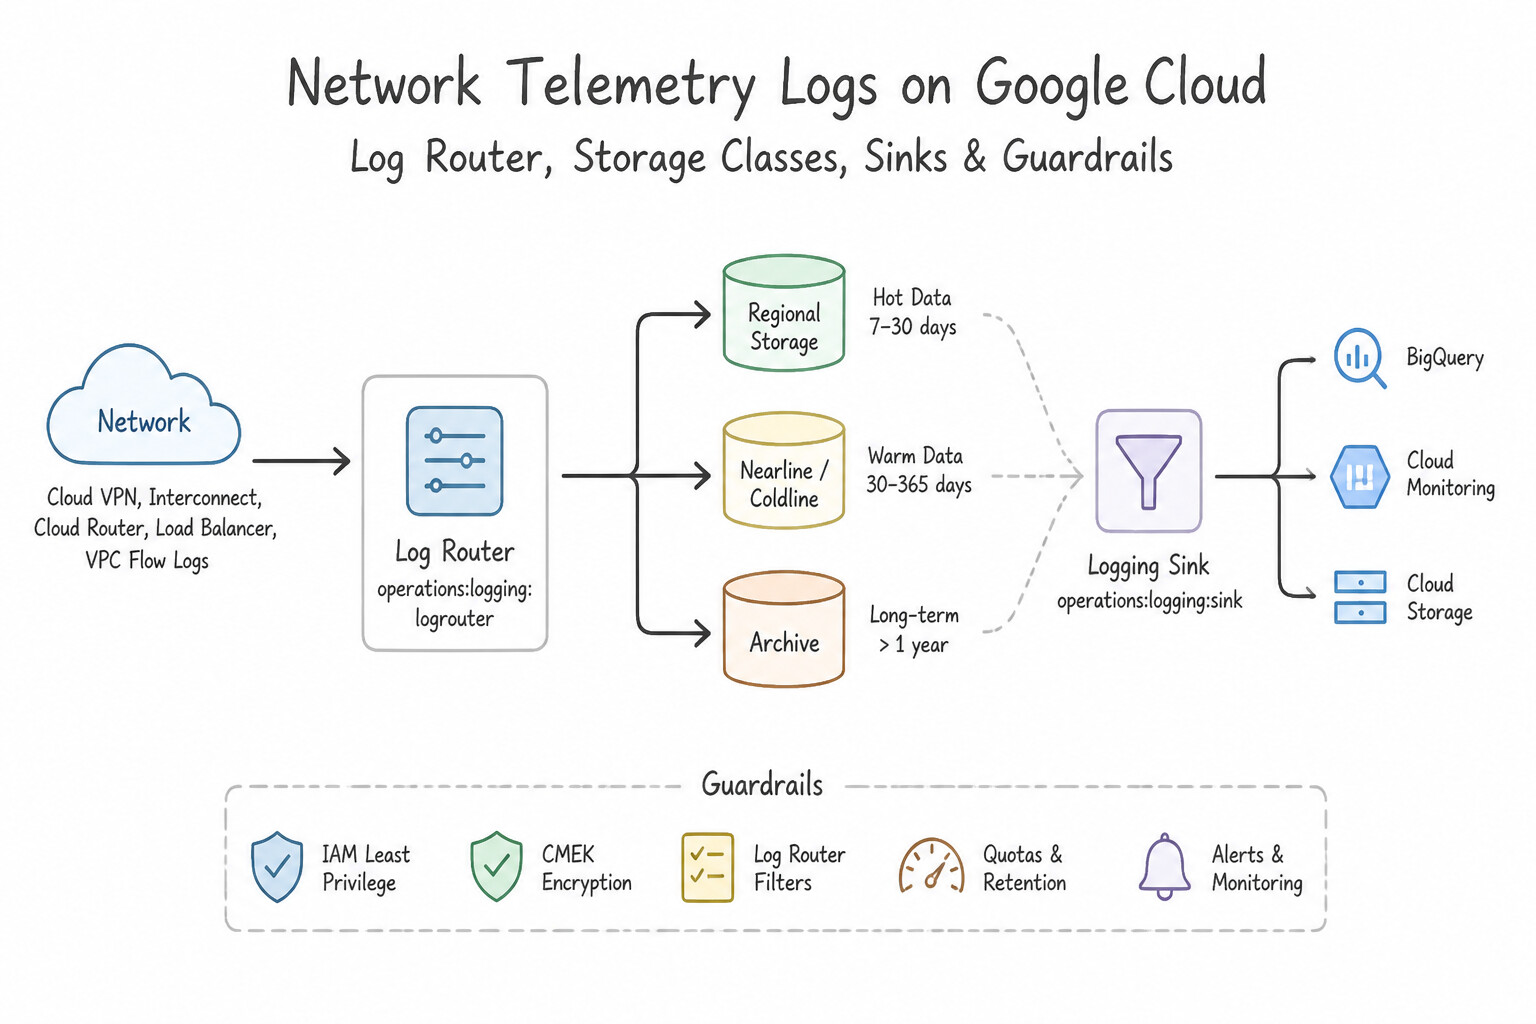
- VPC Flow Logs: Enabled at the VPC Subnet level (
--enable-flow-logs). Captures sampled TCP/UDP/ICMP flow metadata without adding any packet latency. - Firewall Rule Logs: Enabled per Firewall Rule (
--enable-logging) to audit which specific rule allowed or denied a connection.
Key Implementation Patterns
- Cost-Effective Long-Term Retention: Use Create a Log Router sink with a Cloud Storage bucket as the destination. Configure the bucket with the Archive storage class. Cloud Storage Archive class offers the lowest cost for long-term retention of data that is rarely accessed.
- Real-time SQL Analysis of Logs: Use Configure the sink to export the logs to a BigQuery dataset. BigQuery allows you to run SQL queries on logs and join them with other data. (Avoid alternative: Cloud Storage is for archival and backup, not for direct SQL analysis.)
- Integration with Third-Party SIEM: Use Create a log sink with a Pub/Sub topic as the destination. Pub/Sub is the dedicated service for real-time message streaming and integration with external systems. (Avoid alternative: Cloud Storage is for long-term archiving and batch processing, not near real-time streaming.)
Key Takeaways (3.4c)
- Use Cloud Storage Archive class for long-term retention of data that is rarely accessed to minimize costs.
- Log Router Sinks are required to export logs from Cloud Logging for retention beyond the default period.
- BigQuery is for analytics; Pub/Sub is for streaming; Cloud Storage is for archival.
- Use Cloud Storage for long-term archival and compliance.
Consideration 3.4d: Configuring log buckets, analytics, and routers
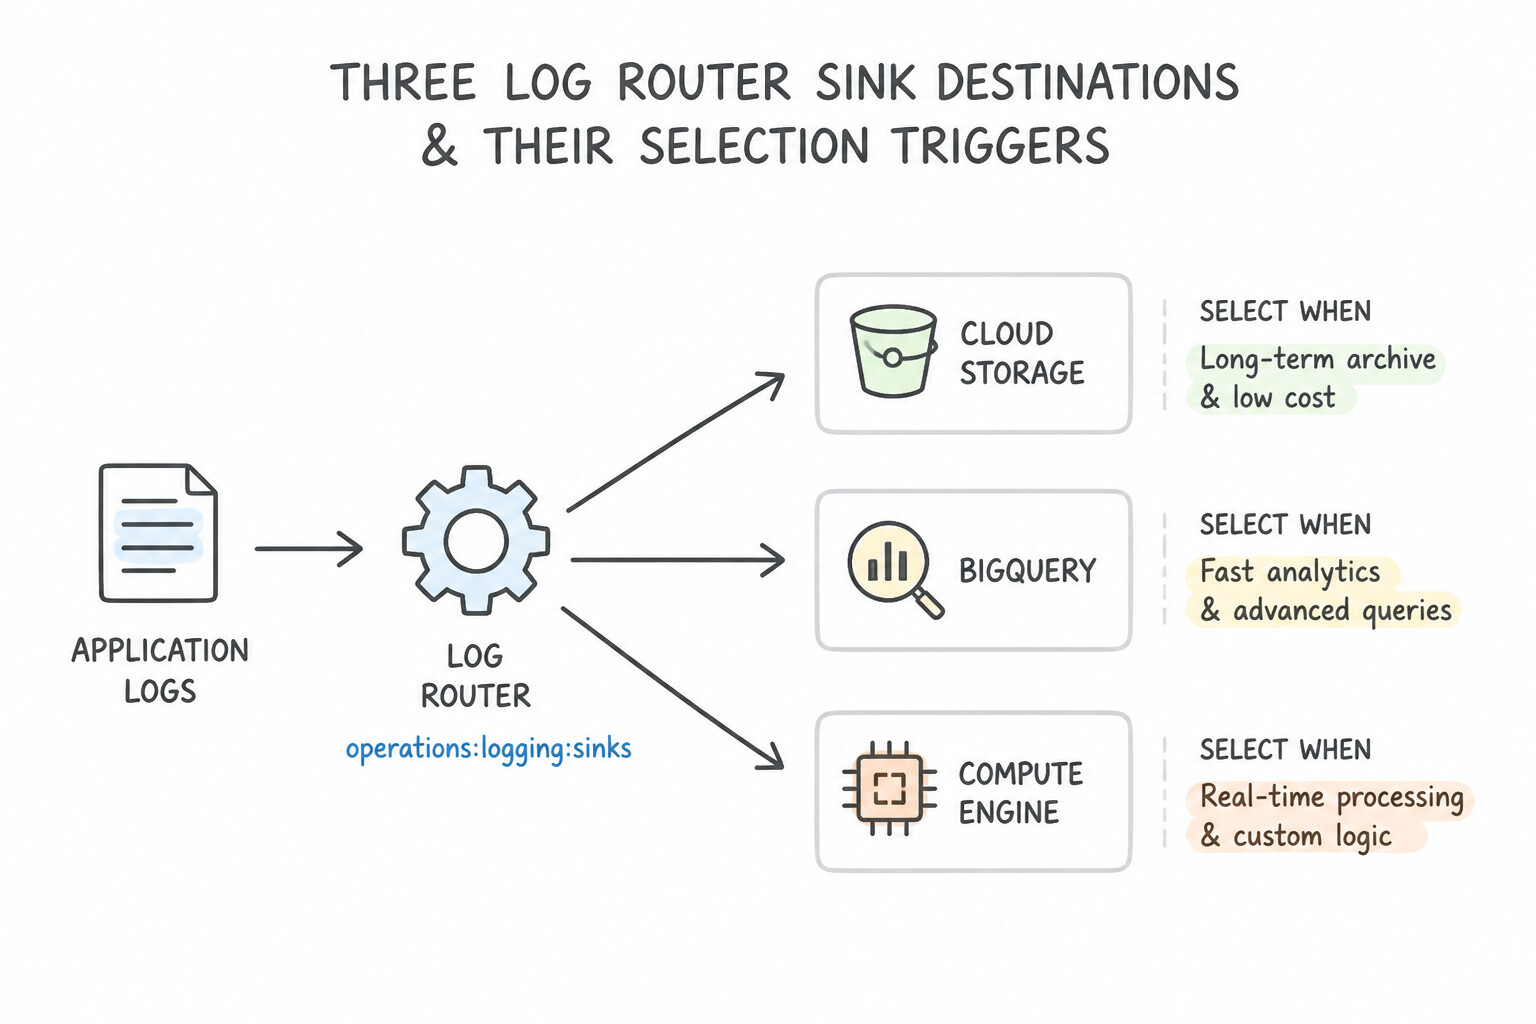
- The Three Log Router Sink Destinations & Their Selection Triggers:
- Cloud Storage Bucket: Lowest-cost destination for long-term archival / regulatory compliance (e.g., 7-year retention in
Archiveclass). Exports logs in hourly JSON batches. - BigQuery Dataset: Best when exporting logs to an external dataset for custom BI dashboards or cross-project SQL joins.
- Cloud Pub/Sub Topic: The universal real-time streaming bridge for exporting logs to external/on-premises SIEMs (Splunk, Datadog, Elastic, Chronicle) or triggering automated remediation functions.
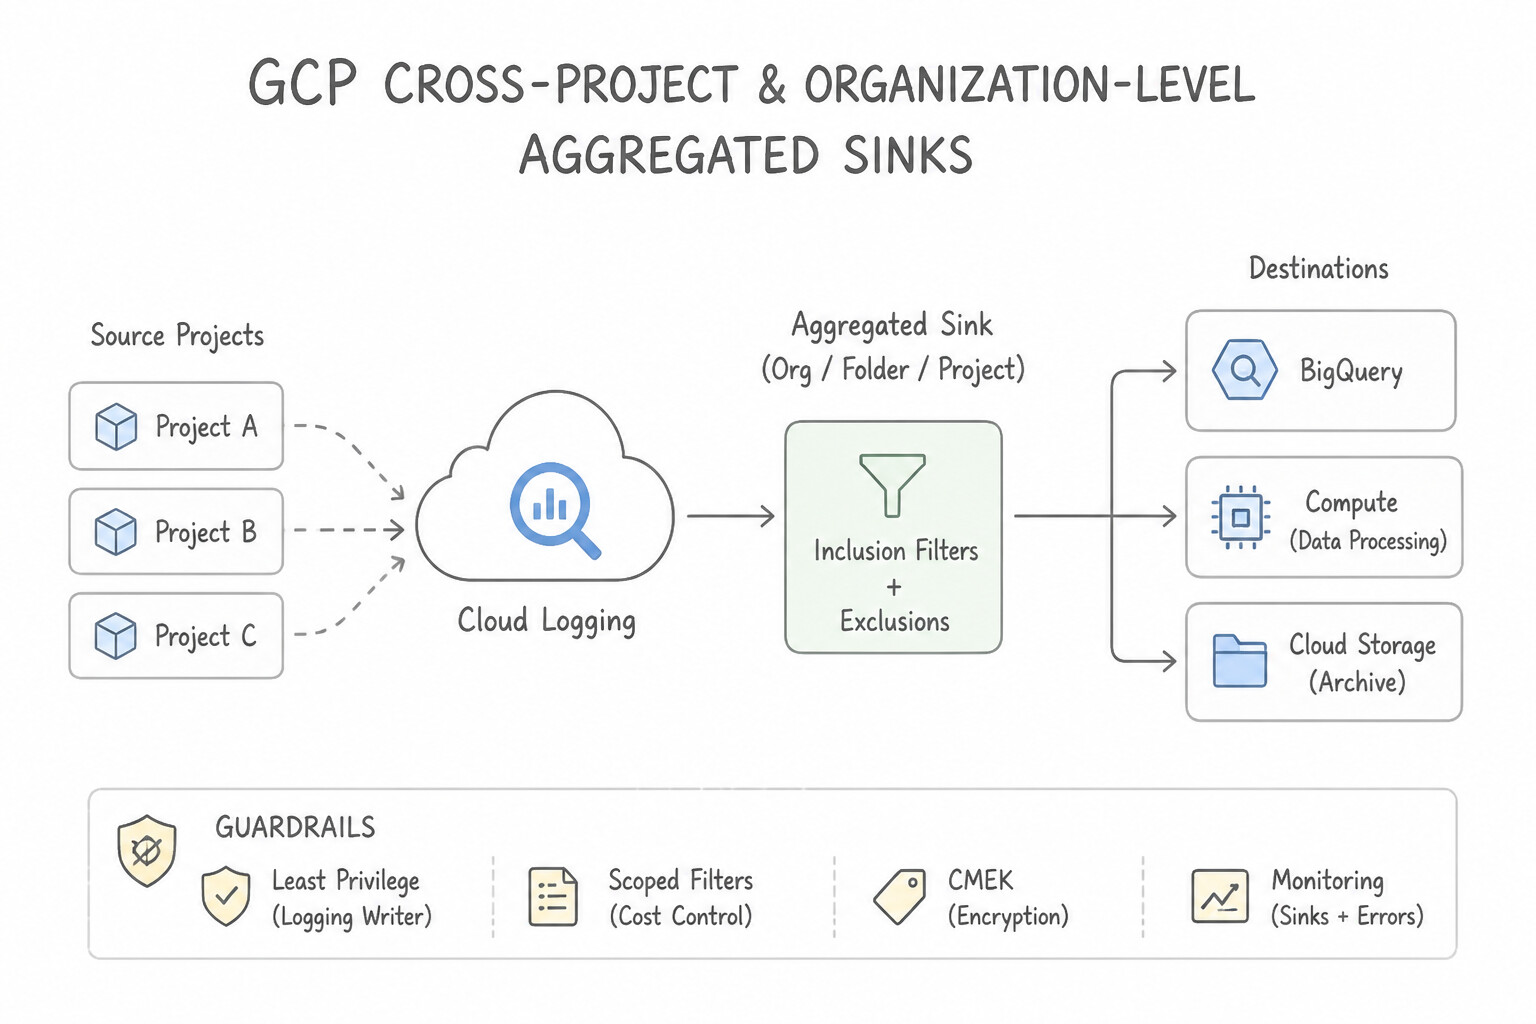
- Cross-Project & Organization-Level Aggregated Sinks: Use
gcloud logging sinks create <SINK> ... --organization=<ORG_ID> --include-childrento route audit logs from every existing and future project in an Organization into a single locked security project. Always grant the sink's Writer Identity (writerIdentityservice account) the required destination role (roles/storage.objectCreator,roles/bigquery.dataEditor, orroles/pubsub.publisher)!
Key Implementation Patterns
- Centralized Organization Logging: Use Create an aggregated log sink at the Organization level. Set includeChildren to true and configure the destination to the BigQuery dataset. Aggregated sinks at the Organization level with includeChildren enabled automatically route logs from all current and future projects to a central destination.
- Cost Optimization via Exclusion: Use Configure an exclusion filter in the
_Defaultsink to discard the health check logs. Exclusion filters in the Log Router prevent specific logs from being ingested into log buckets, directly saving ingestion costs. (Avoid alternative: Exporting logs via a new sink copies them to another destination but does not prevent the original ingestion and associated costs.) - Long-Term Compliance Archiving: Use Create a Log Router sink with a destination of a Cloud Storage bucket. Configure the bucket with the Archive storage class. The Archive storage class offers the lowest cost for data accessed less than once a year, making it perfect for compliance logging.
Key Takeaways (3.4d)
- Aggregated Sinks are the best practice for centralized logging across an Organization or Folder.
- Use includeChildren to automatically capture logs from all current and future child projects.
- Avoid creating resources manually per project when an organization-level feature exists to reduce overhead.
- Supported log sink destinations include Cloud Storage, BigQuery, Pub/Sub, and another Cloud Logging bucket.
Consideration 3.4e: Viewing and filtering logs in cloud logging
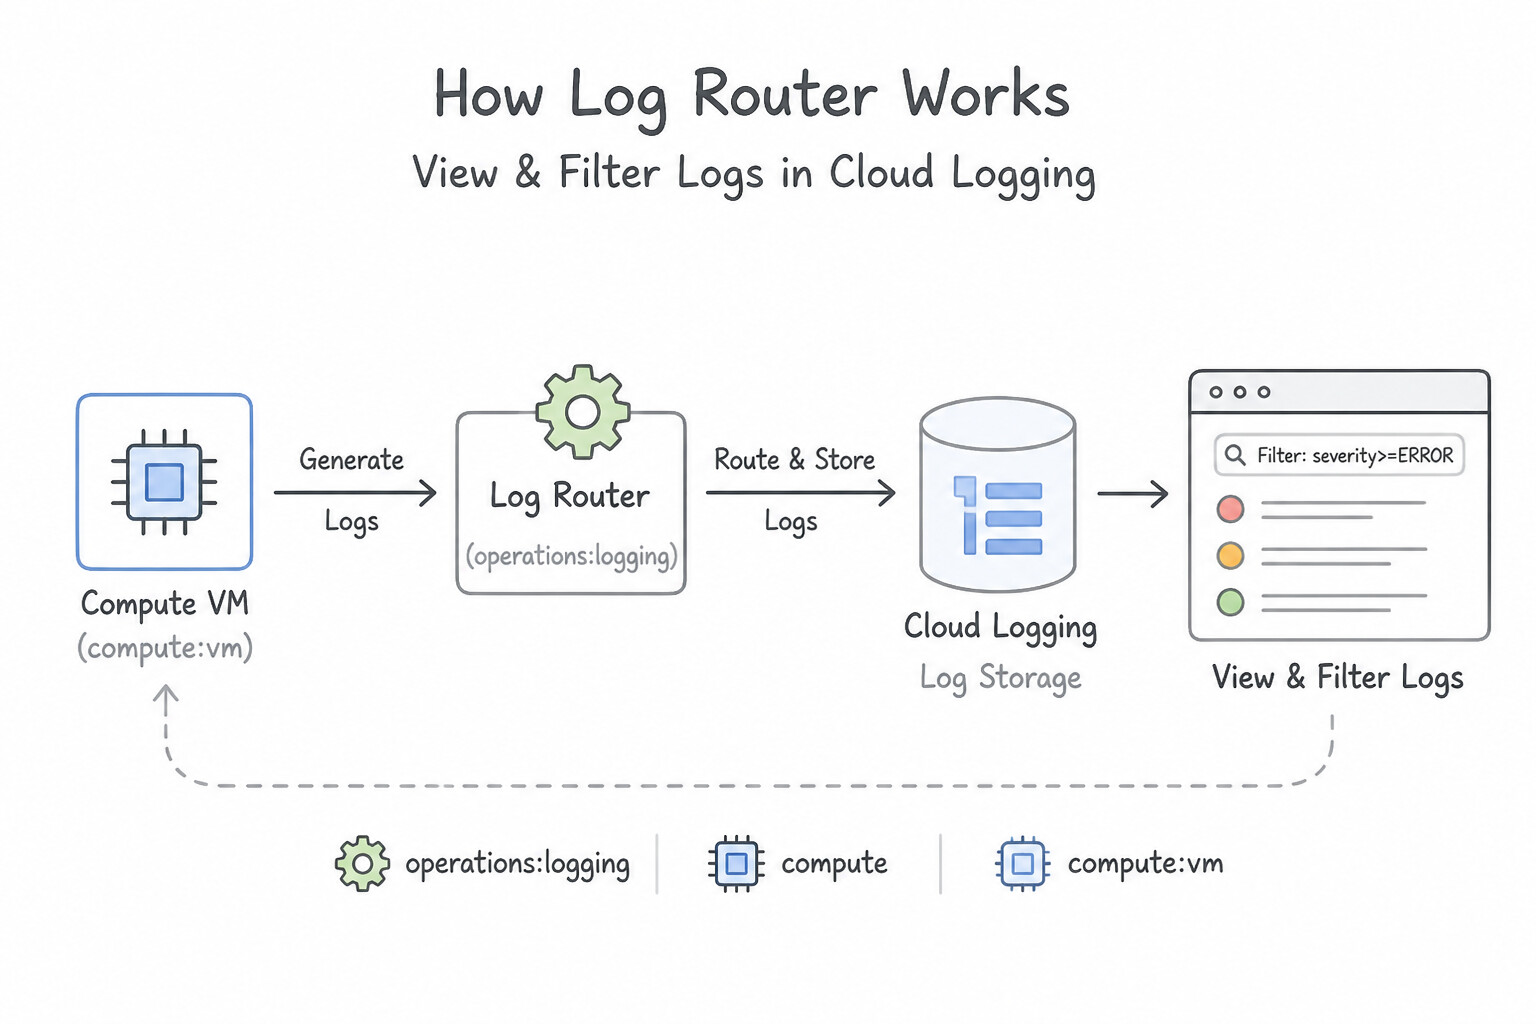
- How the Log Router Works: Every log entry enters the Log Router first, where it is evaluated against all Sinks in parallel:
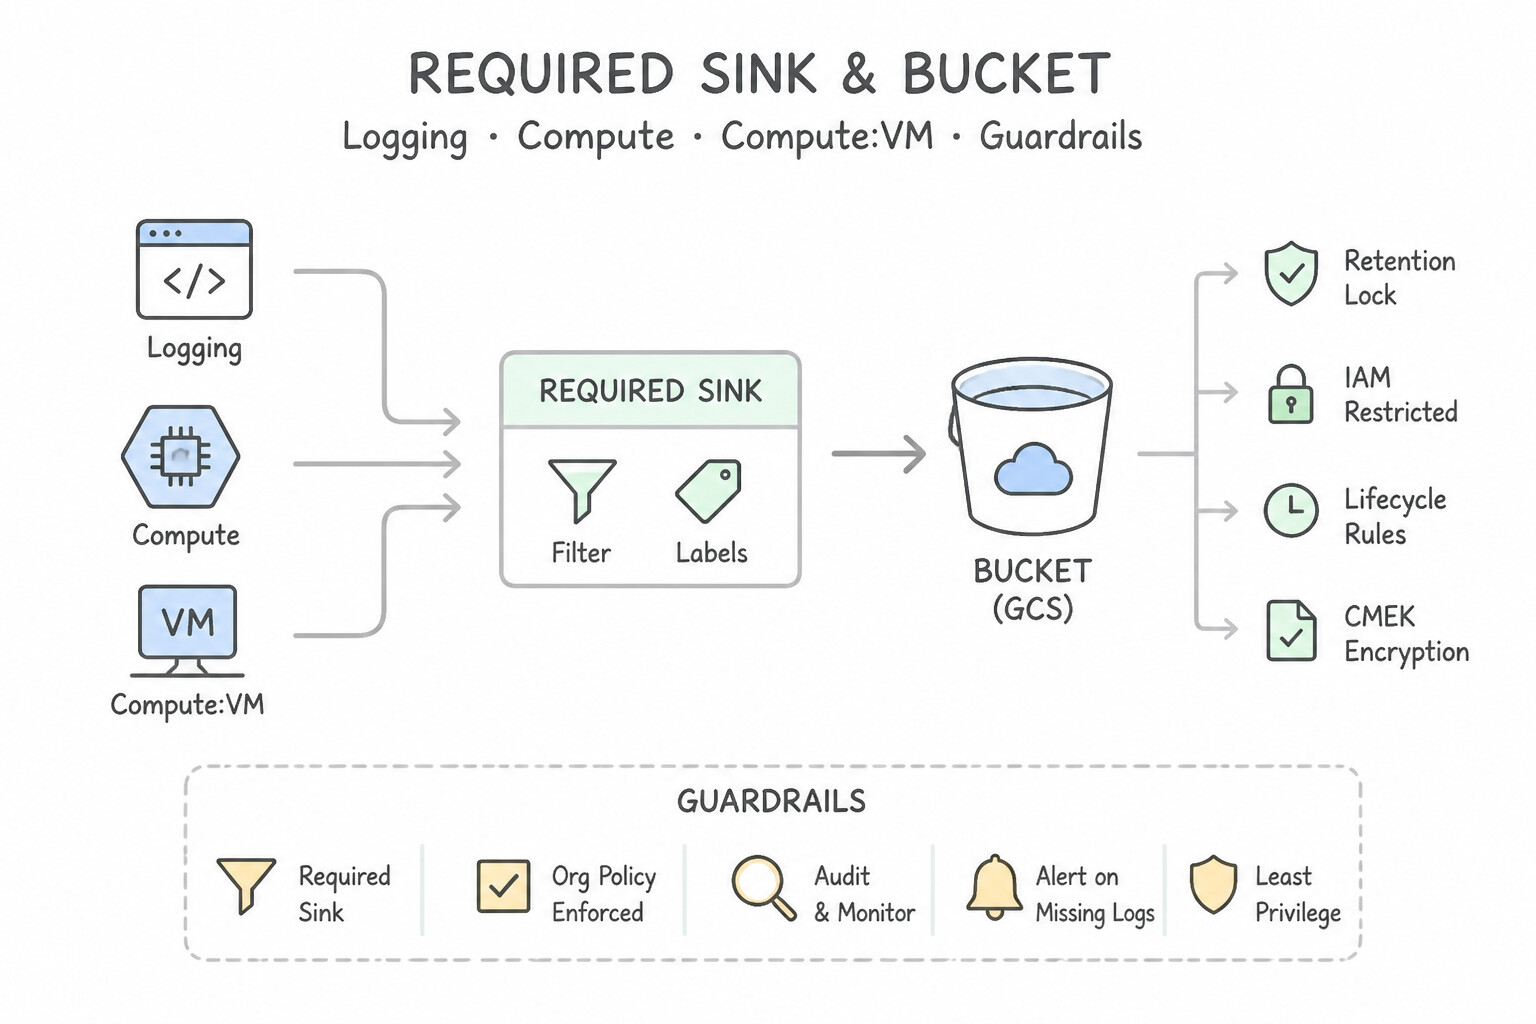
_RequiredSink/Bucket: StoresAdmin Activity,System Event, and Access Transparency logs for 400 days (cannot be modified or disabled)._DefaultSink/Bucket: Stores all other logs for 30 days (configurable from 1 day to 3,650 days). You can add Exclusion Filters to the_Defaultsink to drop noisy, high-volume debug or health-check logs before ingestion so you pay $0 ingestion cost for excluded logs!- Log Analytics & Linked BigQuery Datasets: Upgrading a Cloud Logging Bucket to Log Analytics allows you to run standard SQL queries directly against logs in the Cloud Console—and optionally create a Linked BigQuery Dataset so you can join log data with BigQuery business tables without paying twice for log storage!
Key Implementation Patterns
- Filtering by Log Severity for Incident Response: Use In the Logs Explorer query builder, add the condition severity >= ERROR. Using severity >= ERROR correctly filters for Error logs and all higher severity levels like Critical and Alert. (Avoid alternative: This operator selects logs with severity lower than ERROR, such as INFO and WARNING, which is the opposite of the goal.)
- Querying Structured JSON Payloads: Use In the query editor, use the filter
jsonPayload.payment_gateway.status="timeout". Structured JSON logs populate the jsonPayload field, and you access nested properties using dot notation in the query editor. (Avoid alternative: Global search finds the text anywhere in the log entry, not just in the specific field, leading to noisy results.) - Investigating Resource Lifecycle via Admin Activity Logs: Use Filter for protoPayload.methodName="v1.compute.instances.delete" and inspect the protoPayload.authenticationInfo.principalEmail field. Filter by the specific API method for deletion and look at the authentication info to find the user's email.
Key Takeaways (3.4e)
- Google Cloud Logging severity levels are ordered numerically (Debug < Info < Warning < Error < Critical).
- Use comparison operators (>=, >, <=, <) to filter ranges of severity.
- The query
severity >= ERRORis the standard way to view all failures and critical issues.- Text searches (e.g.,
textPayload:) are different from structured field filters.
Consideration 3.4f: Viewing detailed log messages
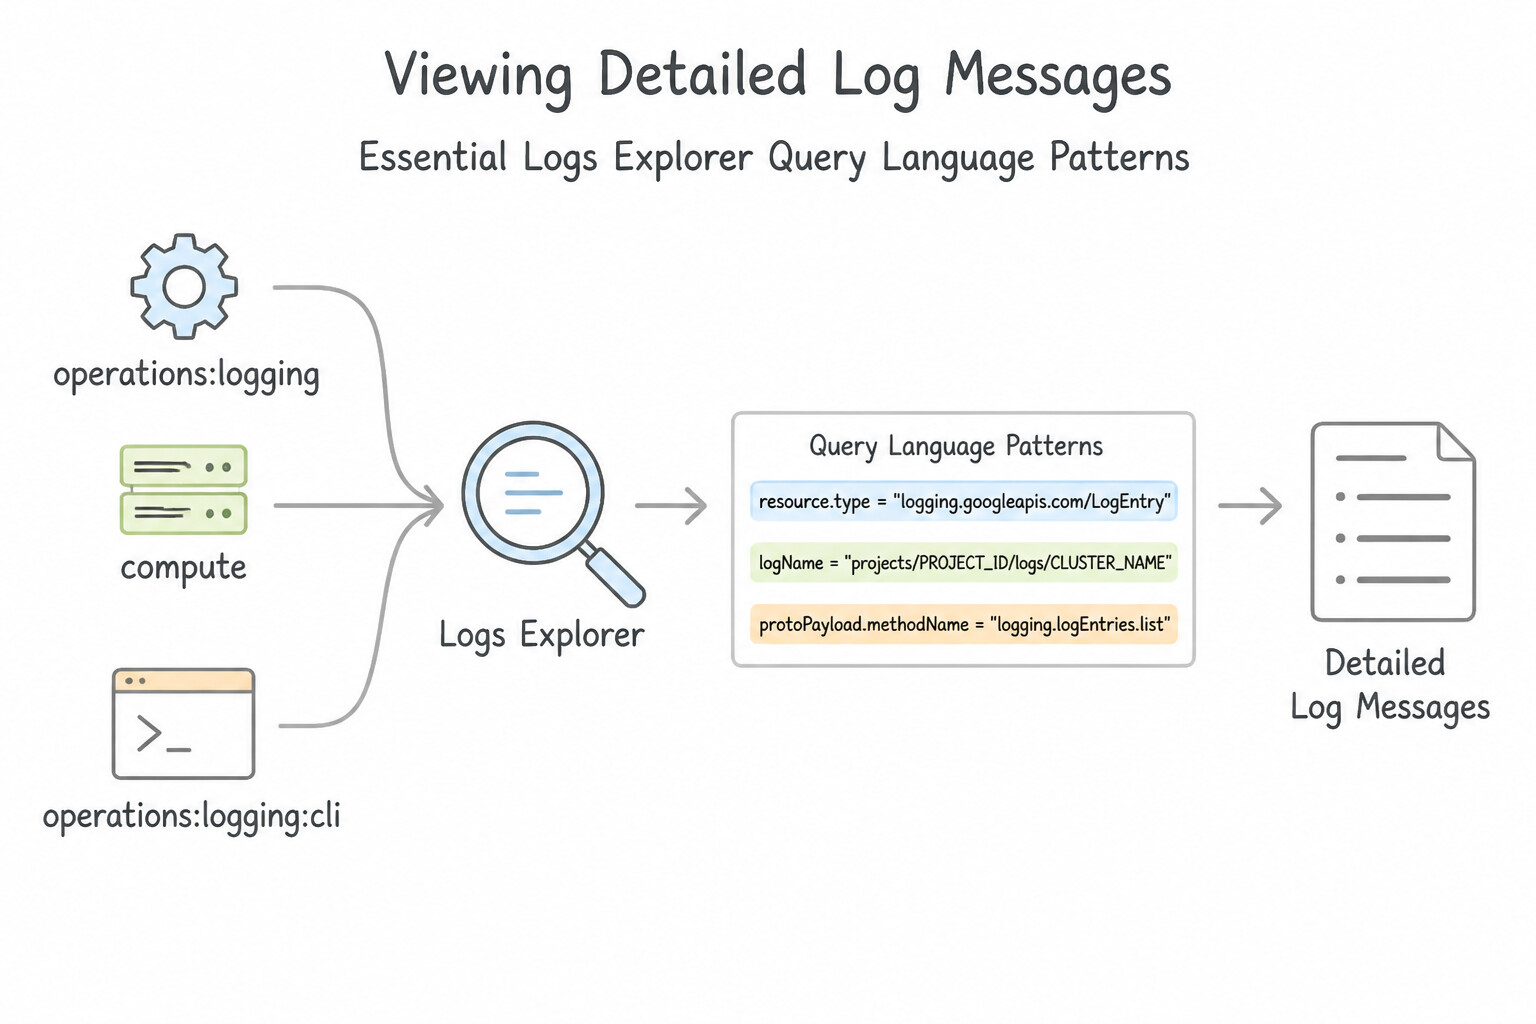
- Essential Logs Explorer Query Language Patterns:
- Filter by resource type and severity:
resource.type="gce_instance" AND severity>=ERROR - Filter by exact substring vs. case-insensitive match:
jsonPayload.message:"connection timeout"(case-insensitive contains) vs.jsonPayload.status="FAILED"(exact equality). - Boolean operators: Space between lines defaults to
AND; always capitalizeAND,OR, andNOT, and groupORclauses with parentheses!
Key Implementation Patterns
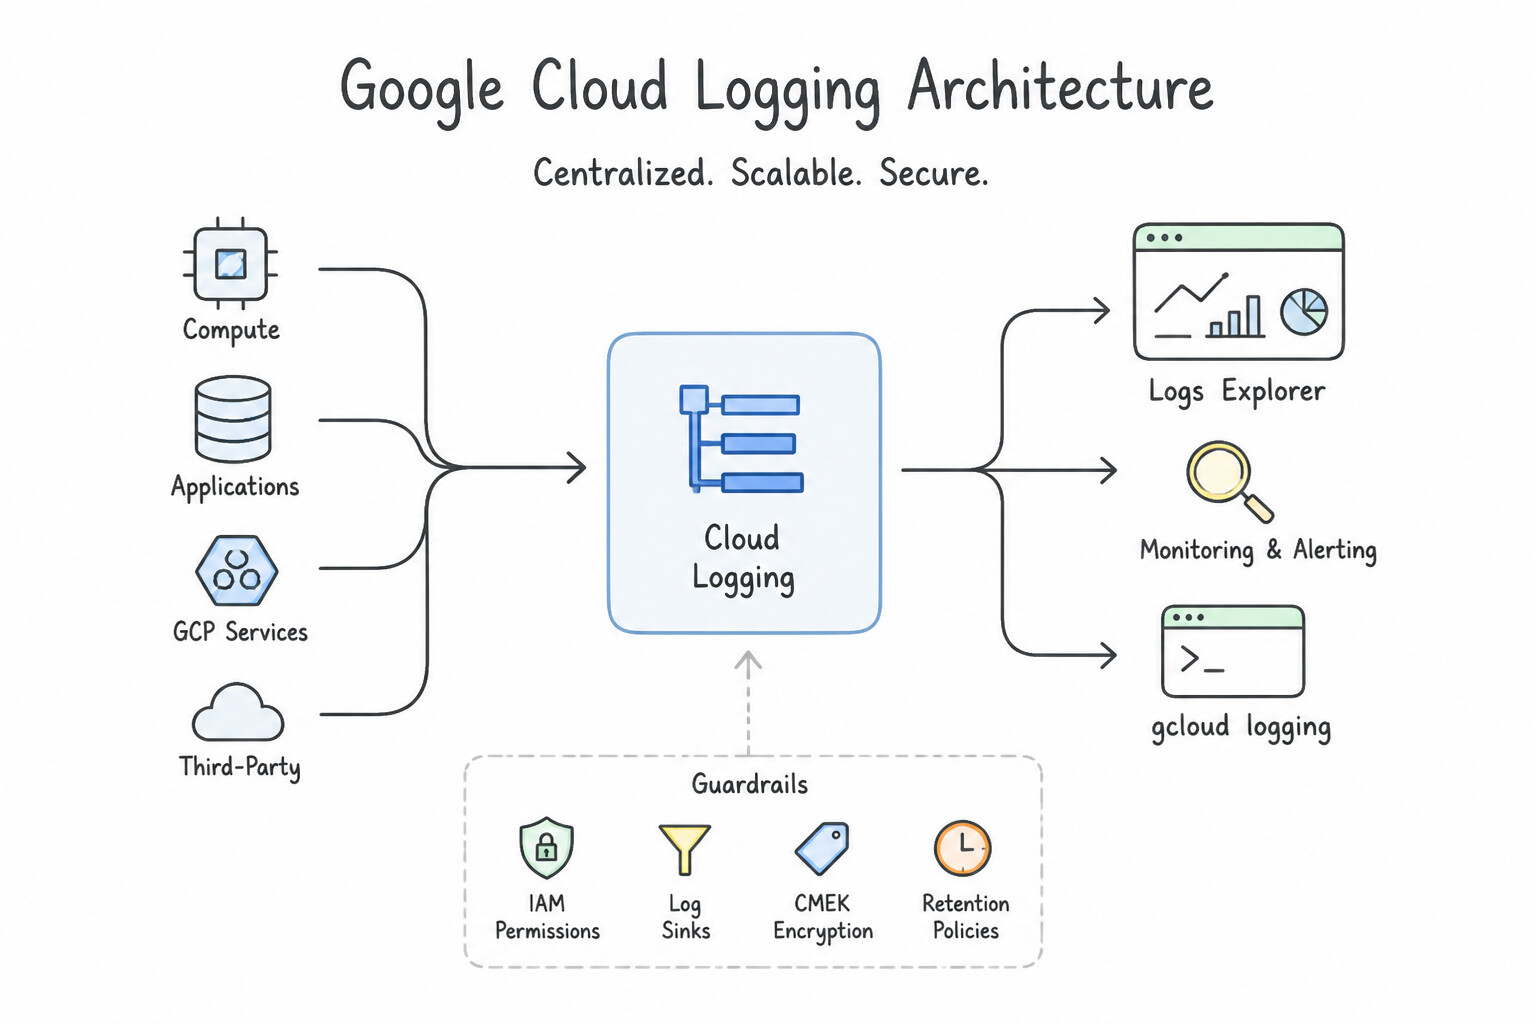
- Advanced Log Filtering Syntax: Use In the Logs Explorer, use the query: resource.labels.instance_group_name="instance-group-1" AND severity >= ERROR AND NOT resource.type="http_load_balancer". Use the AND operator to combine conditions, the >= operator for severity levels, and the NOT operator to exclude specific resources.
- Structured vs. Unstructured Logging: Use In the Logs Explorer, enter the query: jsonPayload.payment_status="failed". Structured JSON logs are parsed into jsonPayload; use dot notation to filter specific fields. (Avoid alternative: TextPayload is used for unstructured text logs, not structured JSON objects.)
- CLI Log Retrieval: Use Run
gcloud logging read "resource.type=cloud_function AND resource.labels.function_name=data-processor" --limit=10. Usegcloud logging readwith a resource filter and the--limitflag to retrieve a specific number of recent log entries. (Avoid alternative: The flag--countdoes not exist for this command; use--limitinstead.)
Key Takeaways (3.4f)
- Use AND to narrow search results by requiring multiple conditions to be true.
- Use NOT to exclude specific resources or text from your log results.
- Severity levels are hierarchical; use >= to catch a specific severity and everything more critical.
- Precise log filtering reduces noise and accelerates root cause analysis during troubleshooting.
Consideration 3.4g: Using cloud diagnostics tools (trace, profiler, query insights)
- Understanding the
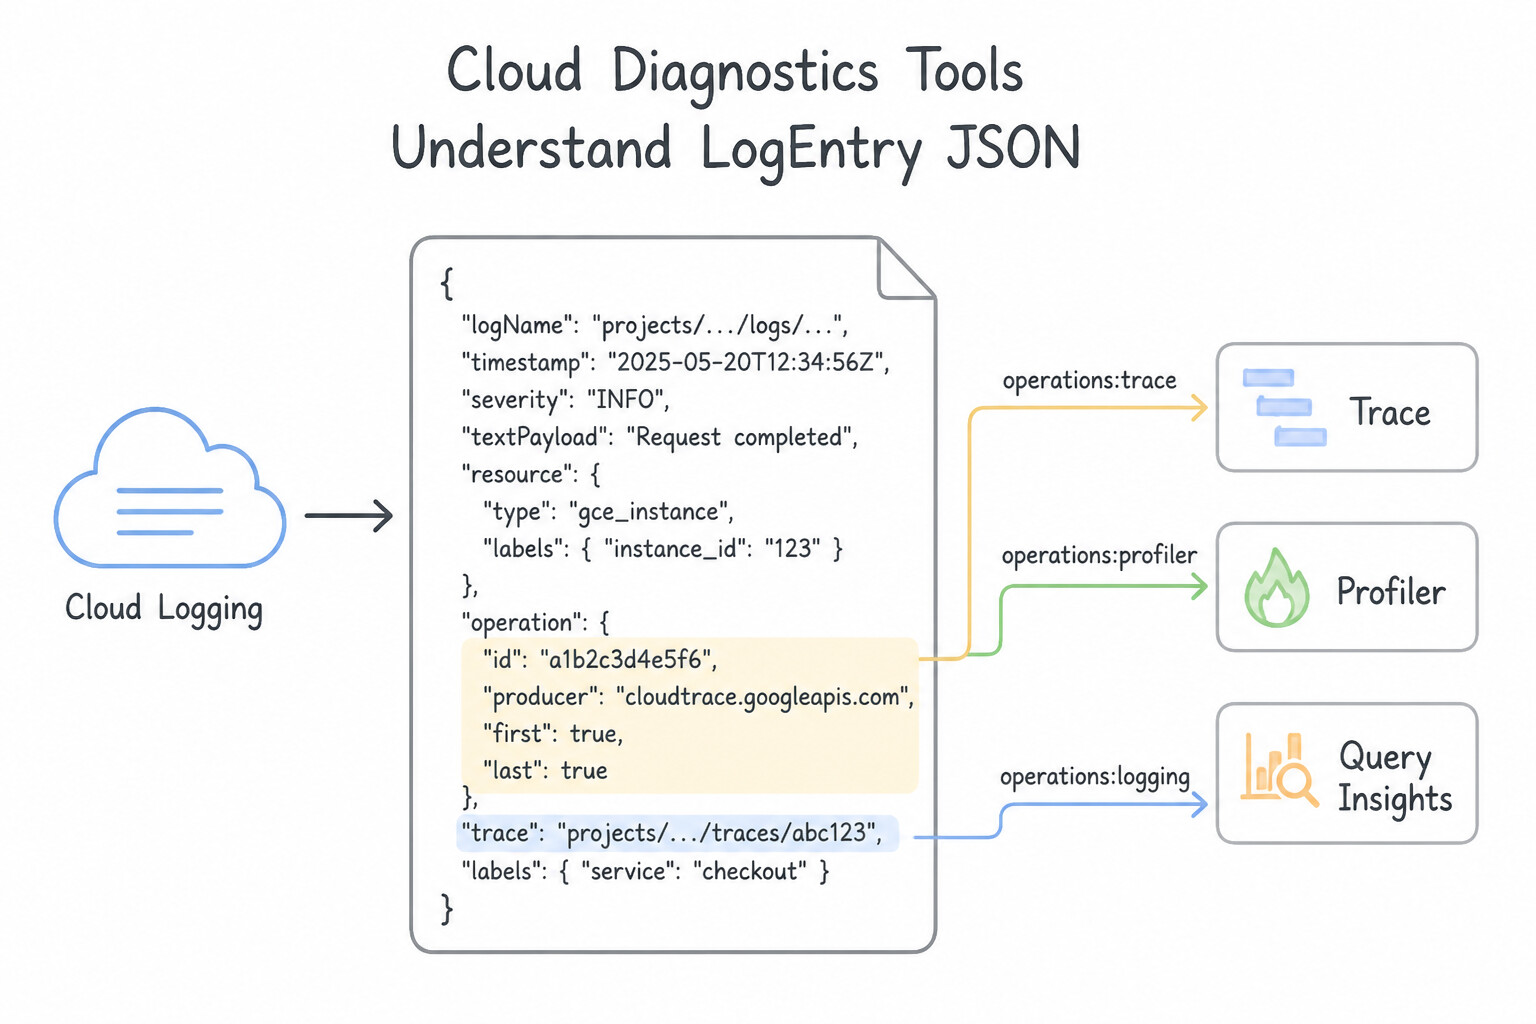
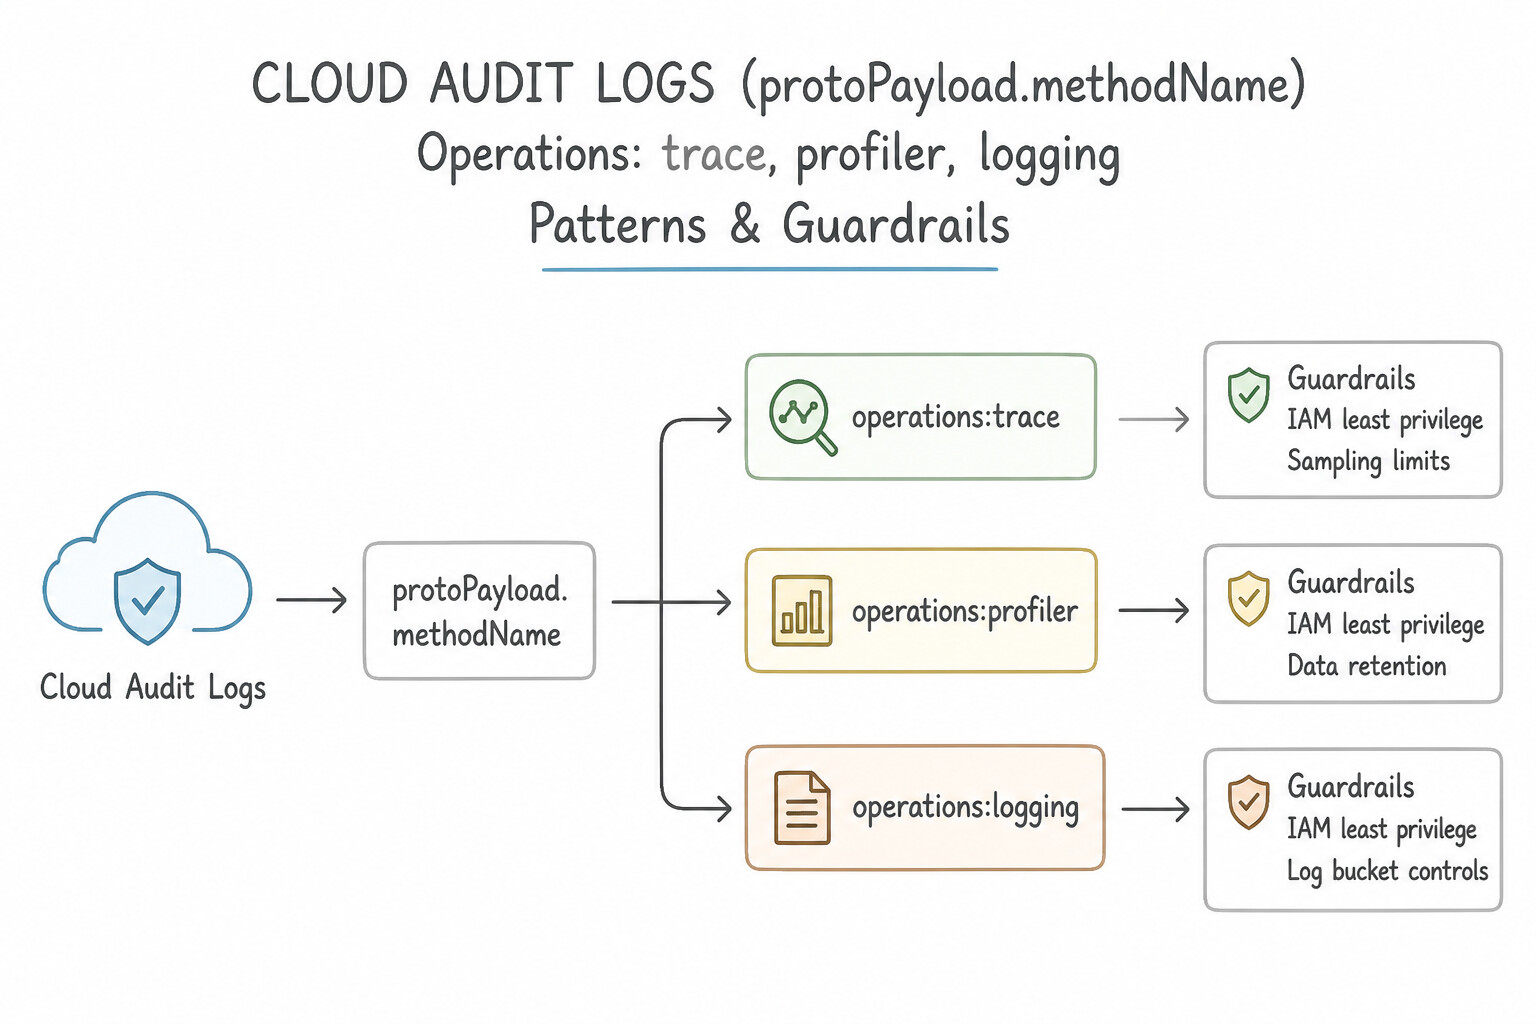
LogEntryJSON Structure: protoPayload: Used by Cloud Audit Logs (protoPayload.methodName,protoPayload.authenticationInfo.principalEmail,protoPayload.status.message).jsonPayload: Structured JSON logs emitted by applications or the Ops Agent (allows filtering on individual nested keys likejsonPayload.httpRequest.latency).textPayload: Unstructured plain-text stdout/stderr lines.resource: Identifies the originating Google Cloud resource (resource.type,resource.labels.instance_id,resource.labels.zone).
Key Implementation Patterns
- Identifying Microservice Latency Bottlenecks: Use Use Cloud Trace to view waterfall graphs of request latency across the microservices. Cloud Trace provides distributed tracing and waterfall graphs to visualize and pinpoint latency bottlenecks in microservices. (Avoid alternative: Cloud Profiler analyzes CPU and memory usage of code, not the latency of requests across distributed services.)
- Optimizing Cloud SQL Performance: Use Enable Query Insights on the Cloud SQL instance and use the dashboard to identify queries with the highest CPU load. Query Insights is the dedicated tool within Cloud SQL for analyzing query performance and resource usage. (Avoid alternative: Cloud Trace measures latency between services, not the internal resource consumption of specific SQL queries within the database.)
- Reducing Compute Costs via Code Optimization: Use Configure the application to use the Cloud Profiler agent. Analyze the resulting flame graphs to identify resource-intensive functions. Cloud Profiler is designed to identify resource-intensive functions (CPU or memory) in code using flame graphs with low production overhead.
Key Takeaways (3.4g)
- Cloud Trace is used for debugging latency and analyzing call chains in microservices.
- Cloud Profiler is used for analyzing CPU and memory consumption of code functions.
- Cloud Monitoring is for high-level infrastructure metrics and alerting.
- Cloud Logging is for searching and analyzing textual logs and errors.
Consideration 3.4h: Viewing the personalized service health dashboard
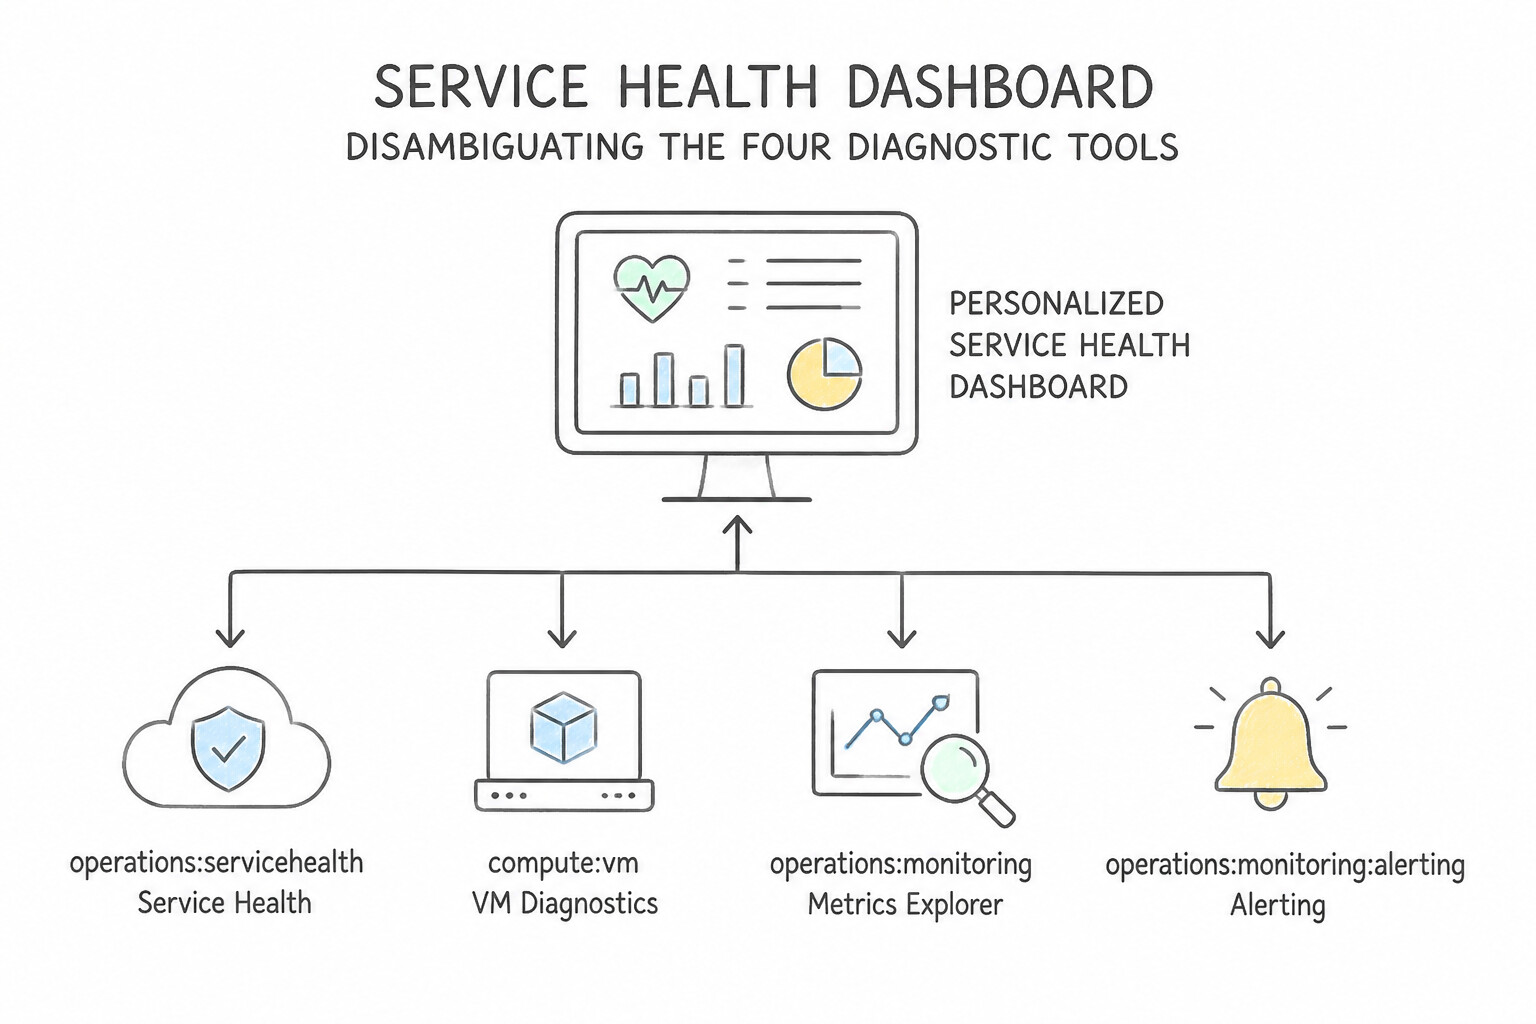
- Disambiguating the Four Diagnostic Tools:
- Cloud Trace (Distributed Request Latency): Tracks how a single user request propagates across multiple microservices (Load Balancer → Cloud Run → GKE → Cloud SQL), displaying waterfall span diagrams and latency distributions to pinpoint which inter-service hop is slow.
- Cloud Profiler (Continuous Code-Level CPU & Heap Profiling): Low-overhead (<0.5% CPU) statistical profiler for Go, Java, Python, and Node.js that renders Flame Graphs showing which specific function or line of code inside an application is consuming the most CPU time or memory allocations.
- Cloud SQL / AlloyDB / Spanner Query Insights: Built-in database observability dashboard that identifies slow SQL queries, high lock wait times, and top database load by application tag/user without installing external agents.
- Index Advisor (
Cloud SQL,AlloyDB,BigQuery,Spanner): Automatically analyzes historical slow query execution plans and recommends exactCREATE INDEXstatements to eliminate full-table scans.
Key Implementation Patterns
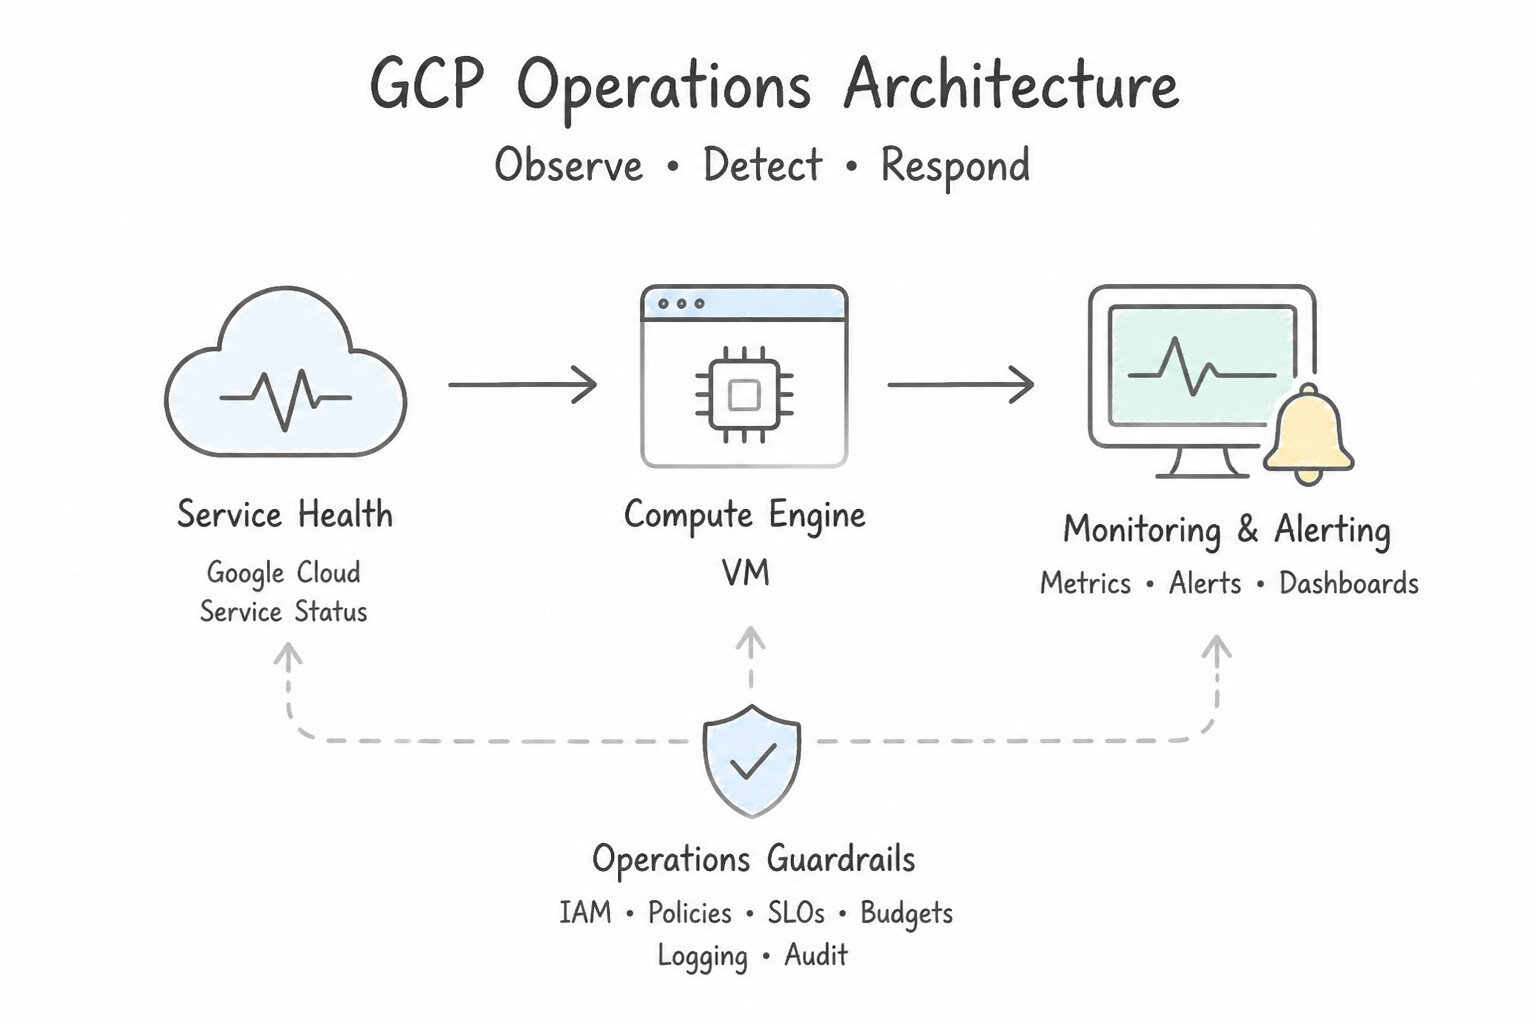
- Distinguishing Public Status from Personalized Health: Use Navigate to the Service Health dashboard in the Google Cloud console. Service Health provides a personalized view of incidents affecting your specific projects and locations, unlike the public status dashboard. (Avoid alternative: Quotas limit the creation of new resources and do not track the operational health or outages of existing services.)
- Configuring Alerts for Service Health Incidents: Use Create a log-based alert policy with a filter for the Service Health log type and add an email notification channel. Service Health events are recorded in Cloud Logging; a log-based alert is the standard way to trigger notifications for these specific platform logs.
- Identifying Planned Maintenance: Use Navigate to the Service Health dashboard in the Google Cloud console and select the Planned maintenance tab. Service Health provides a personalized view of upcoming maintenance events affecting your specific resources. (Avoid alternative: The public Status Dashboard shows global service health, not project-specific maintenance schedules.)
Key Takeaways (3.4h)
- The Public Google Cloud Status Dashboard shows widespread, global outages.
- The Service Health dashboard in the Google Cloud console provides a personalized view of incidents affecting your specific projects and resources.
- Always check Service Health if you experience issues but the public dashboard shows no incidents.
- Service Health events provide personalized information about Google Cloud incidents affecting your project.
Consideration 3.4i: Configuring and deploying ops agent
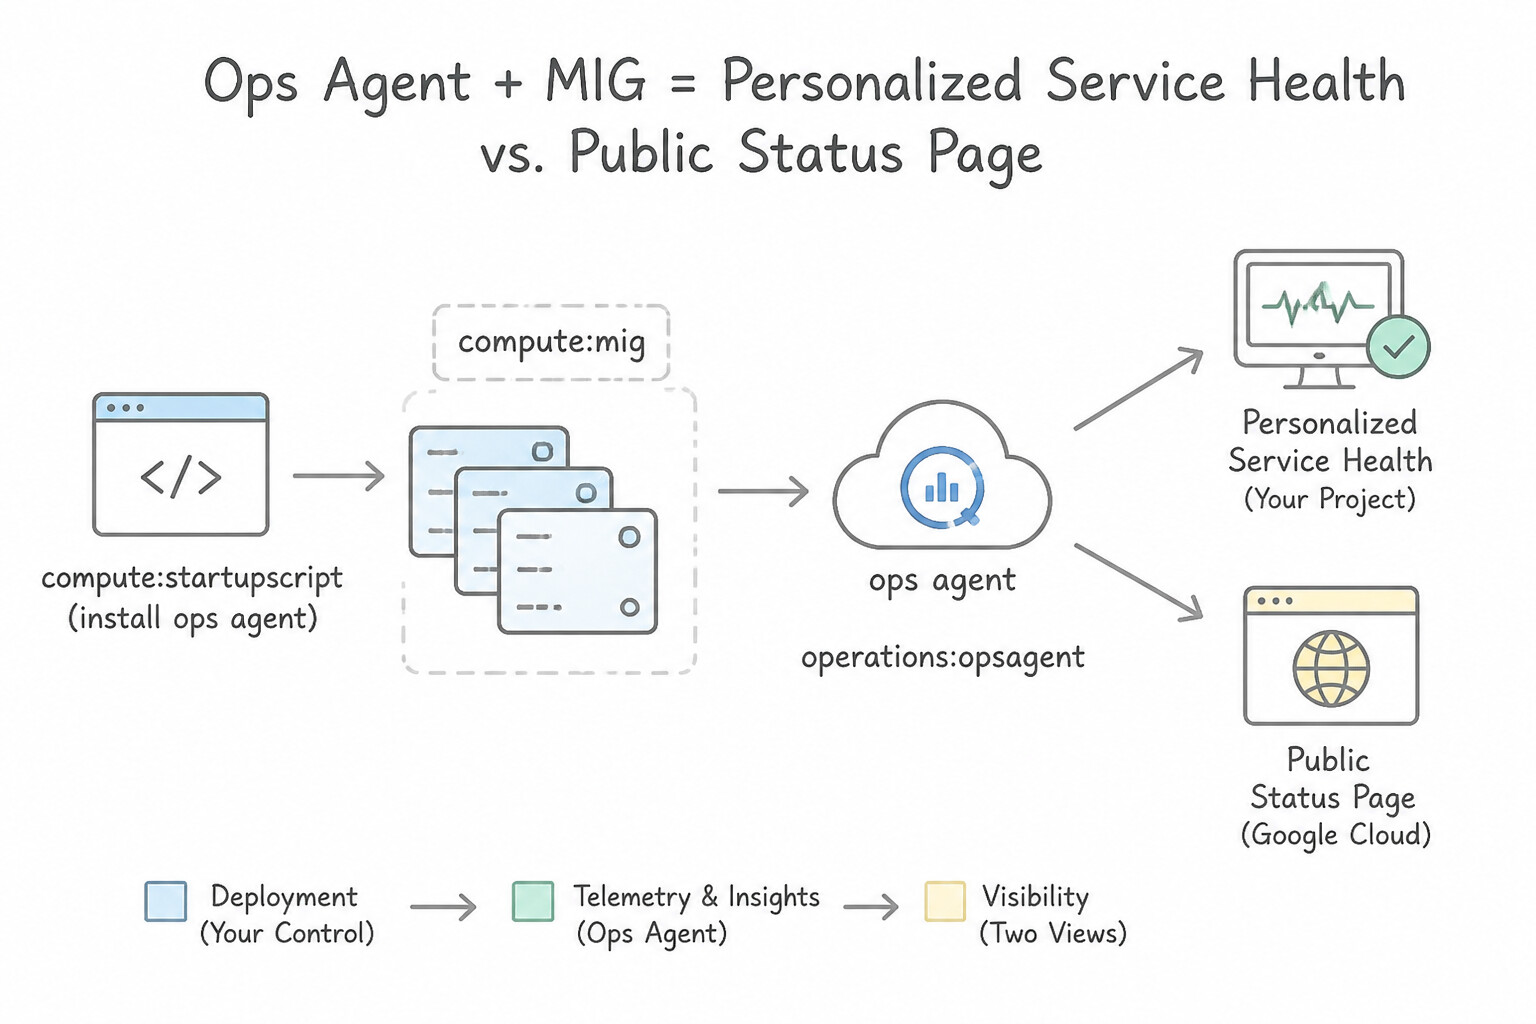
- Personalized Service Health vs. Public Status Page:
- Unlike the public
status.cloud.google.compage (which shows broad global disruptions), Personalized Service Health filters Google Cloud infrastructure incidents specifically against your project's active resources and regions, distinguishing between Relevant (directly impacting your project) and Emerging incidents. - You can configure Cloud Monitoring Log-Based Alerts on
resource.type="service_health"so your SRE team receives automatic PagerDuty/Slack notifications whenever a Google Cloud regional outage affects your project.
Key Implementation Patterns
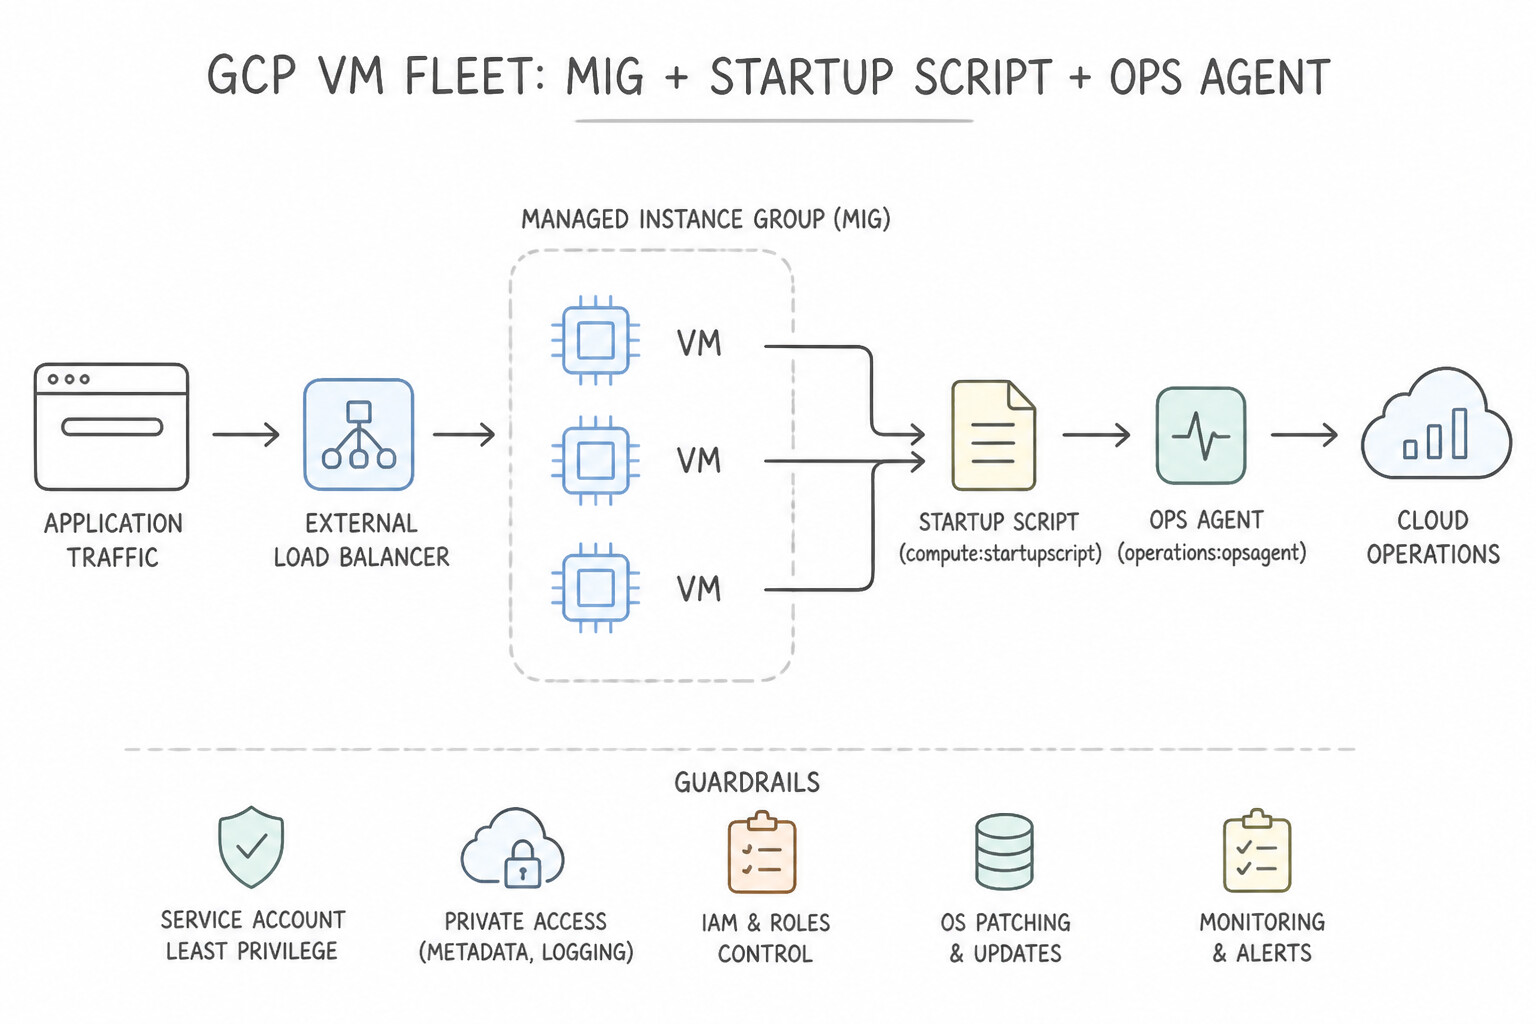
- Automated Deployment to Managed Instance Groups: Use Add a startup script to the instance template that runs the Ops Agent installation command. Startup scripts in an instance template automatically execute commands, such as installing agents, whenever a new VM boots. (Avoid alternative: Manual installation does not scale and cannot be automated for dynamically created instances in a MIG.)
- Ingesting Custom Application Log Files: Use Edit the Ops Agent configuration file. Add a logging receiver of type
filesand setinclude_pathsto/var/log/my-app/error.log. Restart the agent. To ingest custom logs, configure aloggingreceiver of typefilesin the Ops Agent YAML config and specify the file path. - Parsing Unstructured Logs to JSON: Use Add a parse_json processor to the logging pipeline in the Ops Agent configuration file. The parse_json processor converts JSON-encoded text strings into structured log payloads. (Avoid alternative: Renaming a field does not parse the string content into a structured JSON object.)
Key Takeaways (3.4i)
- Use startup scripts to automate software installation during VM boot.
- Define startup scripts in Instance Templates to apply them to all VMs in a Managed Instance Group.
- The Ops Agent is required for comprehensive logging and metrics collection from Compute Engine instances.
- The Google Cloud Ops Agent combines logging and metrics collection.
Consideration 3.4j: Deploying managed service for prometheus
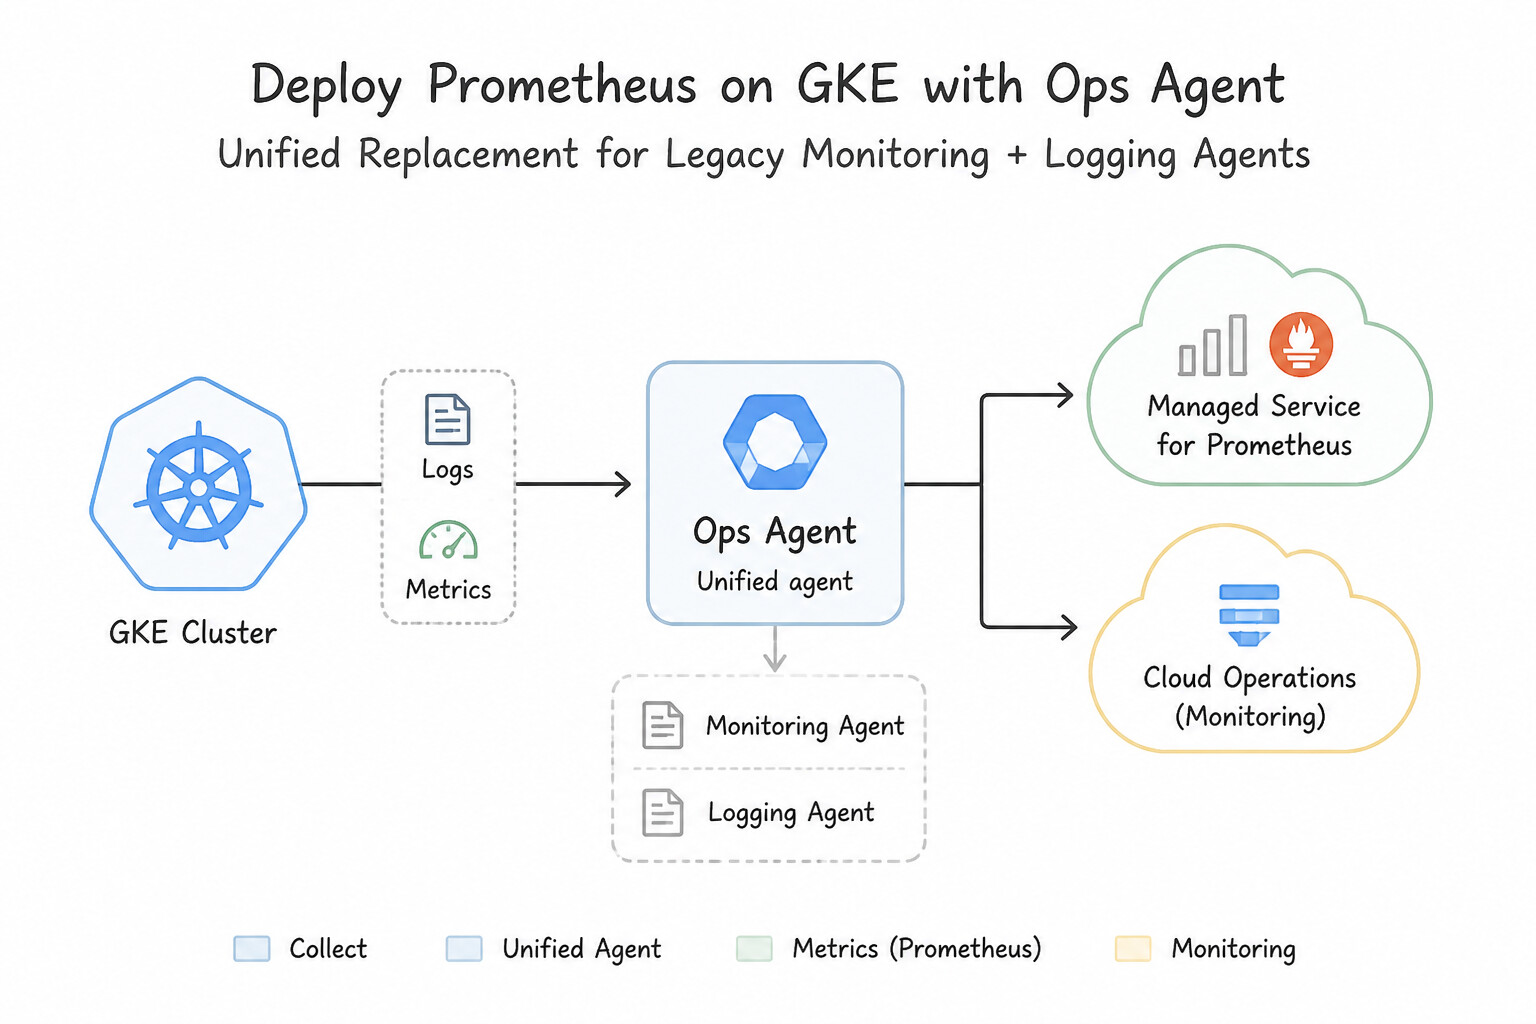
- Ops Agent = Unified Replacement for Legacy Monitoring + Logging Agents:
- Combines Fluent Bit (high-throughput log collection/parsing) and the OpenTelemetry Collector (host memory/RAM, disk space, GPU utilization, and third-party app metrics like Apache/Nginx/MySQL/PostgreSQL) in a single agent.
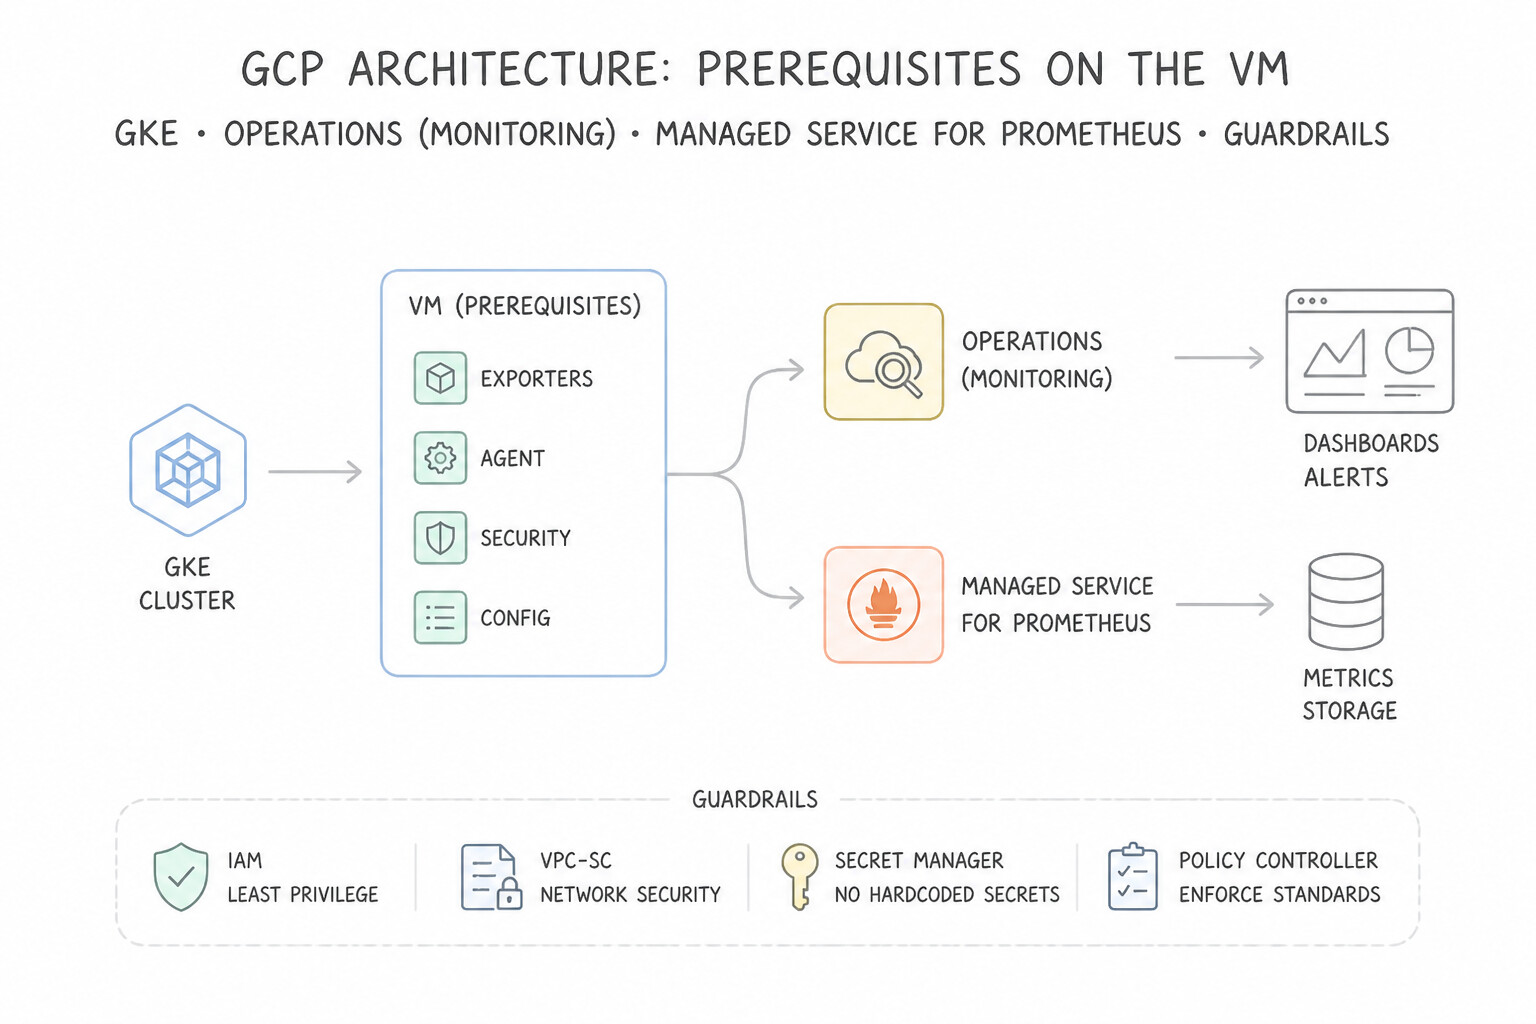
- Prerequisites on the VM:
- The VM's attached Service Account must have
roles/logging.logWriter(Logs Writer) androles/monitoring.metricWriter(Monitoring Metric Writer). - Outbound connectivity to Google APIs (via external IP, Cloud NAT, or Private Google Access).
- Fleet-Wide Installation: Use VM Manager (OS Policy Assignment) or
--policiesduring VM creation to automatically install and maintain the Ops Agent across hundreds of VMs.
Key Implementation Patterns
- Enabling Managed Service for Prometheus on GKE: Use Enable the Managed Service for Prometheus feature in the GKE cluster configuration. Managed Service for Prometheus offloads the management of the server and storage to Google, meeting the requirement. (Avoid alternative: Using a Helm chart installs a self-managed server, which contradicts the requirement to avoid operational overhead.)
- Configuring Target Scraping with PodMonitoring: Use Apply a "PodMonitoring" custom resource that selects the "backend-api" labels and port 9090. The
PodMonitoringcustom resource is the correct method to configure target scraping for Managed Service for Prometheus (managed collection). - Visualizing PromQL Data in Cloud Console: Use Navigate to Cloud Monitoring Metrics Explorer. Select the PromQL tab and run the query. Cloud Monitoring Metrics Explorer natively supports PromQL, allowing you to run existing queries directly in the console. (Avoid alternative: Installing Grafana violates the requirement to use the Google Cloud Console without external software.)
Key Takeaways (3.4j)
- Google Cloud Managed Service for Prometheus allows you to use Prometheus metrics without managing the infrastructure.
- Avoiding operational overhead usually implies choosing a 'Managed Service' over a self-installed solution (like Helm charts or VMs).
- Managed collection in GKE is the easiest way to start scraping Prometheus metrics.
- Managed Service for Prometheus uses
PodMonitoringcustom resources for target discovery in managed collection mode.
Consideration 3.4k: Configuring audit logs
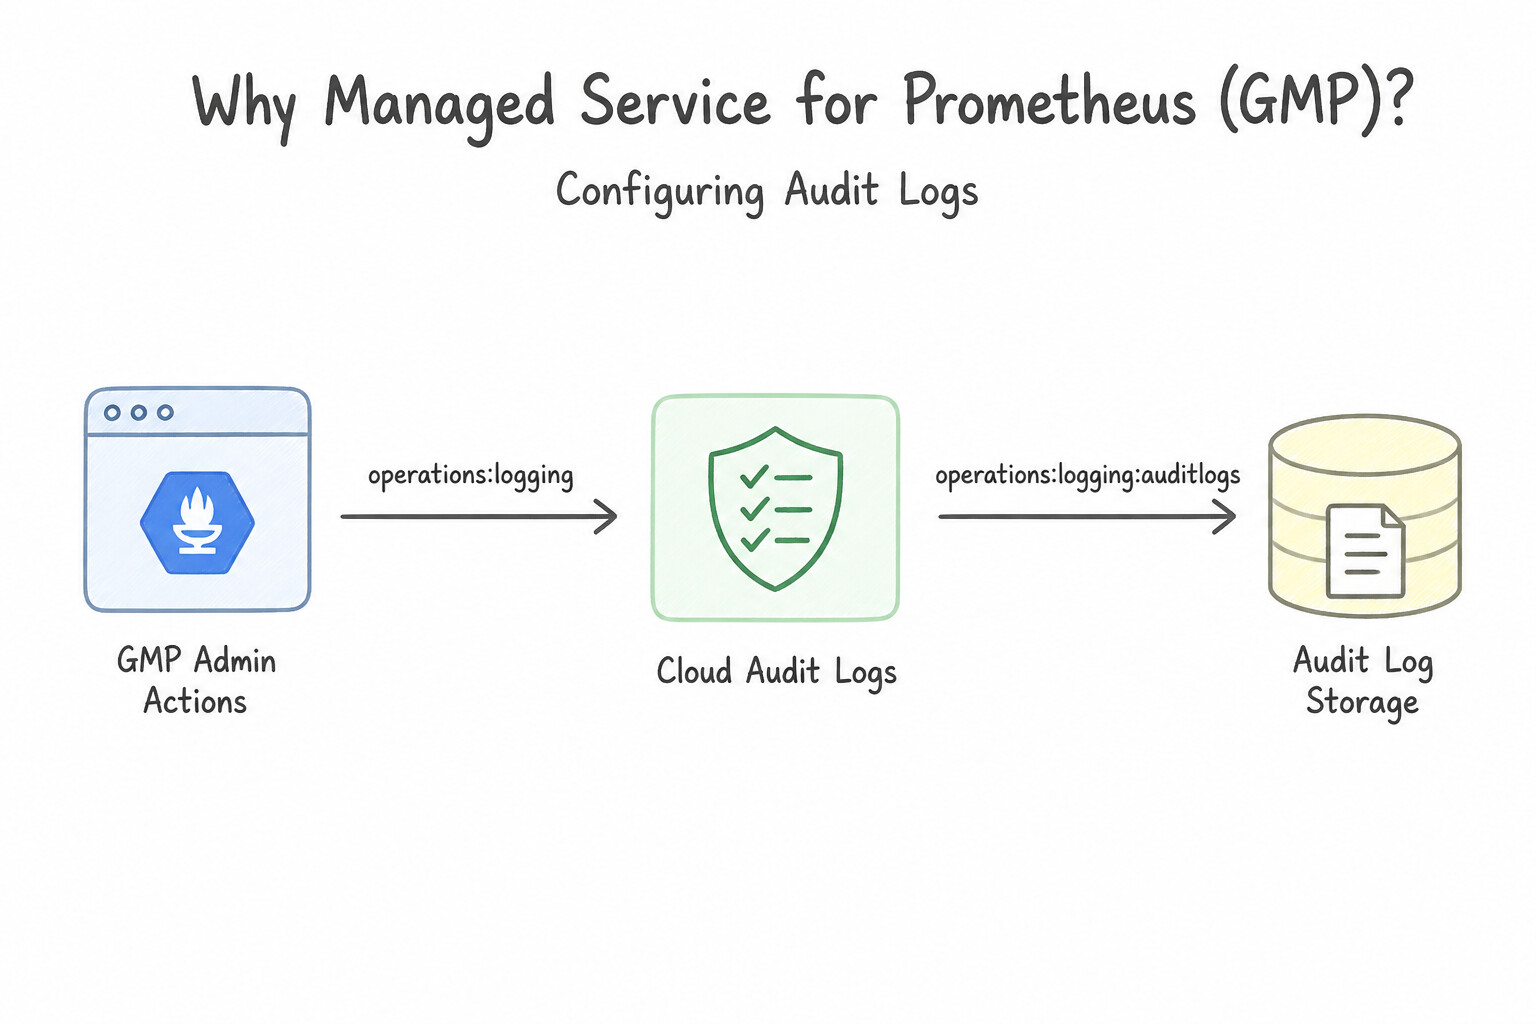
- Why Managed Service for Prometheus (GMP)? Self-hosting Prometheus servers inside GKE fails at scale because local Persistent Disks fill up, vertical memory spikes crash the Prometheus Pod, and querying across multiple clusters requires complex Thanos/Cortex federation.
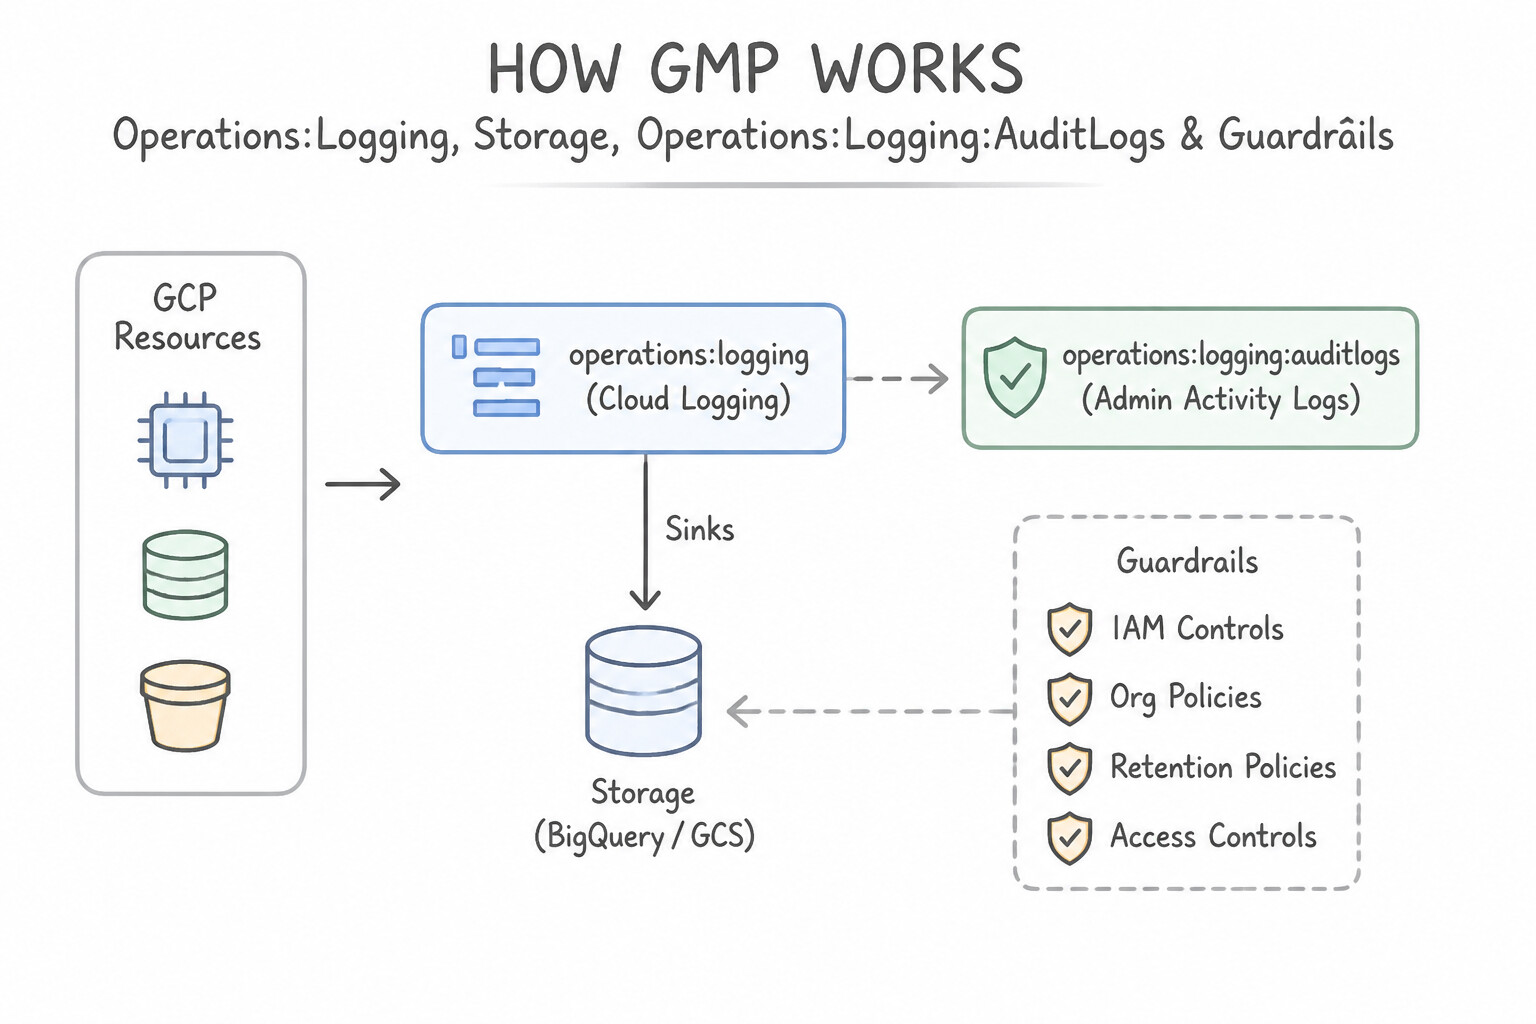
- How GMP Works: Google Cloud Managed Service for Prometheus is enabled with a single checkbox/flag on GKE (
--enable-managed-prometheus). You configure KubernetesPodMonitoringcustom resources to scrape/metricsendpoints; Google Cloud stores the metrics in Monarch (the global backend behind Cloud Monitoring) and lets you query them using standard PromQL in Cloud Monitoring or existing Grafana dashboards with zero Prometheus storage servers to manage!
Key Implementation Patterns
- Enabling Data Access Logs for Cloud Storage: Use Enable Data Access audit logs for the Cloud Storage API. Object reads are classified as Data Access operations, which are disabled by default for Cloud Storage and must be explicitly enabled. (Avoid alternative: Admin Activity logs are enabled by default and track configuration changes, not data reads.)
- Exempting High-Volume Service Accounts: Use Add the service account email to the Exempted Principals list in the Data Access audit logs configuration. Exempted Principals is the specific feature designed to exclude specific users from generating audit logs. (Avoid alternative: Disabling the logs globally would stop logging for human users as well.)
- Organizational Level Audit Policies: Use Enable Data Access audit logs for Cloud Bigtable at the Finance Folder level. Audit Log configurations set at a parent Folder are automatically inherited by all child projects, covering both current and future resources. (Avoid alternative: A Log Sink exports existing logs but does not turn on the generation of Data Access logs, which are disabled by default.)
Key Takeaways (3.4k)
- Admin Activity logs track configuration changes and are on by default.
- Data Access logs track data reads/writes and are usually off by default.
- You must manually enable Data Access logs to audit object downloads in Cloud Storage.
- Data Access audit logs can be voluminous and costly; configure them carefully.
Consideration 3.4l: Using gemini cloud assist for monitoring
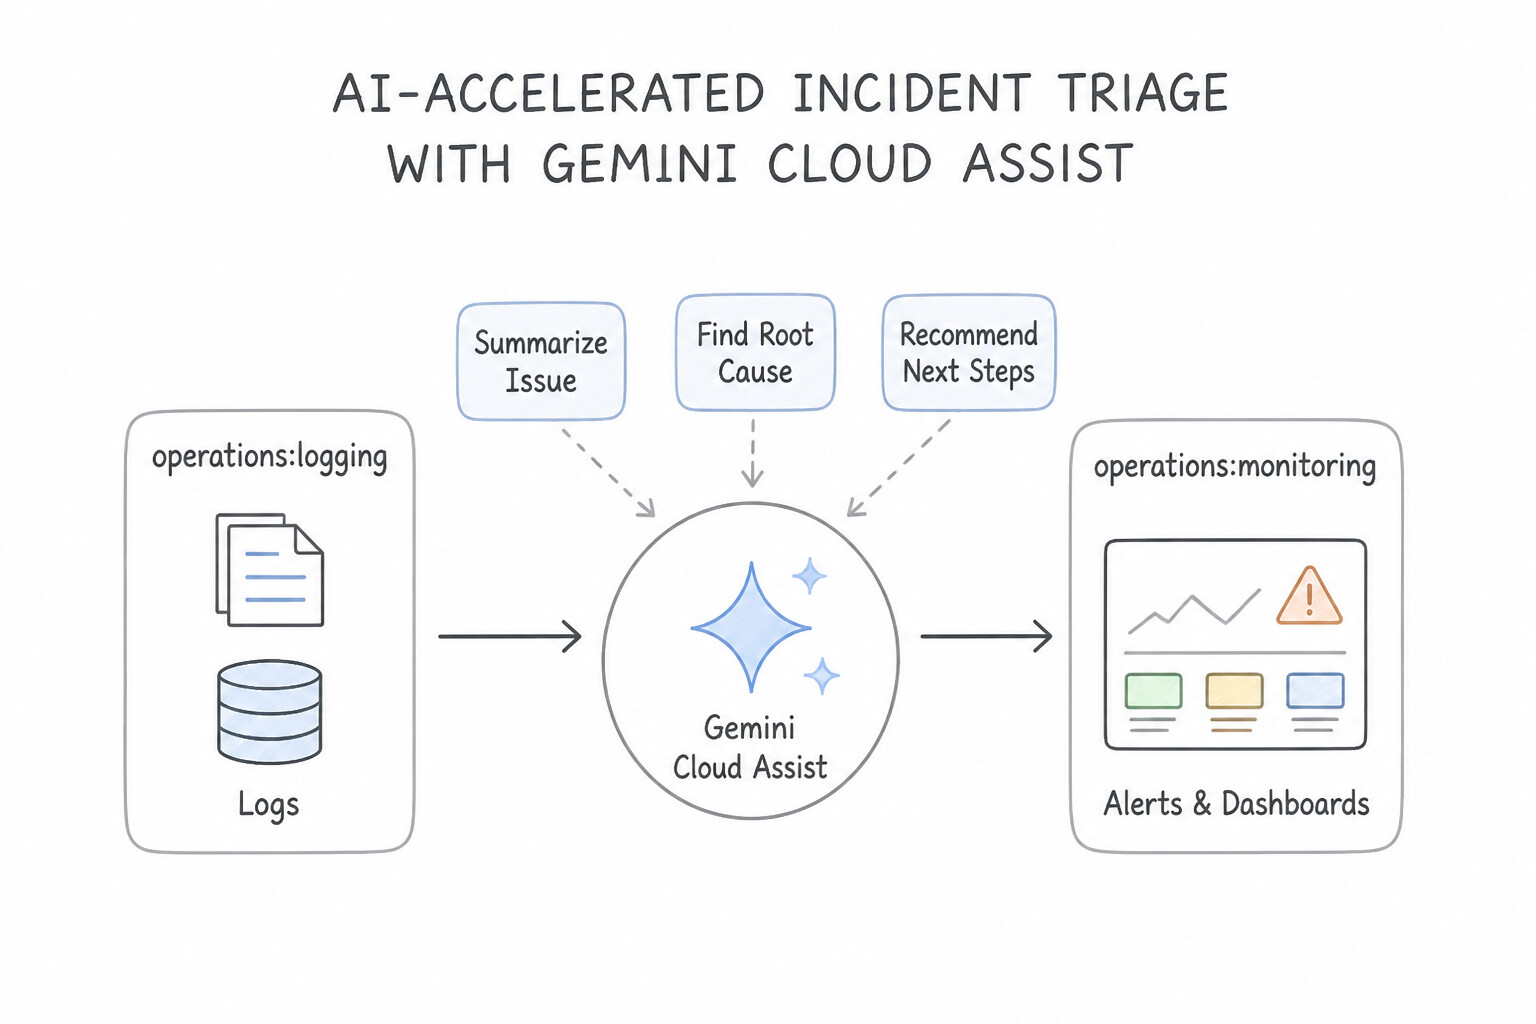
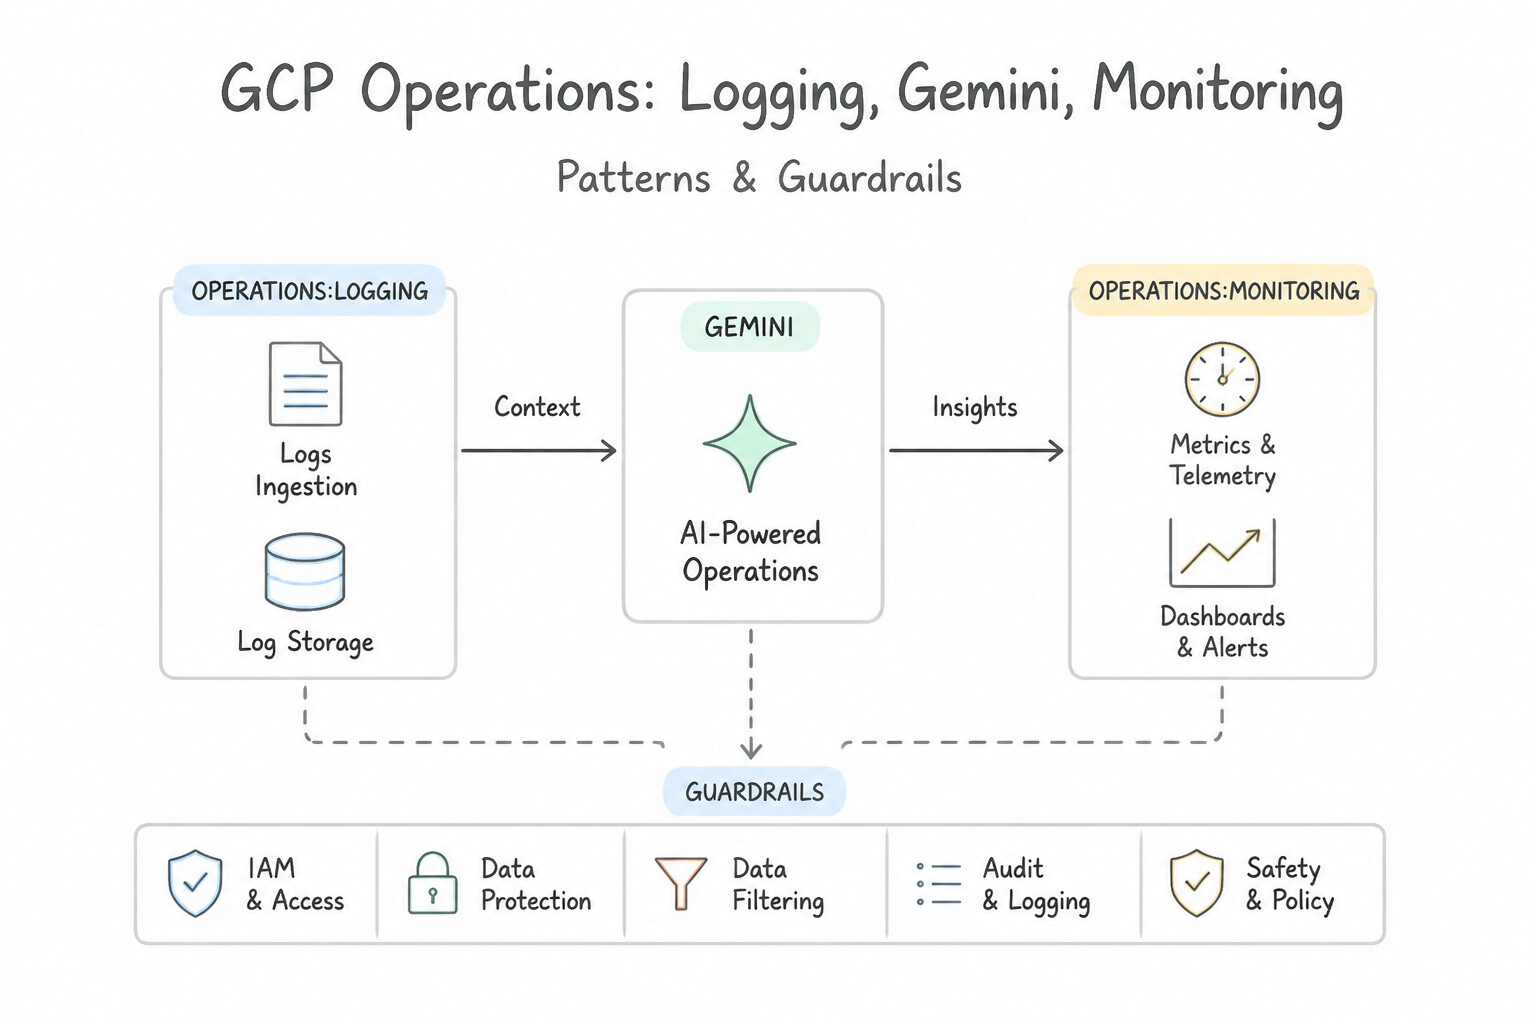
- AI-Accelerated Incident Triage: Inside Cloud Monitoring and Logs Explorer, Gemini Cloud Assist summarizes complex alert firing patterns, explains obfuscated log stack traces, translates natural-language questions ("Show me 5xx errors on the checkout Cloud Run service in the last 2 hours") into exact Logging Query Language (LQL) or PromQL queries, and correlates recent deployment changes with latency spikes.
Key Implementation Patterns
- Generating Log Filters with Natural Language: Use In the Logs Explorer, open Gemini Cloud Assist and enter "Show me HTTP 500 errors in us-central1". Gemini Cloud Assist can translate natural language prompts into complex Logging Query Language filters automatically. (Avoid alternative: Query Builder requires manual selection of fields and does not accept natural language prompts.)
- Explaining Obscure Stack Traces: Use Select the log entry in the Logs Explorer and click 'Explain this log entry' to view an analysis by Gemini. Gemini provides an 'Explain this log entry' feature in Logs Explorer that summarizes errors and suggests fixes. (Avoid alternative: BigQuery is for analytics and retention, not for immediate explanation of a single stack trace.)
- Generating PromQL for GKE Monitoring: Use Open the Metrics Explorer, select the PromQL tab, and use the Gemini feature to describe your requirement in natural language. Gemini in Cloud Monitoring can translate natural language requests directly into valid PromQL queries.
Key Takeaways (3.4l)
- Logs Explorer is the primary tool for viewing and filtering logs in Google Cloud.
- The Logging Query Language is powerful but can be complex for beginners.
- Gemini Cloud Assist can translate natural language requests into correct log queries, accelerating troubleshooting.
- Gemini can also summarize complex log entries to explain what went wrong.
Consideration 3.4m: Using active assist to optimize resource utilization
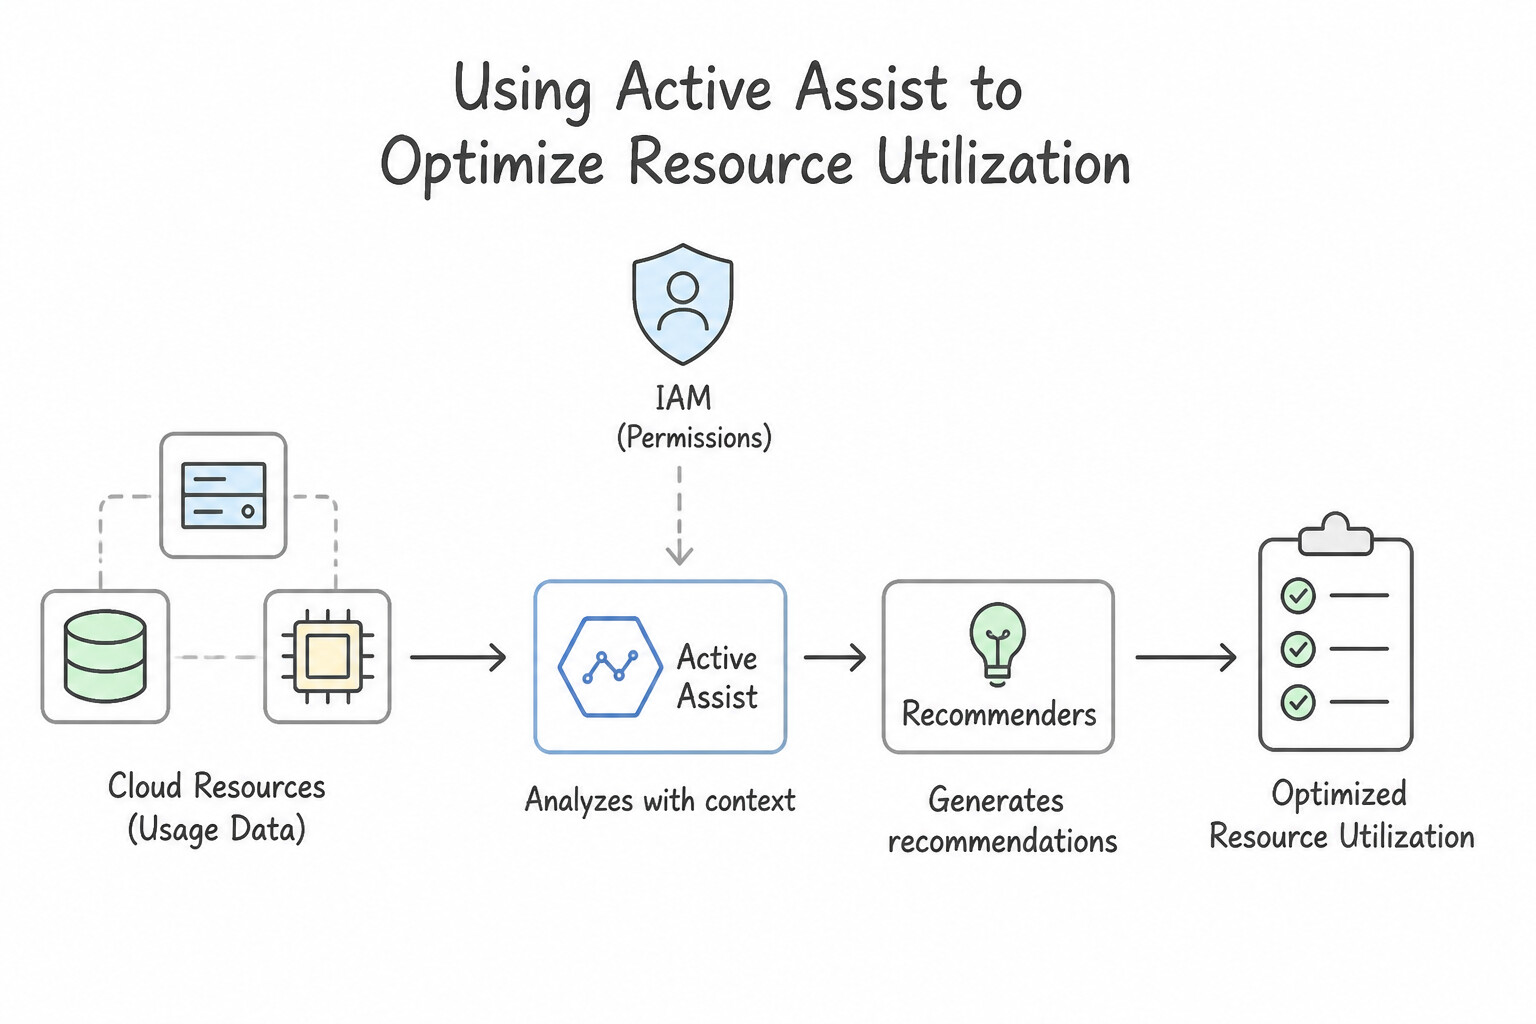
- What Active Assist & Recommenders Do: Active Assist is Google Cloud's portfolio of machine-learning Recommenders and Insights that continuously analyze historical usage over 8–90 days to reduce cost, improve performance, and tighten security:
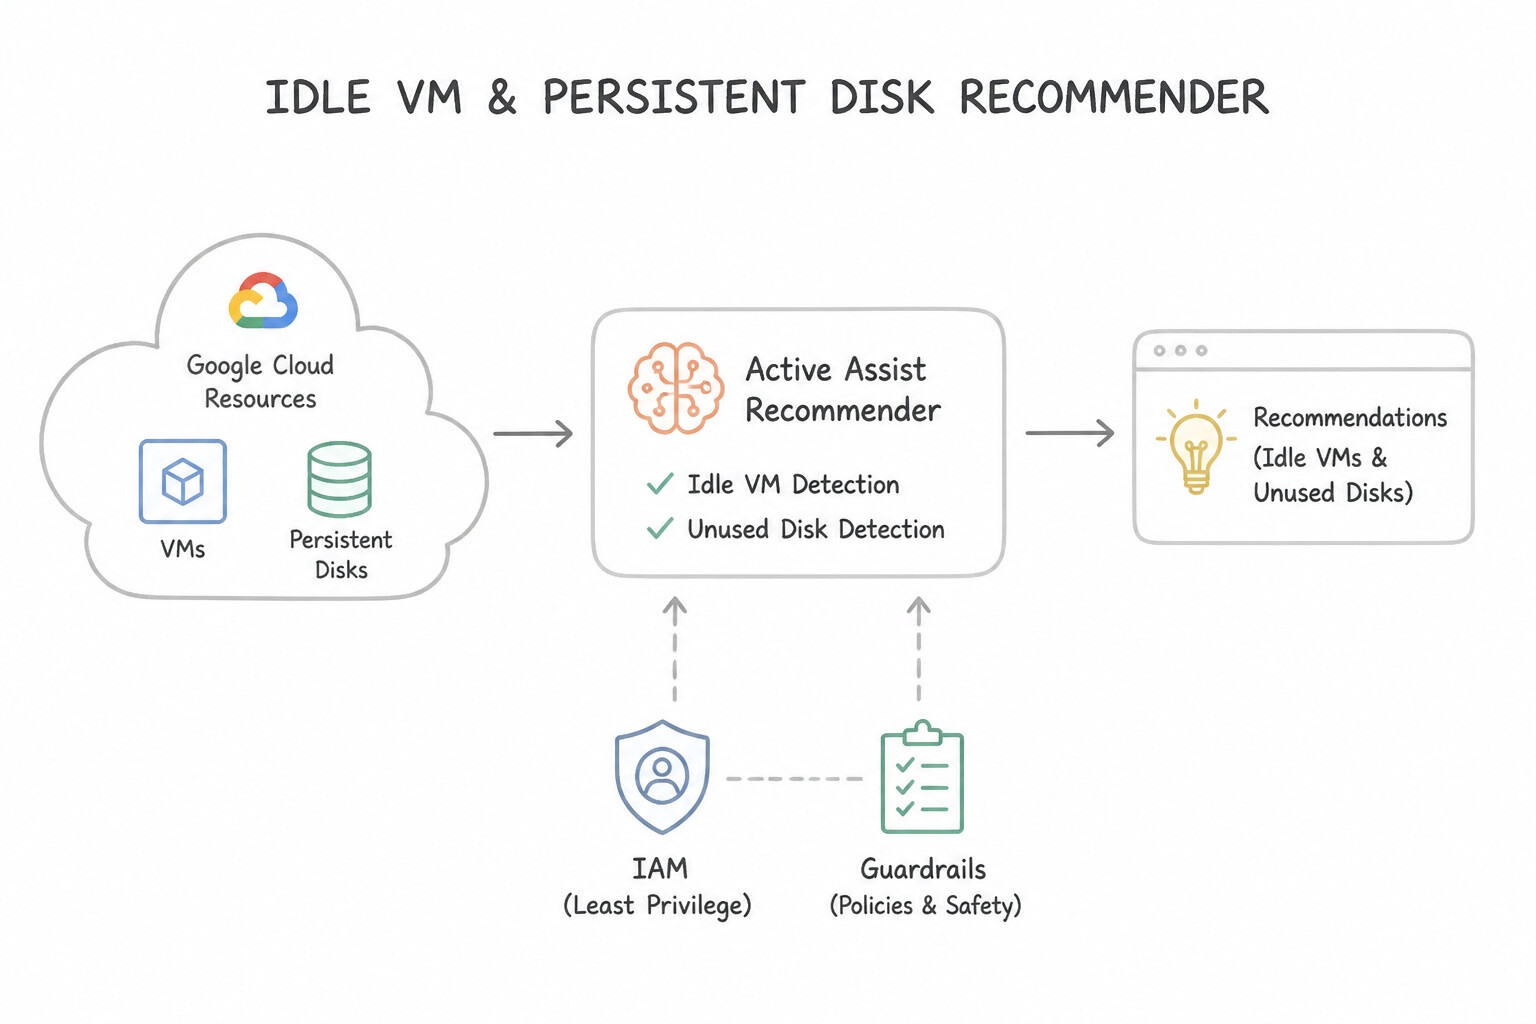
- Idle VM & Persistent Disk Recommender: Flags VMs and unattached disks with near-zero utilization so you can stop, snapshot, or delete them.
- VM Machine Type Recommender (Right-Sizing): Recommends downsizing over-provisioned VMs (e.g.,
n2-standard-16running at 8% CPU →n2-standard-4) or switching to custom machine types. - Committed Use Discount (CUD) Recommender: Analyzes steady-state baseline compute spend and recommends 1-year or 3-year commitments.
- IAM Recommender: Identifies excess permissions unused for 90 days and recommends replacing broad roles (like
Editor) with least-privilege predefined or custom roles.\n
Key Implementation Patterns
- Enhancing Security via IAM Recommendations: Use Navigate to the IAM page in the Google Cloud console and review the IAM Recommender suggestions to apply safer, strictly scoped roles. IAM Recommender automatically analyzes past activity to suggest strictly scoped roles, enforcing least privilege.
Key Takeaways (3.4m)
- The Principle of Least Privilege ensures users have only the permissions they need.
- IAM Recommender (part of Active Assist) helps rightsize roles by analyzing past usage.
- Avoid using Basic roles (Viewer, Editor, Owner) in production when granular Predefined roles exist.
- Manual log analysis is inefficient compared to using built-in intelligence tools.
Consideration 3.4n: Using Cloud Hub to Monitor Active Events and Application Health Data
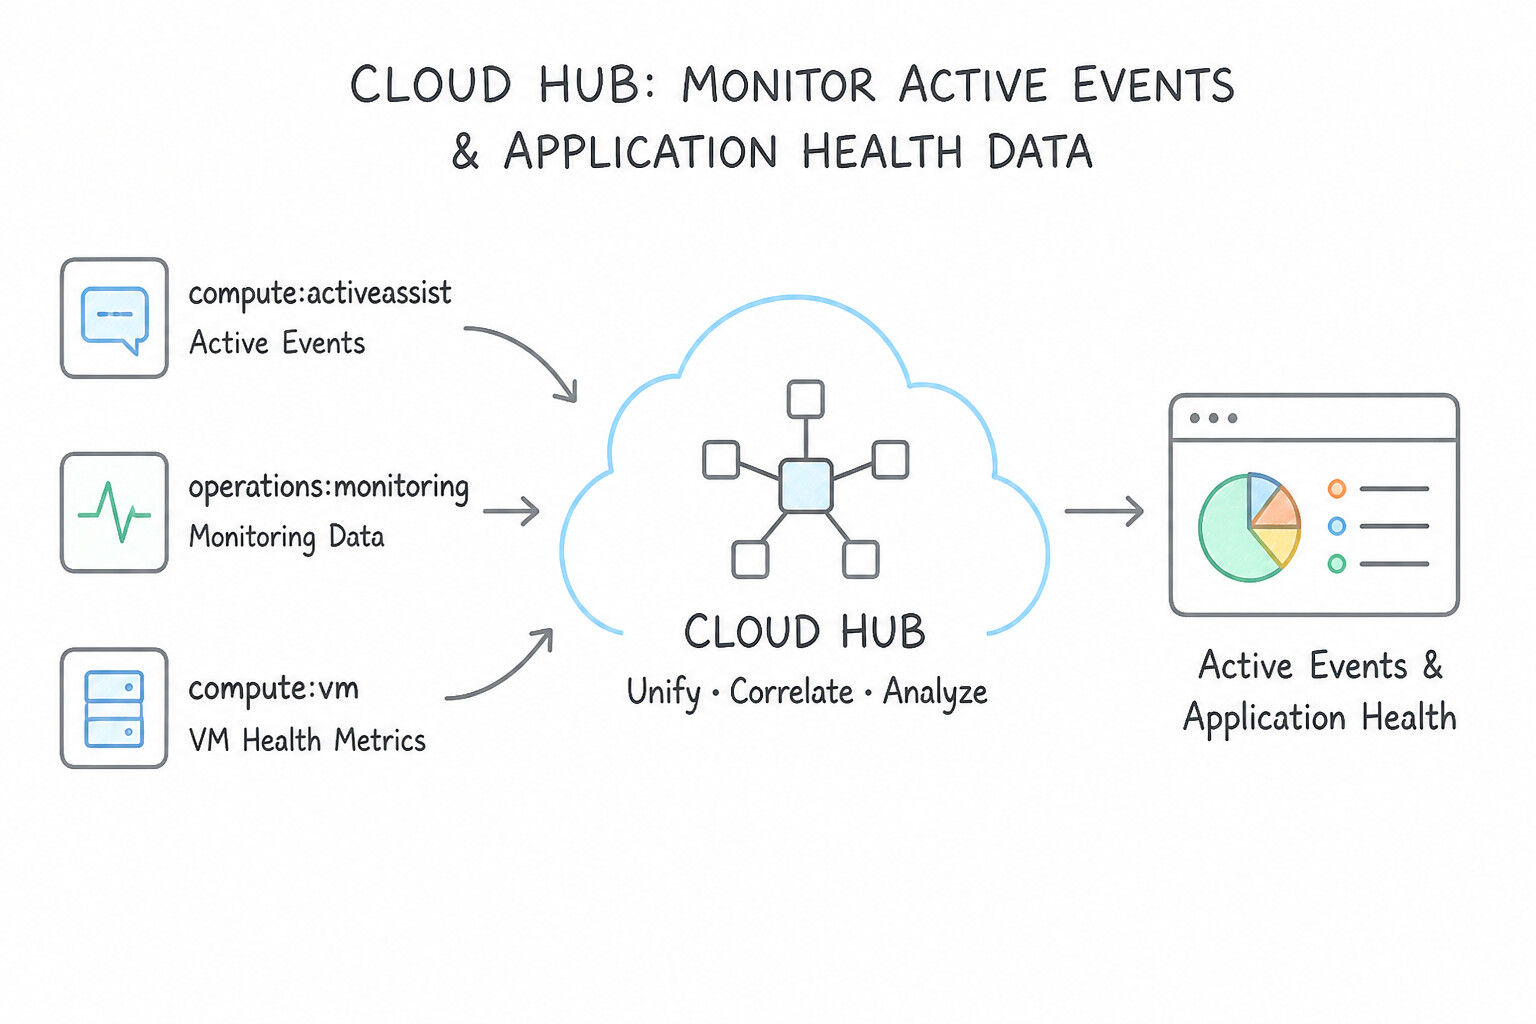
- What Cloud Hub Is: Cloud Hub is the centralized operational command center in the Google Cloud Console integrated with App Hub (Google Cloud's application-centric resource model).
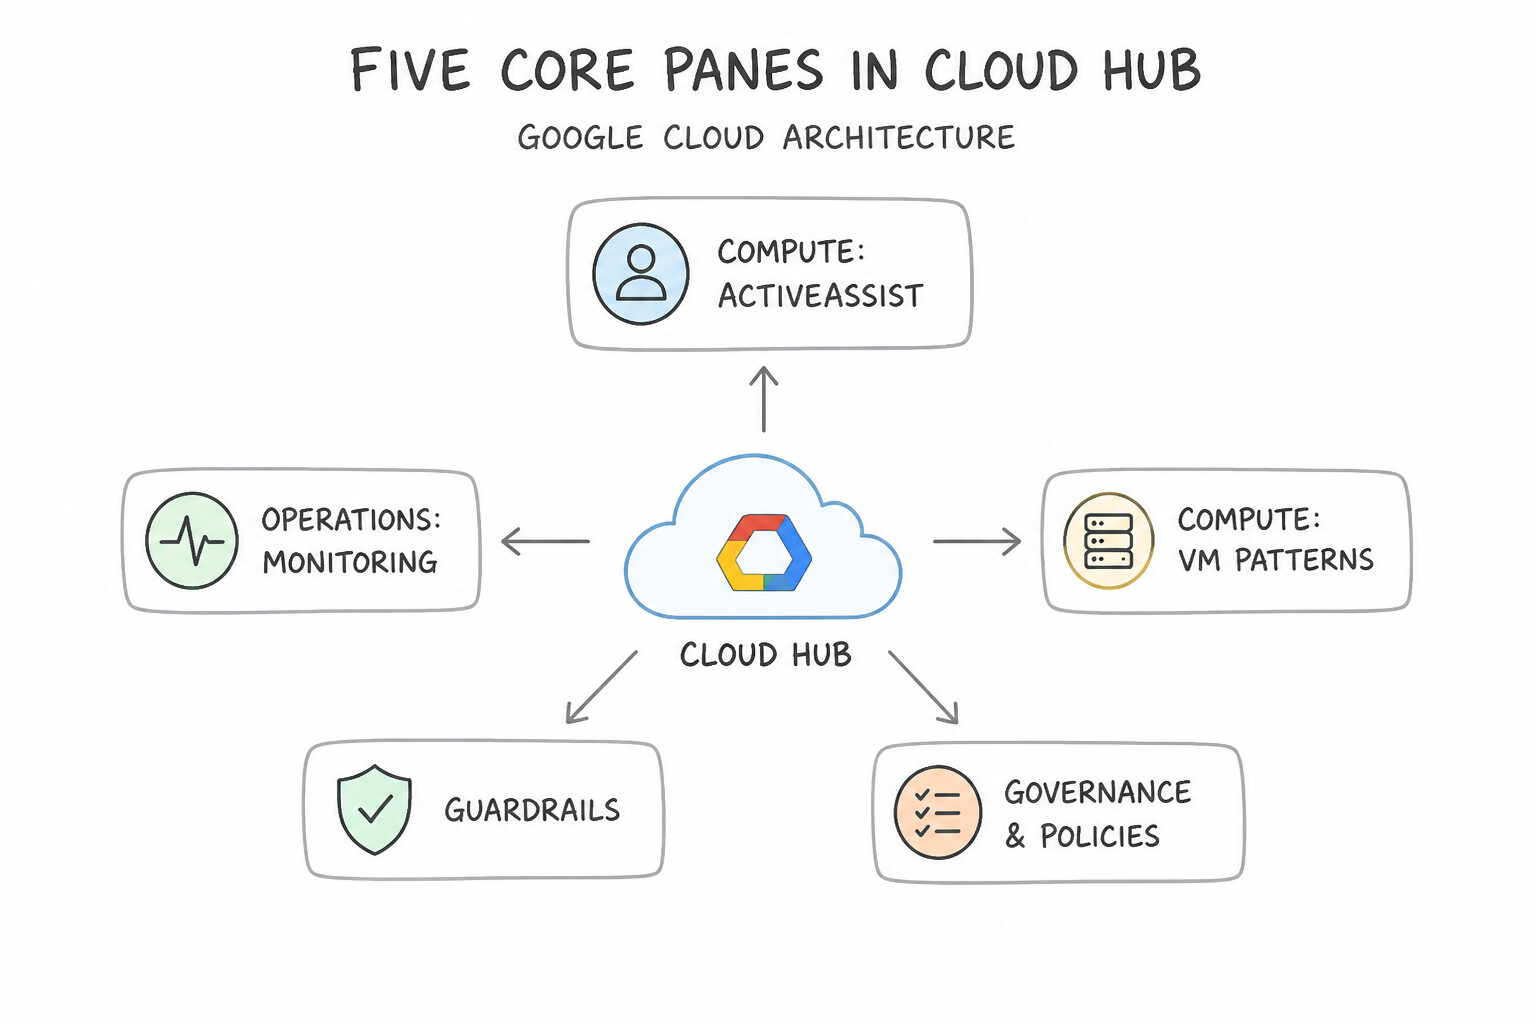
- Five Core Panes in Cloud Hub:
- Application Health & Alerts: Aggregates open Cloud Monitoring alerts, SLO burn rates, and error rates organized by logical App Hub Applications (rather than raw infrastructure lists).
- Active Google Cloud Events: Embeds Personalized Service Health incidents and upcoming Scheduled Maintenance Windows (for Cloud SQL, GKE, Compute Engine) affecting your fleet.
- Optimization & Cost Signals: Surfaces top Active Assist cost, performance, and reliability recommendations.
- Quota & Capacity Utilization: Highlights quotas approaching 80%+ exhaustion across regions.
- Recent Deployments: Correlates recent GKE, Cloud Run, and Infrastructure Manager deployments with active incident timelines.
Key Implementation Patterns
- Identifying Over-provisioned Compute Instances: Use Review the rightsizing recommendations in the VM instances page of the Google Cloud console. Active Assist rightsizing recommendations automatically identify underutilized VMs and suggest smaller machine types based on historical usage.
- Handling Idle Resources in Development: Use View the Idle VM Recommender recommendations in the Google Cloud console and apply the suggested actions. The Idle VM Recommender automatically identifies VMs with low CPU and network activity over a 14-day period and suggests stopping them.
Key Takeaways (3.4n)
- Active Assist provides automated recommendations to optimize resource usage and cost.
- Rightsizing recommendations use historical monitoring data (CPU, RAM) to suggest machine type changes.
- Always check the Recommendation Hub or VM list for native optimization tips before attempting manual analysis.
- Active Assist Recommenders are built-in tools that help optimize cost, security, and performance automatically.
Quick Decision Cheat Sheet (Subsection 3.4)
If the Scenario Requires... | Choose This Google Cloud Pattern | Avoid This Common Mistake |
|---|---|---|
"Ops Agent is installed on a VM, but no logs or metrics appear in Cloud Console" | Grant roles/logging.logWriter and roles/monitoring.metricWriter to the VM's Service Account + ensure Private Google Access (if private VM) | Granting Project Viewer; opening inbound firewall ports on the VM (the Ops Agent pushes outbound to Google APIs!) |
"Audit who queried a sensitive table or read objects in a Cloud Storage bucket" | Enable Data Access Audit Logs ( DATA_READ / DATA_WRITE) for that service | Checking Admin Activity logs (Admin Activity only logs resource creation/config changes, not data reads) |
"Drop noisy health-check logs so they do not incur Cloud Logging ingestion charges" | Add an Exclusion Filter on the _Default Log Router Sink | Deleting logs after they land in the Log Bucket (you are still billed for ingestion!) |
"Count how many times a specific error string appears in application logs and trigger an alert" | Create a Log-Based Counter Metric and attach a Cloud Monitoring Alerting Policy | Writing a custom Python script to poll the Logging API every minute |
"Investigate why an end-to-end HTTP request across 6 Cloud Run services takes 4.2 seconds" | Cloud Trace (distributed request tracing) | Cloud Profiler; VPC Flow Logs |
"Find slow SQL queries and get automated CREATE INDEX recommendations on Cloud SQL" | Cloud SQL Query Insights & Index Advisor | Enabling general SQL query logging to local disk |
"Automatically identify idle VMs, oversized machine types, and unused IAM permissions" | Active Assist (Idle VM Recommender, Machine Type Recommender, IAM Recommender) | Cloud Asset Inventory alone (inventories assets, does not compute ML right-sizing recommendations) |
Further Reading (Subsection 3.4)
- Introduction to alerting — Provides an overview of how alerting policies work, including metrics, conditions, and notification channels.
- Create metric-threshold alerting policies — Explains how to set up alerts based on metric thresholds, including setting duration windows.
- Monitoring your logs — Documentation explaining how to configure log-based alerts to notify you when specific logs appear.
- Alerting overview — Explains alerting policy types, including metric-based and log-based policies.
- Manage uptime checks — This is the current documentation page for creating, editing, and managing Uptime Checks in Cloud Monitoring, which provides the functionality described in the context.
- Ops Agent Overview — Documentation explaining the Ops Agent, which collects telemetry from Compute Engine instances.
Book TOC · Previous · Chapter 6 of 8 · Next
AwesomeGCP.com Learning
The approach taken is a question-led learning approach: you explore realistic project scenarios where you need to make decisions or take actions to achieve business goals within specific constraints. Instead of passive learning, you are challenged to think and work through the options to master the Associate Cloud Engineer (ACE) certification!