Book TOC · Previous · Chapter 5 of 6 · Next
Chapter 5: Optimizing Performance & Cost: Cloud Profiler, Active Assist & Cloud FinOps Practices
Chapter Focus: Continuous CPU/heap profiling with Cloud Profiler, Active Assist right-sizing/idle recommendations, CUDs vs. Spot VMs, GKE cost allocation, and observability ingestion cost optimization.
Subsection 5.1: Collecting performance information in Google Cloud
The Big Picture
Even with mature CI/CD pipelines and staging environments, two performance and optimization challenges only surface in live production across hundreds of projects:
- Production-Only Code Hotspots (5.1a): A Go, Java, Python, or Node.js microservice may run smoothly in staging with synthetic test data, yet consume $3\times$ more CPU or leak heap memory in production due to real customer payload shapes, regex backtracking, or lock contention. Attaching a traditional debugger or high-overhead local profiler in production slows down user requests by 30–50%. Google Cloud Profiler solves this using continuous statistical sampling in production with < 0.5%–5% overhead, rendering interactive Flame Graphs that pinpoint the exact function name and line of code consuming CPU cycles or heap allocations.
- Organization-Wide Configuration Blind Spots (5.1b): Across an enterprise with 300 projects, no human team can manually inspect every VM's 30-day CPU curve, every Cloud SQL instance's slow query log, every over-privileged IAM binding, and every idle persistent disk. Active Assist (Google Cloud's portfolio of machine-learning-powered Recommenders and Insights) continuously analyzes telemetry across five pillars—Cost, Security, Performance, Reliability, and Manageability—and exports actionable recommendations directly to BigQuery for organization-wide governance.
Consideration 5.1a: Application performance monitoring
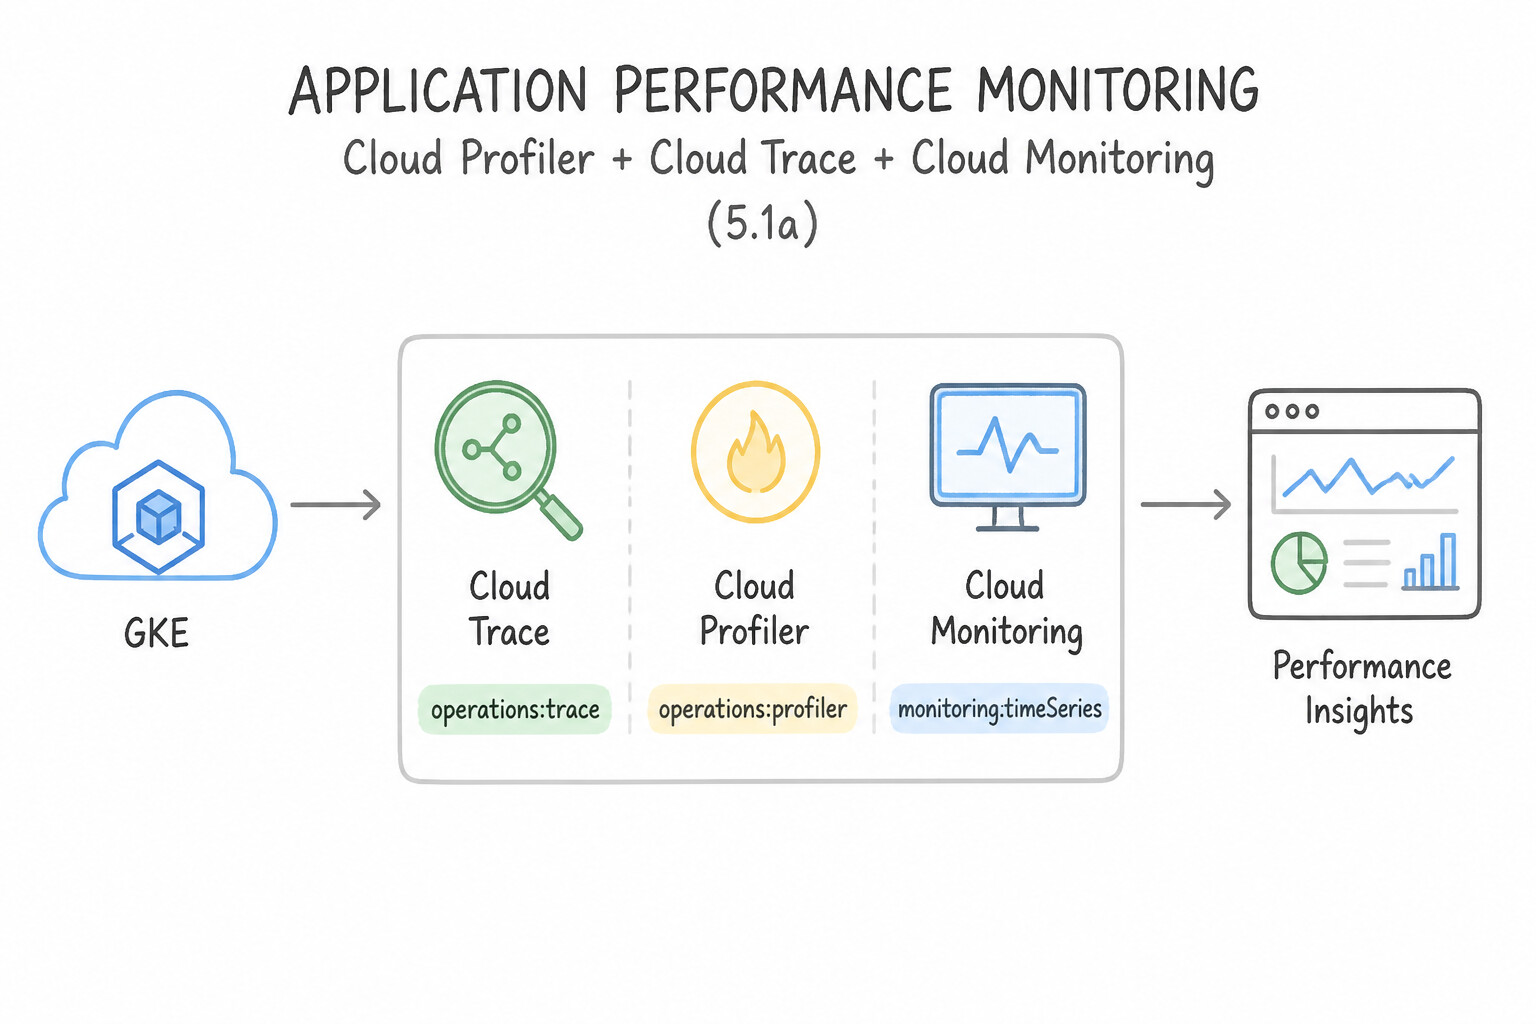
- Application Performance Monitoring (
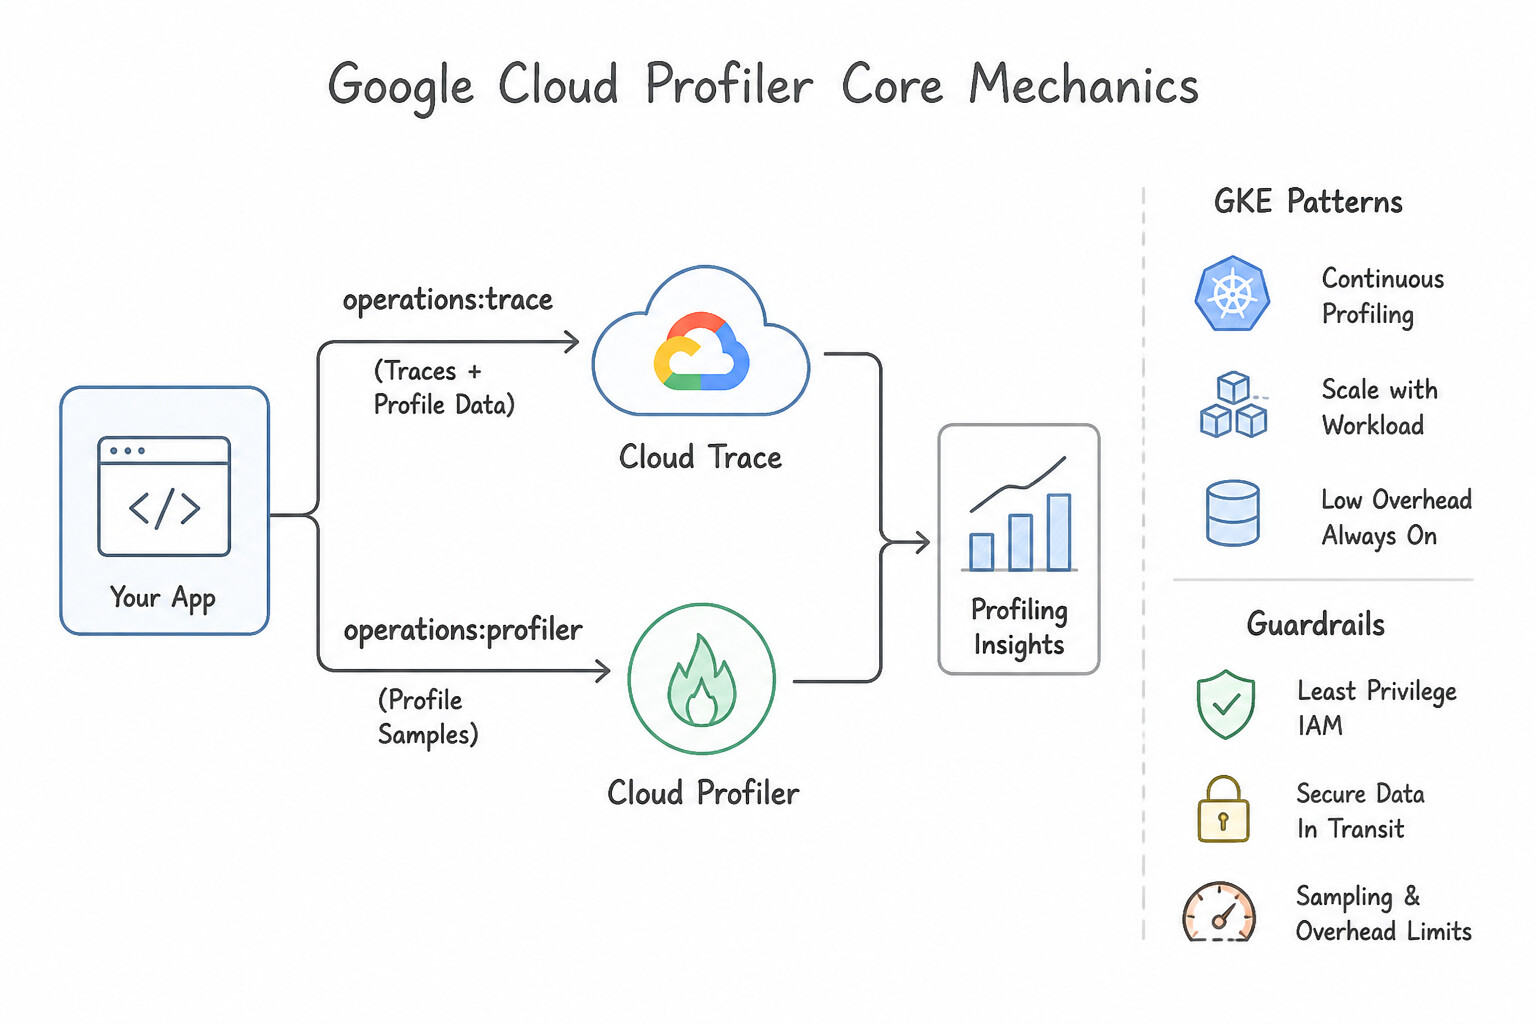
Cloud Profiler+Cloud Trace+Cloud Monitoring—5.1a): - Cloud Profiler Core Mechanics:
- Continuously collects statistical call-stack samples from production applications (Go, Java, Node.js, Python) running on GKE, Compute Engine, Cloud Run, App Engine, or even on-premises/multi-cloud with negligible overhead (~0.5% to <5% CPU).
- Supported Profile Types:
- CPU Time: Where the process spends actual CPU cycles executing instructions (ignoring time spent sleeping or waiting on network/disk I/O).
- Wall Time: Total elapsed real-world time inside a function (including time blocked waiting on locks, network RPCs, or disk I/O!).
- Heap / Allocated Heap: Memory currently live on the heap (to find memory leaks) vs. total memory allocated over time (to find excessive garbage collection [
GC] churn). - Contention / Threads / Goroutines: Where threads or goroutines block waiting on mutex locks.
- How to Read a Flame Graph: The horizontal width of a frame represents the percentage of total resource consumption (CPU or memory) attributable to that function and its children. The vertical depth simply shows the call-stack hierarchy (
main() -> handleCheckout() -> parseRegex()). Always look for the widest "plateaus" at the bottom/leaf edges of the flame graph—those are the functions doing the heavy work! Use Compare Profiles (filtering byversionorzone) to diffv1.2againstv1.1visually.
Key Implementation Patterns
- Identifying Latency in Microservices: Use Instrument the application to send data to Cloud Trace and analyze the waterfall graphs. Cloud Trace visualizes the request path and latency across distributed microservices using waterfall graphs. (Avoid alternative: Cloud Profiler measures code resource usage (CPU/RAM) within a single service, not latency across multiple services.)
- Monitoring Business Logic Metrics: Use Instrument your application code using the OpenTelemetry SDK to define and export custom metrics. Custom metrics defined via code instrumentation (OpenTelemetry) are required to track internal business logic states. (Avoid alternative: The Ops Agent collects infrastructure metrics (CPU, RAM), not application-specific business data.)
- Cost-Effective CPU Optimization: Use Configure the application to use the Cloud Profiler agent to collect and analyze CPU profiles. Cloud Profiler provides low-overhead, function-level visibility into resource consumption (CPU/RAM) specifically for production environments.
Key Takeaways (5.1a)
- Use Cloud Trace for analyzing latency and request flows in distributed systems.
- Use Cloud Profiler to optimize code performance (CPU/Memory) within a single service.
- Use Cloud Monitoring for dashboards, metrics, and alerting on infrastructure health.
- Use Cloud Logging for searching error messages and auditing events.
Consideration 5.1b: Active Assist insights and recommendations
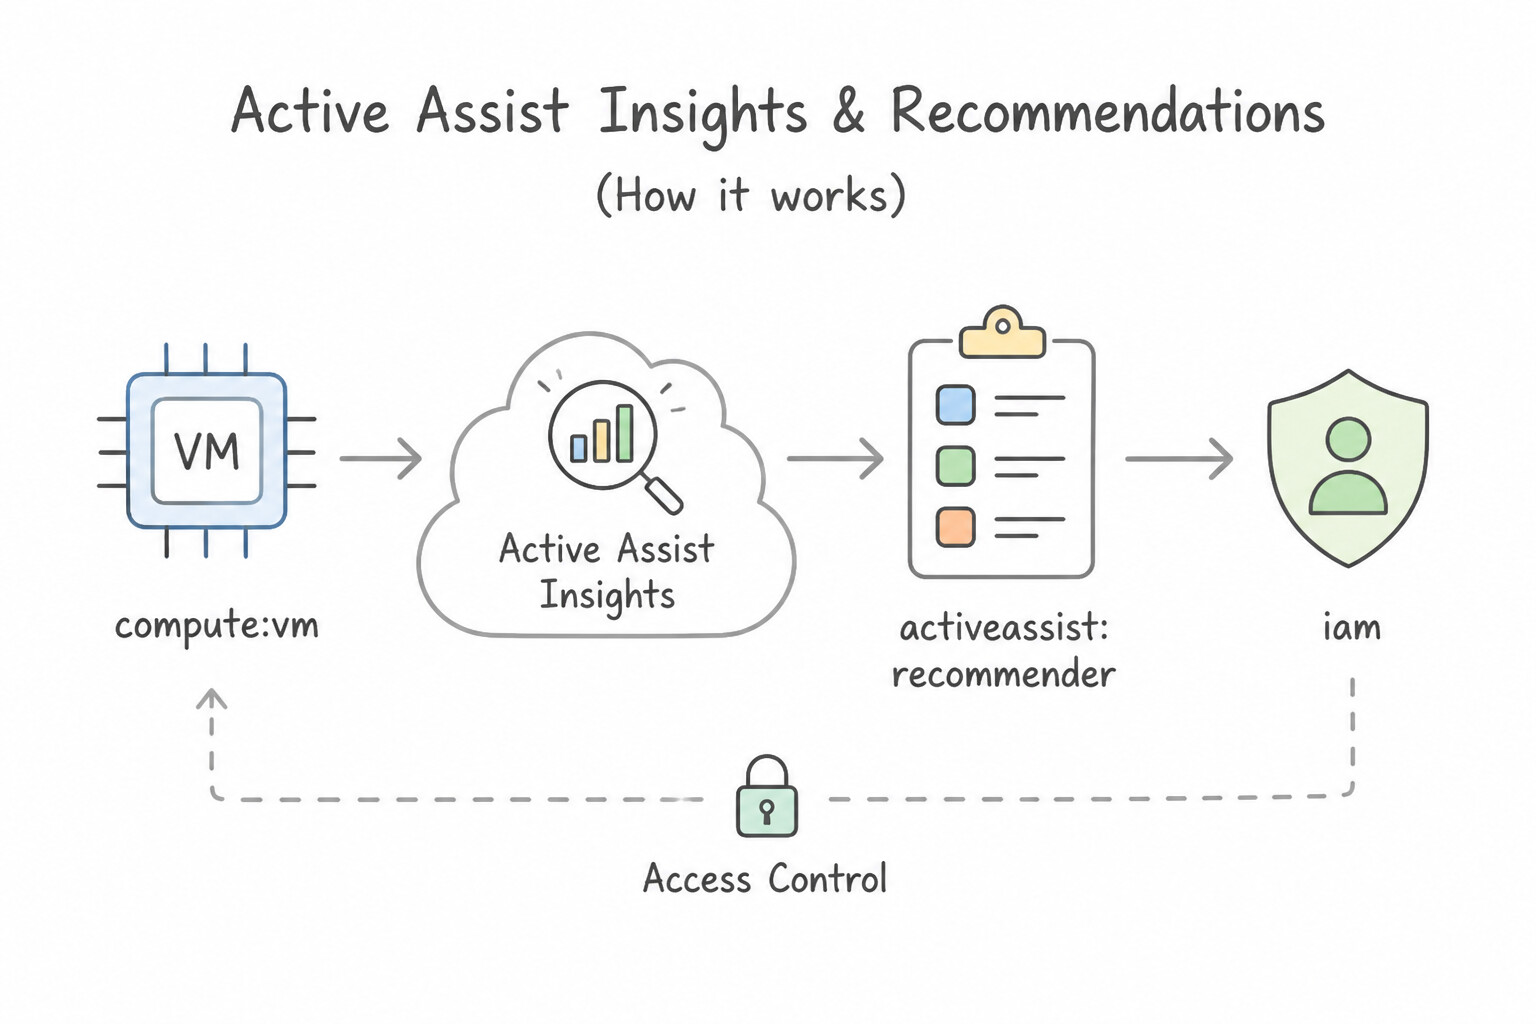
- Active Assist Insights & Recommenders (5.1b):
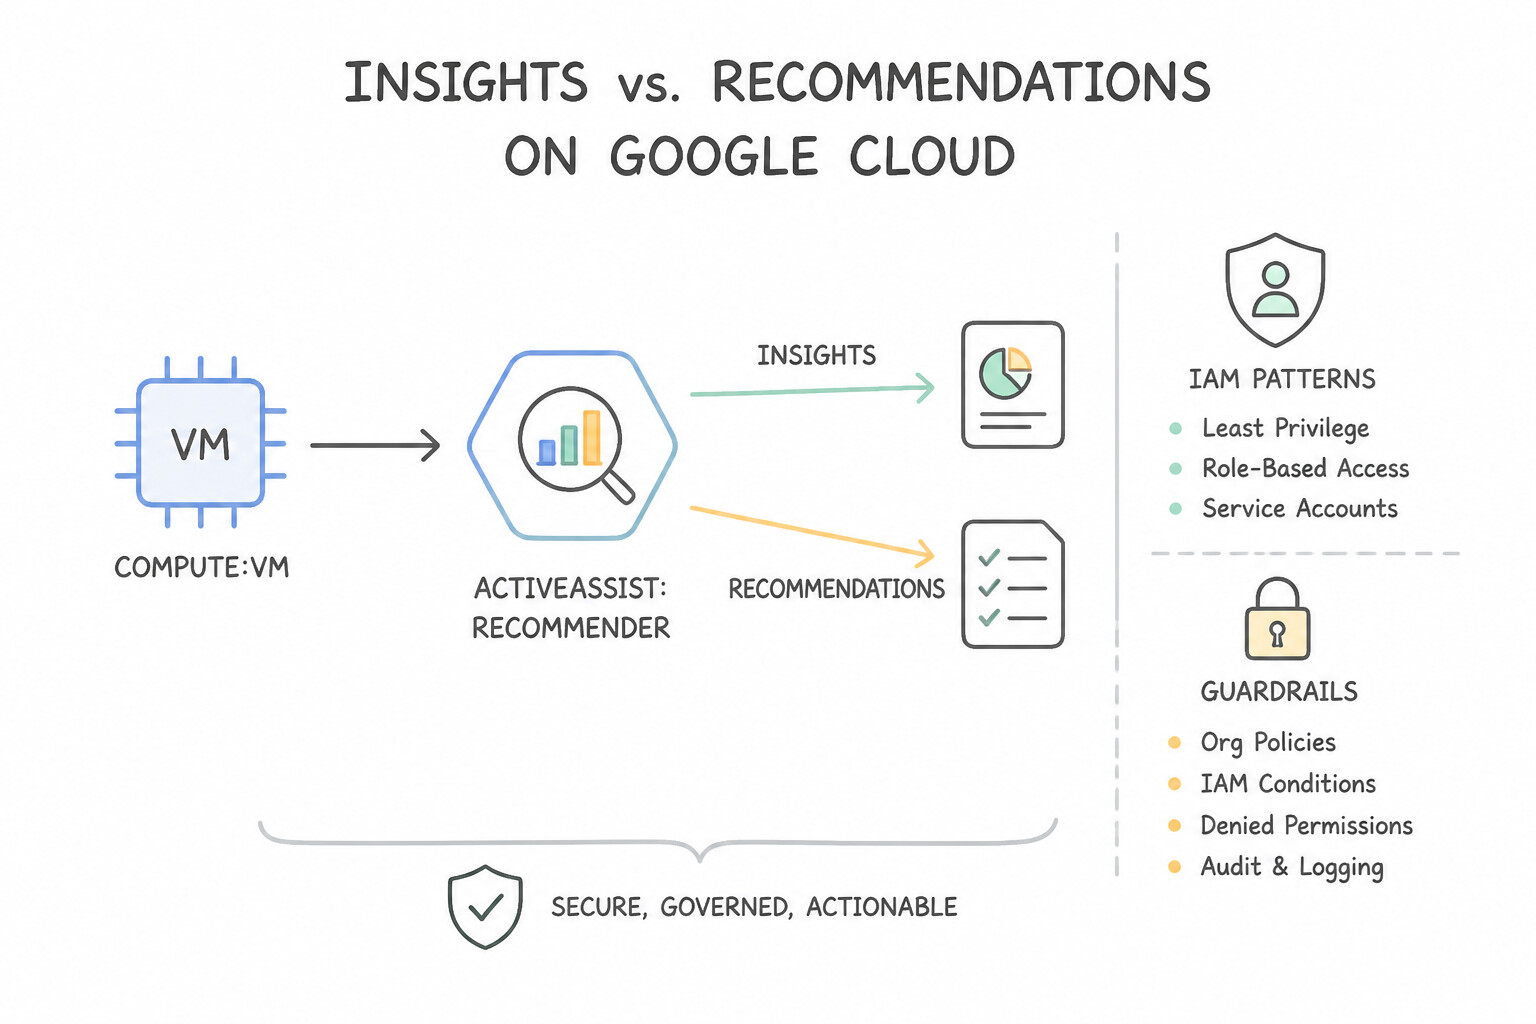
- Insights vs. Recommendations:
- An Insight is a factual observation detected from historical telemetry (e.g., "Service Account X has not used 42 of its 45 granted permissions in the last 90 days", or "VM Y has had < 2% CPU and network utilization for 14 days").
- A Recommendation is the concrete, actionable remediation generated from that insight (e.g., "Replace
roles/editorwithroles/storage.objectViewer" or "Stop or delete idle VM Y to save $180/month"). - The 5 Active Assist Value Pillars:
- Cost: Idle VM/Disk/IP/Cloud SQL recommenders, VM Machine Type Rightsizing, GKE Idle Cluster, Committed Use Discount (CUD) recommender.
- Security: IAM Recommender (least privilege), Firewall Insights (shadowed or overly permissive rules), Unattended Project Recommender (detecting abandoned projects with owner risk).
- Performance: VM Resize-Up recommendations (under-provisioned CPU-bound VMs), Cloud SQL Performance / Index Recommender (missing database indexes causing full table scans).
- Reliability: MIG zone-balance recommendations, Cloud SQL High Availability (HA) and backup recommendations.
- Manageability: Project cleanup and resource organization recommendations.
- Automating Active Assist at Enterprise Scale: Use the Recommender API or BigQuery Export for Recommendations at the Organization level to query all recommendations via SQL, visualize savings in Looker Studio, and trigger automated remediation pipelines.
Key Implementation Patterns
- Identifying Idle Virtual Machines in Non-Production Environments: Use Review the recommendations provided by the Idle VM Recommender in the Google Cloud console. The Idle VM Recommender automatically identifies inactive instances based on historical usage data. (Avoid alternative: Manual monitoring is inefficient and not automated.)
- Optimizing IAM Roles for Least Privilege: Use Review the suggestions provided by IAM Recommender. Apply the recommended role changes to align permissions with historical usage. IAM Recommender analyzes usage history over 90 days and suggests safer, less permissive roles automatically.
- Rightsizing Overprovisioned Compute Instances: Use Review the rightsizing recommendations generated by Active Assist in the Google Cloud console. Active Assist automatically analyzes usage and provides rightsizing recommendations. (Avoid alternative: Manual analysis using BigQuery is inefficient when automated recommendations are available.)
Key Takeaways (5.1b)
- Active Assist provides automated insights to optimize cloud usage.
- The Idle VM Recommender specifically targets cost reduction by finding unused instances.
- Always look for built-in platform features before building custom monitoring solutions.
- IAM Recommender analyzes the last 90 days of permission usage to identify over-privileged roles.
Quick Decision Cheat Sheet (Subsection 5.1)
If the Scenario Requires... | Choose This Google Cloud Pattern | Avoid This Common Mistake |
|---|---|---|
"Find CPU or memory 'hotspots' at the function/method level inside production code with < 1% overhead" | Cloud Profiler (Flame Graph) | Adding print(time.now()) statements around every function in source code |
"How do you identify the most expensive function in a Cloud Profiler Flame Graph?" | Look for the widest horizontal bar (frame) (especially wide leaf frames at the edge of the stack) | Looking only at the tallest vertical stack depth or brightest random color |
"IAM role required for a GKE or Compute Engine Service Account to send profiles to Cloud Profiler" | roles/cloudprofiler.agent | roles/owner or roles/monitoring.admin |
"Automatically detect abandoned 'zombie' GCP projects across an enterprise organization" | Use the Active Assist Unattended Project Recommender | Manually emailing every project creator once a year |
"Identify shadowed firewall rules or overly permissive 0.0.0.0/0 rules that have had zero hits in 90 days" | Use Firewall Insights (part of Active Assist / Network Intelligence Center) | Disabling firewall rules randomly in production to see what breaks |
Further Reading (Subsection 5.1)
- Cloud Trace overview — Provides an introduction to Cloud Trace, explaining how it collects latency data and helps visualize call chains in microservices.
- Get started with the OpenTelemetry Collector — Overview of how to use OpenTelemetry to send metric data to Google Cloud Monitoring.
- User-defined metrics — Explains the concept of user-defined (custom) metrics and when to use them versus system metrics.
- Profiling concepts — Explains how continuous profiling works, the concept of sampling to reduce overhead, and how flame graphs visualize resource consumption.
- Applying idle VM recommendations — Documentation explaining how the Idle VM recommender works, including the 14-day observation period and how to apply the recommendations.
- Role recommendations overview — Provides an overview of how IAM Recommender generates role recommendations based on usage history.
Subsection 5.2: Implementing FinOps practices for optimizing resource utilization and costs
The Big Picture
Moving workloads to Google Cloud without Cloud FinOps practices—treating compute, storage, networking, and observability as fixed data-center capital expenses—leads to massive financial waste across six dimensions:
- Unbounded Observability Ingestion (5.2a): Ingesting terabytes of verbose
DEBUGlogs, duplicate multi-sink logs, high-frequency VPC Flow Logs, and high-cardinality Prometheus metrics often makes Cloud Logging and Monitoring the #2 line item on the monthly invoice! - Paying On-Demand Prices for Stateless Batch & Fault-Tolerant Nodes (5.2b): Running CI/CD build runners, batch data processing, rendering jobs, or stateless GKE worker pools on full-price on-demand VMs ignores up to 91% savings available from Spot VMs (the modern successor to legacy Preemptible VMs, with no 24-hour max runtime limit!).
- Leaving Discount Commitments & Network Tier Choices on the Table (5.2d): Running steady-state 24/7 baseline compute without 1-year or 3-year Committed Use Discounts (
CUDs) (Resource-based vs. Spend-based Flexible CUDs) wastes 37%–55%+ of compute spend, while using the Premium Network Service Tier for non-latency-sensitive bulk batch transfers pays for global private fiber backbone routing where the Standard Network Tier suffices. - Over-Provisioned GKE Pods, Idle Cloud Run Instances, and Oversized VMs (
5.2c,5.2e,5.2f): When developers setrequests.cpu: 4on GKE pods that actually use0.2 vCPU, Cluster Autoscaler provisions $20\times$ more nodes than needed (bin-packing waste). Combining GKE Cost Allocation, VPA recommendations / GKE Autopilot, Cloud Run scale-to-zero / CPU allocation (cpu-throttling), and Active Assist Recommenders closes the loop between engineering architecture and financial efficiency.
Consideration 5.2a: Observability costs
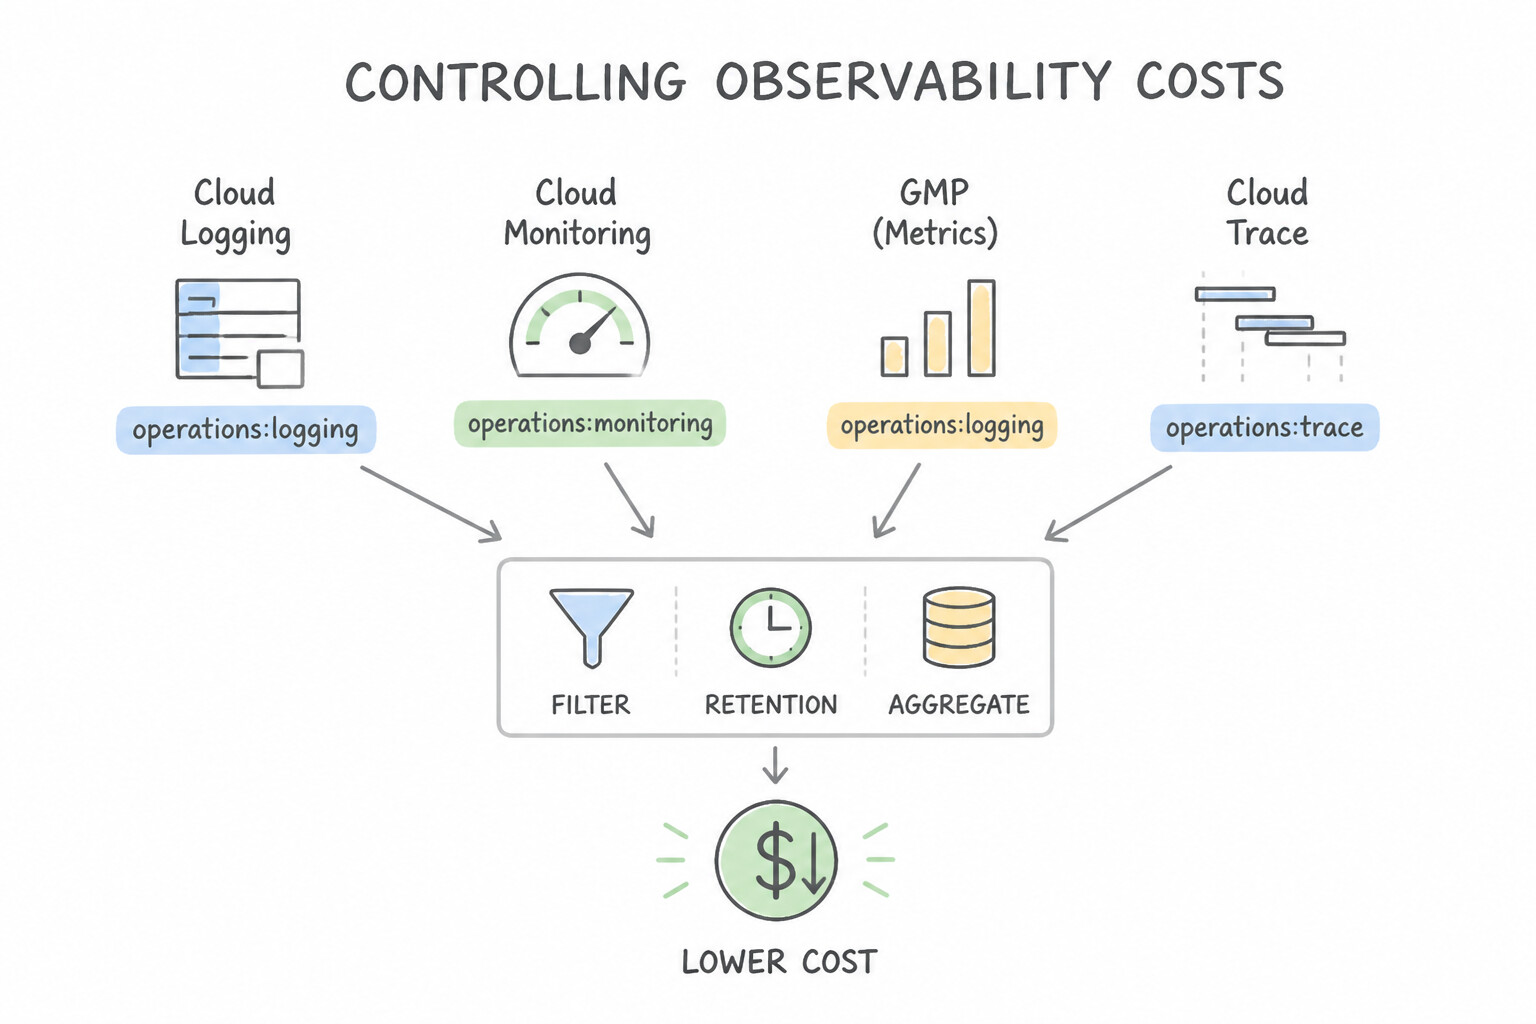
- Controlling Observability Costs (
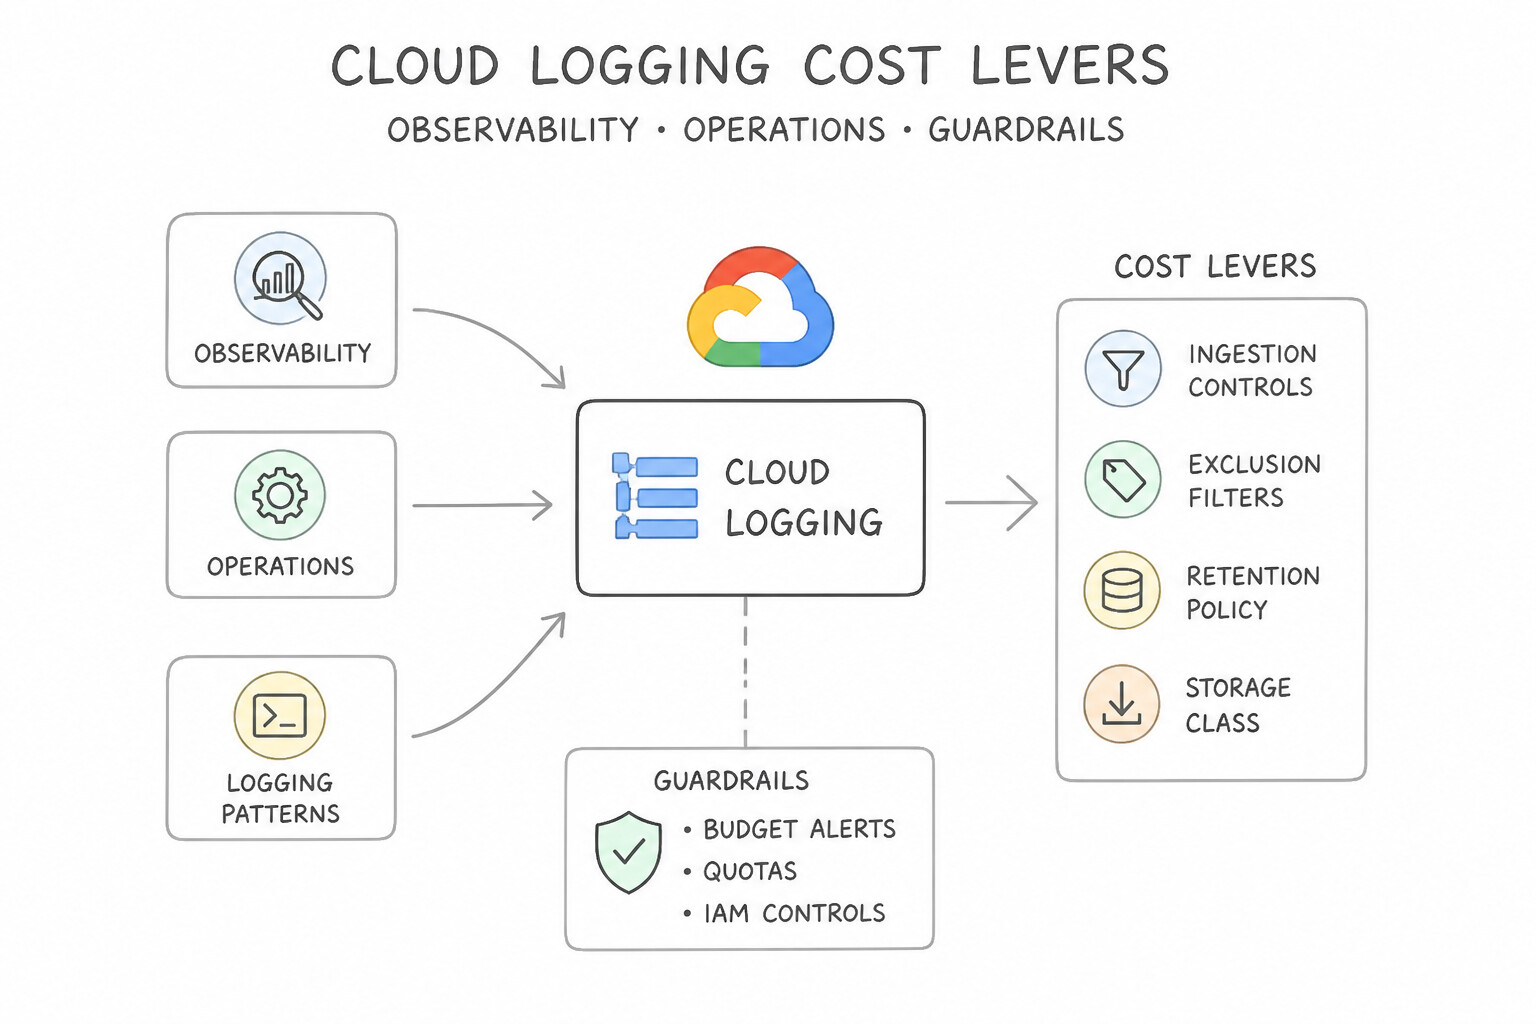
Cloud Logging,Cloud Monitoring,GMP,Cloud Trace—5.2a): - Cloud Logging Cost Levers:
- Exclude Before Ingestion: Add Exclusion Filters (or
sample(insertId, 0.1)) on the_DefaultLog Router sink to drop noisy health checks, static asset200 OKlogs, and non-prodDEBUG/INFOlogs. - Prevent Duplicate Sink Storage: When using an Organization/Folder-level Aggregated Sink, enable
interceptChildren=true(Intercepting Sink) if child projects don't need their own copy in_Default. - Optimize Long-Term Retention: Keep hot
_Defaultretention at 30 days and route long-term compliance logs to Cloud Storage (Coldline/Archive). - Cloud Monitoring & Managed Service for Prometheus (
GMP) Cost Levers: - Increase Scrape Interval: Changing GMP
PodMonitoringscrape intervals from10sto30sor60scuts metric ingestion volume and cost by 66%–83% immediately! - Drop Unneeded Metrics & High-Cardinality Labels: Use
metricRelabeling(action: drop) inPodMonitoringCRDs to drop unused high-volume Prometheus histograms before ingestion, and never attach unbounded labels (user_id,request_id).
Key Implementation Patterns
- Mitigating High Log Ingestion Costs via Exclusion Filters: Use Add an exclusion filter to the _Default log sink to drop logs with httpRequest.status=200. Exclusion filters prevent specific logs from being ingested into the log bucket, effectively stopping the associated costs.
- Controlling Cloud Trace Sampling Rates: Use Update the application trace configuration to use a lower sampling rate. Reducing the sampling rate lowers ingestion volume and costs while maintaining sufficient data to visualize performance trends. (Avoid alternative: Disabling the API stops costs but completely removes the required visibility into latency trends.)
- Optimizing Long-Term Log Retention Compliance: Use Create a log sink to export logs to a Cloud Storage bucket with an Archive storage class lifecycle policy. Exporting logs to a Cloud Storage bucket using the Archive class provides the lowest cost for long-term, rarely accessed compliance data.
Key Takeaways (5.2a)
- Cloud Logging Costs: The primary cost driver for high-volume logs is often ingestion, not just storage.
- Exclusion Filters: Use exclusion filters on the
_Defaultsink to discard unneeded logs (like verbose successes) to save money.- Granular Control: You can filter based on log payload contents (like
httpRequest.status) to keep valuable errors while dropping noise.- Source vs. Sink: Prefer filtering at the Log Router (Sink) level for granular control rather than disabling logging entirely at the resource source.
Consideration 5.2b: Spot virtual machines (VMs)
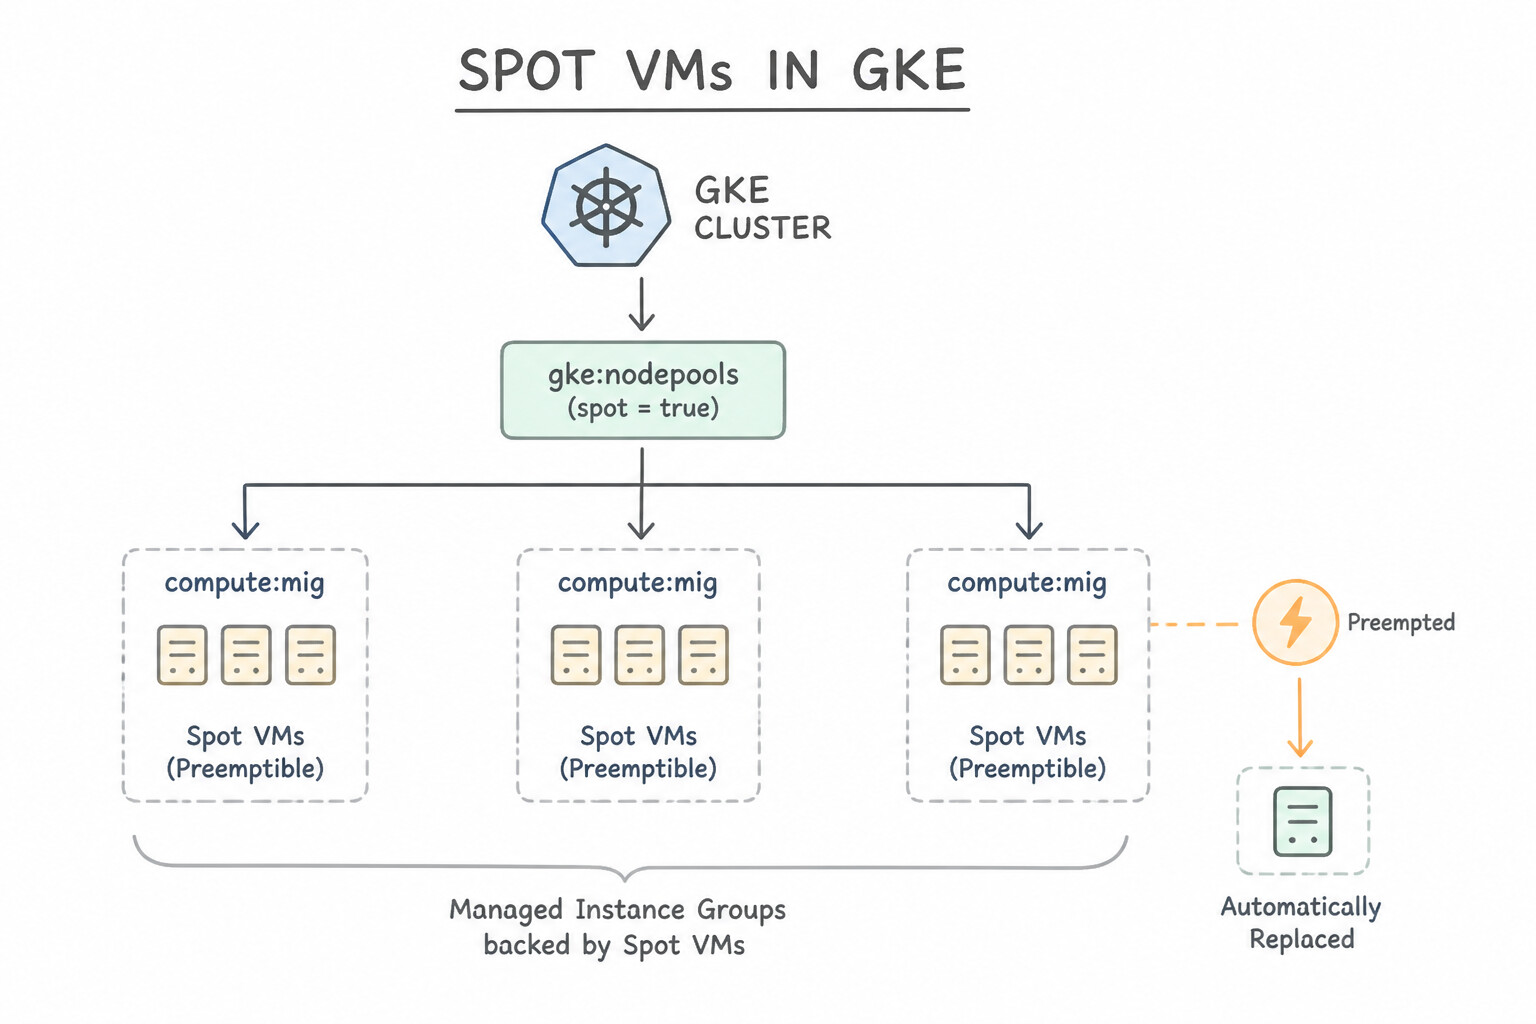
- Mastering Spot VMs (5.2b):
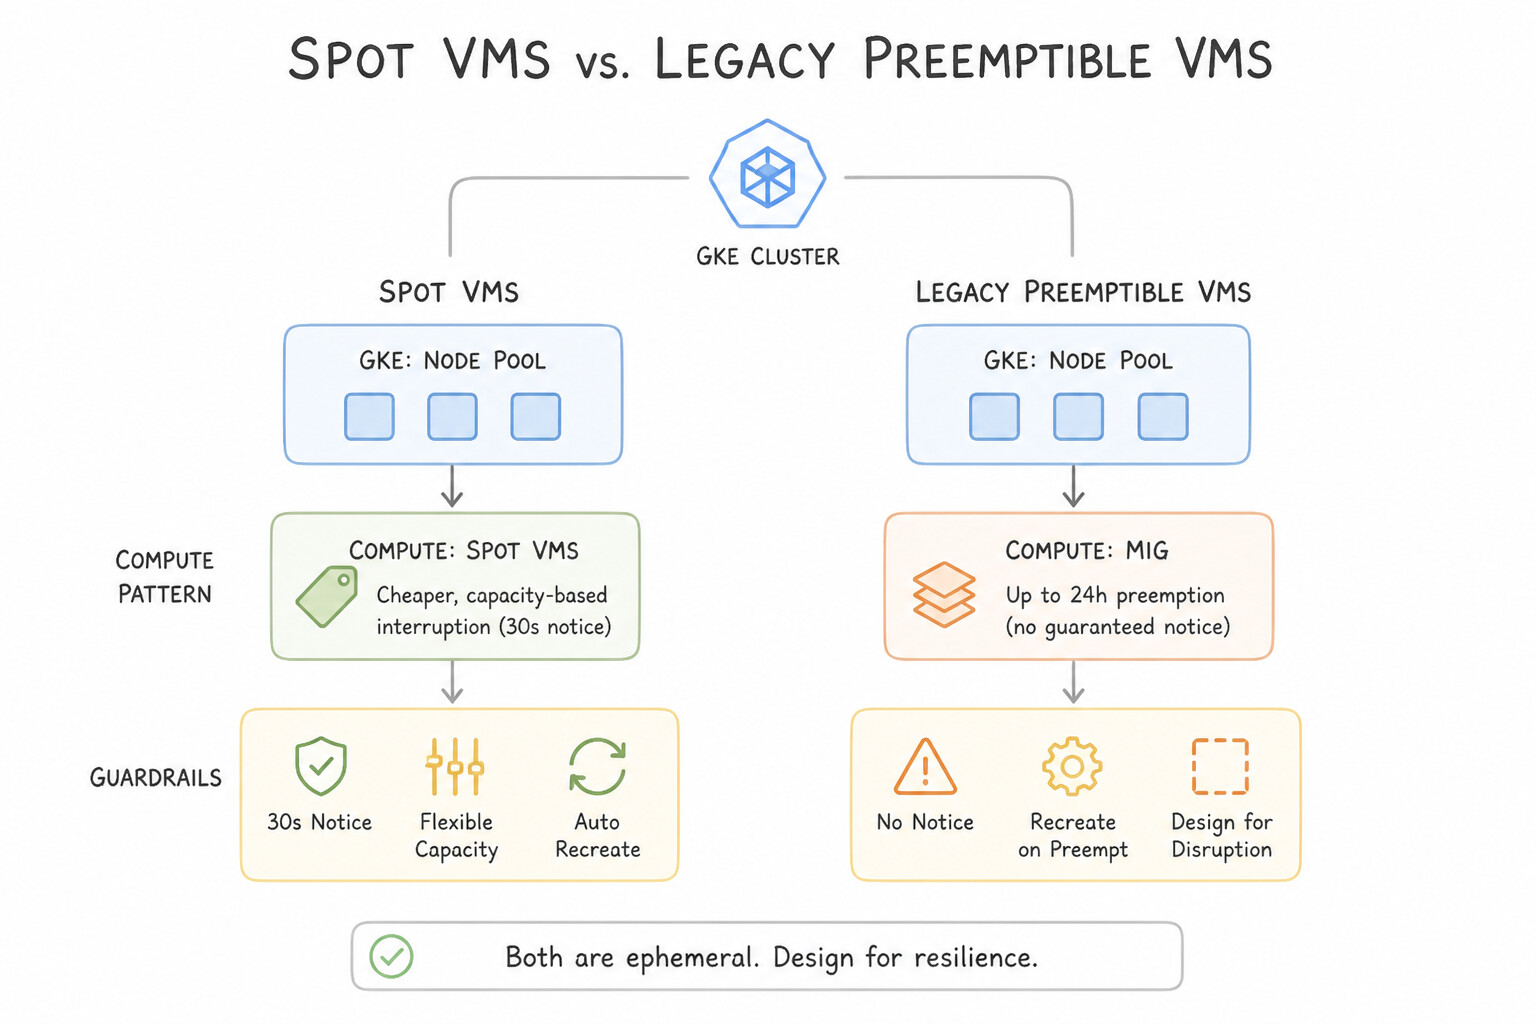
- Spot VMs vs. Legacy Preemptible VMs: Spot VMs offer the same massive 60%–91% discounts on spare Compute Engine capacity as legacy Preemptible VMs, without the legacy 24-hour maximum runtime limit!
- Ideal Workloads for Spot VMs: Stateless microservices (especially when mixed with a baseline on-demand node pool using GKE taints/tolerations and pod anti-affinity), batch data processing (Dataproc secondary workers, Dataflow FlexRS), CI/CD build workers, and checkpointed ML training jobs. Never run single-node stateful databases or quorum-critical control planes exclusively on Spot VMs!
- Handling the 30-Second Preemption Notice: When Compute Engine reclaims a Spot VM, it sends an
ACPI G2 Soft Offsignal (and sets metadatapreempted=TRUE), giving the VM up to 30 seconds before termination. Configure a Shutdown Script (shutdown-script) on VMs orterminationGracePeriodSeconds: 25+SIGTERMhandler on GKE Spot Pods to flush in-flight work, save checkpoints to Cloud Storage, and drain connections cleanly.
Key Implementation Patterns
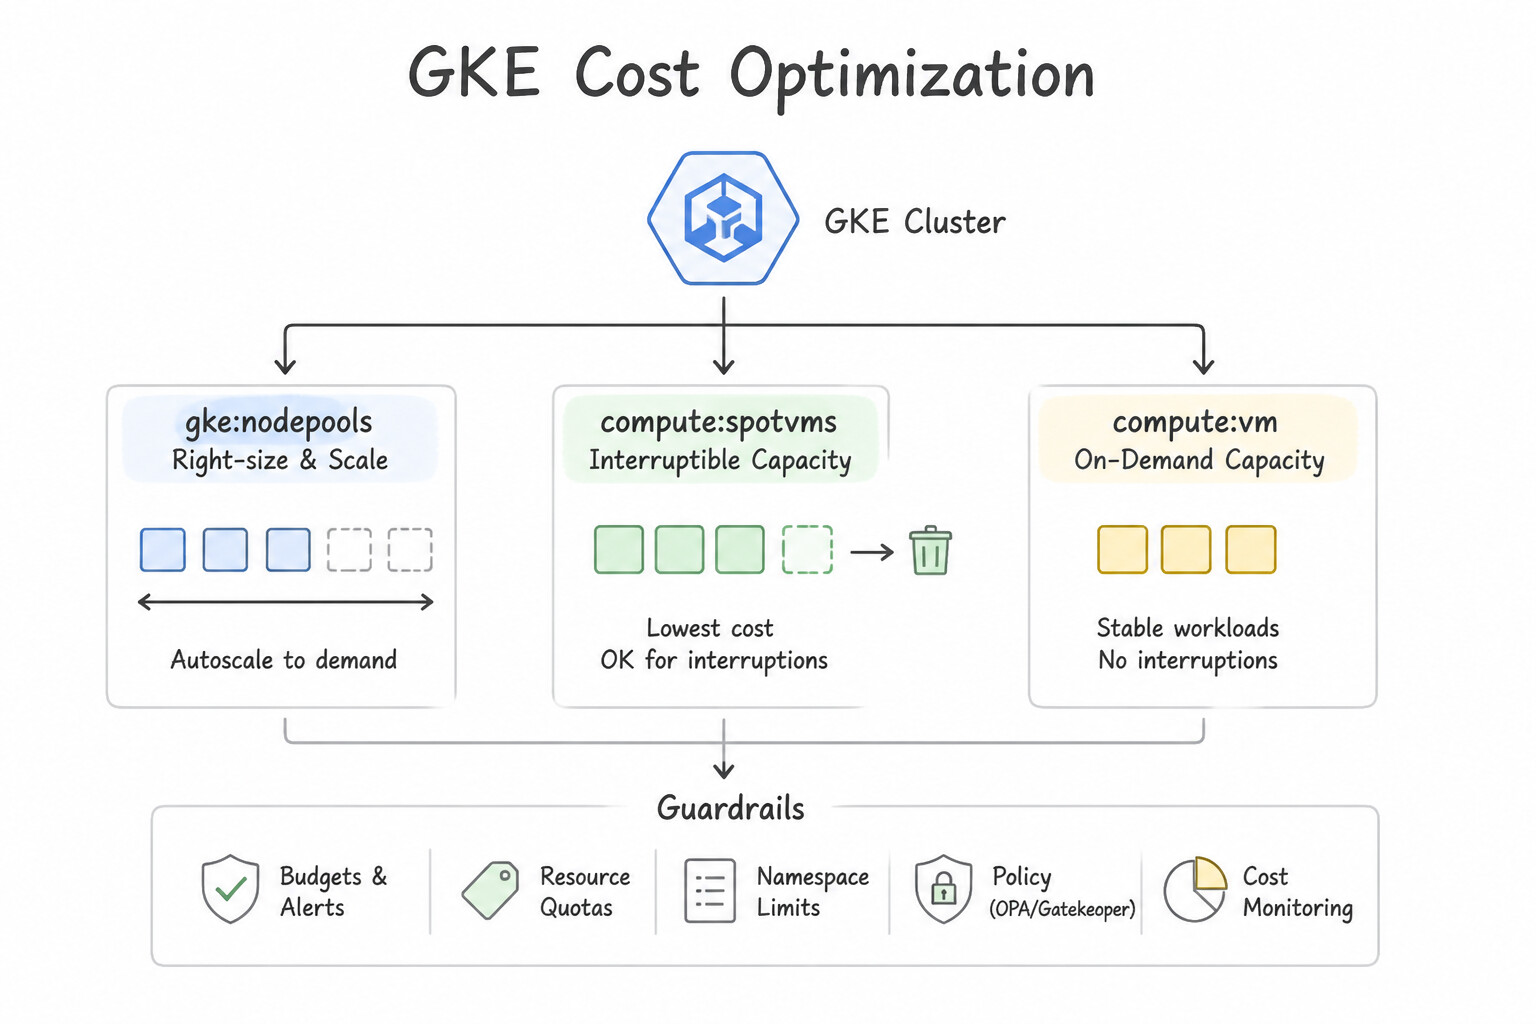
- Optimizing GKE Costs with Mixed Node Pools: Use Create a node pool with standard VMs for critical services and a second node pool with Spot VMs for batch jobs. Use taints and tolerations to schedule workloads appropriately. Use Standard VMs for stable workloads and Spot VMs for interruptible workloads to balance cost and reliability.
- Handling Preemption in Managed Instance Groups: Use Modify the application to checkpoint state frequently and optimize the shutdown script to finish within 30 seconds. Spot VMs only provide a 30-second shutdown window; you must optimize the application or use checkpointing to fit this constraint.
Key Takeaways (5.2b)
- Spot VMs offer significant cost savings for fault-tolerant workloads like batch processing.
- Never run critical, stateful, or non-interruptible workloads on Spot VMs.
- Use multiple Node Pools in GKE to mix different machine types (e.g., Standard and Spot).
- Use Taints and Tolerations to control exactly which pods are allowed to run on Spot nodes.
Consideration 5.2c: Optimizing resource usage for cost and efficiency
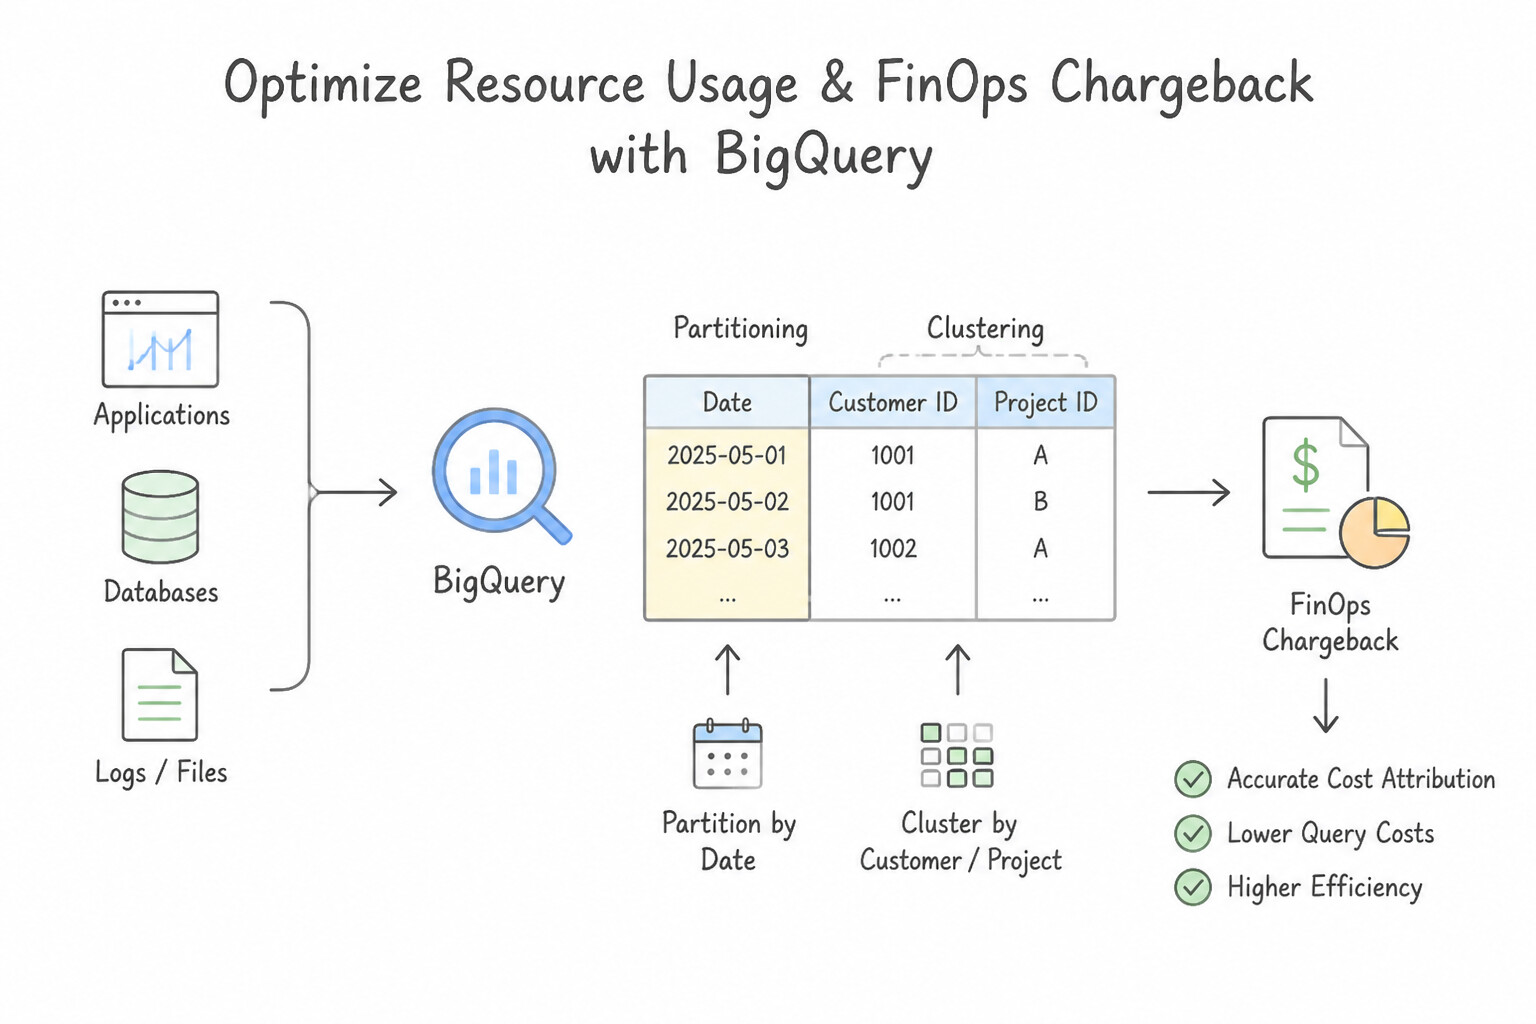
- Optimizing Resource Usage & FinOps Chargeback (5.2c):
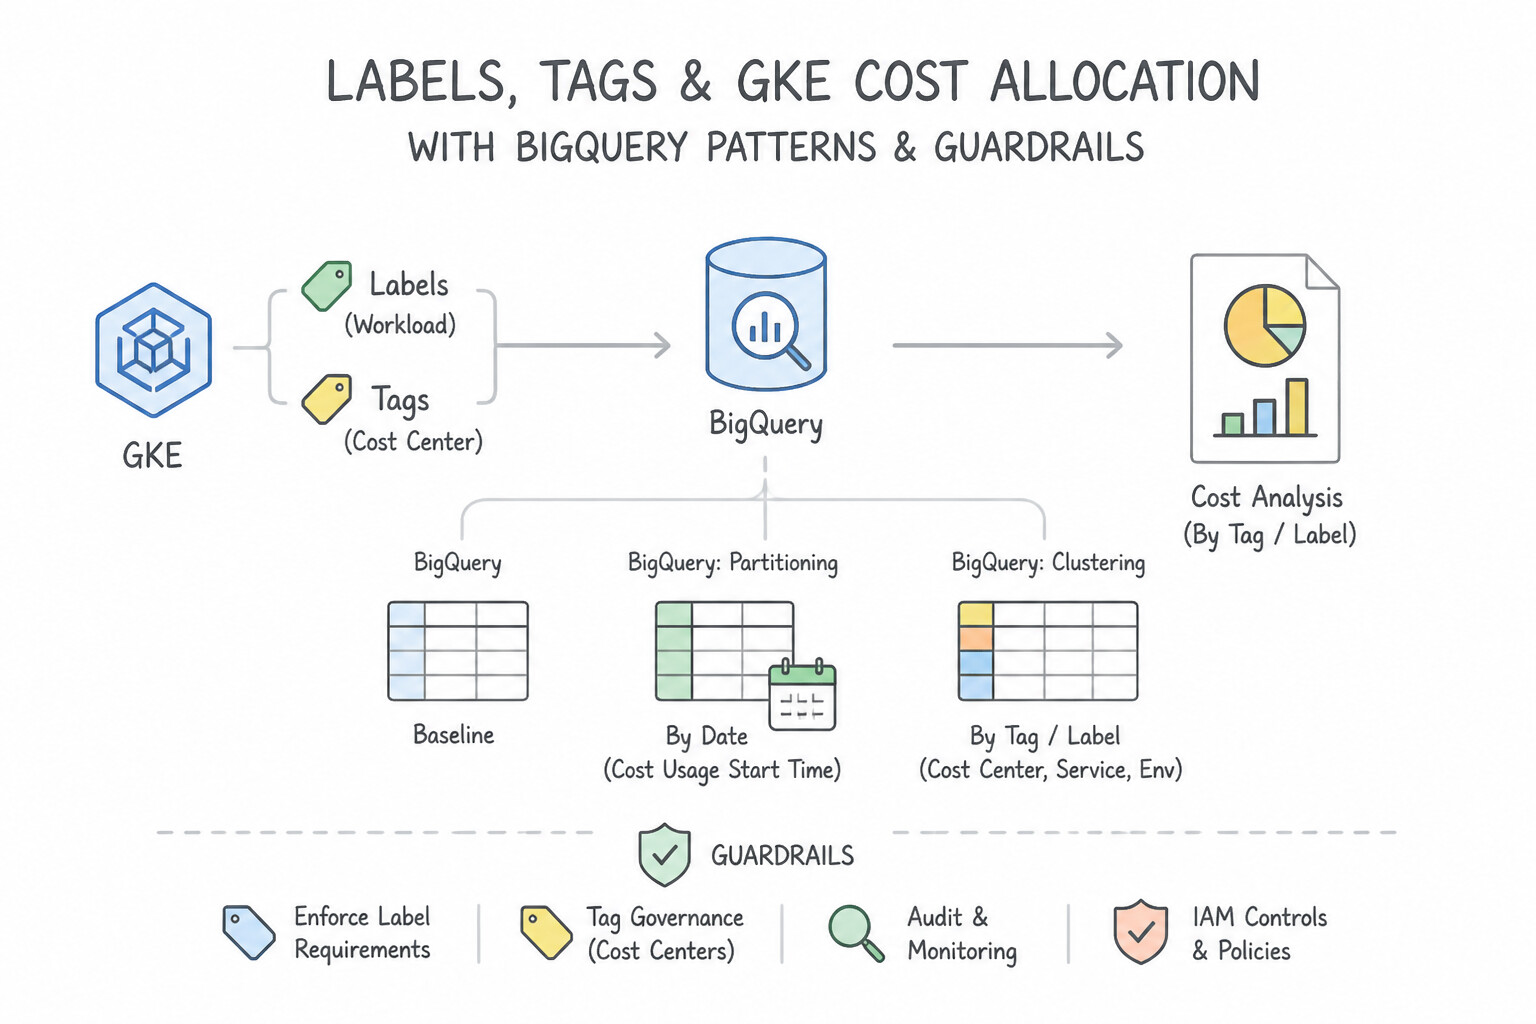
- Labels, Tags & GKE Cost Allocation: Apply mandatory
labels(env: prod,team: payments,app: checkout) to all GCP resources and enable GKE Cost Allocation on clusters so Cloud Billing Export to BigQuery breaks down shared GKE cluster node and persistent disk costs by individual KubernetesNamespaceand Podlabel! - Storage & Data Lifecycle Optimization: Enable Cloud Storage Autoclass (for unpredictable access patterns) or Object Lifecycle Management rules (
Standard→Nearlineafter 30d →Coldlineafter 90d →Archiveafter 365d), and configure BigQuery partition expiration andmaximum_bytes_billedquery guardrails.
Key Implementation Patterns
- BigQuery Query Cost Optimization via Partitioning: Use Create a new table partitioned by
transaction_dateand clustered bystore_id. Partitioning by date and clustering by ID minimizes data scanning for queries filtering on both fields. (Avoid alternative: Partitioning by ID has limits and is less effective for time-series queries than date partitioning.) - Dataflow Autoscaling and Shuffle Service: Use Update the pipeline execution parameters to enable Streaming Engine. Streaming Engine moves streaming shuffle and state handling to a managed backend, reducing worker VM resource needs. (Avoid alternative: Adding more disk space keeps the shuffle workload on the VMs and does not improve CPU efficiency.)
- Dataproc Cost Reduction with Preemptible Instances: Use Create the cluster with Standard virtual machines (VMs) for the master and primary workers. Add Spot VMs as secondary workers. Use Standard VMs for stable control and storage nodes (master/primary), and low-cost Spot VMs for pure compute nodes (secondary) to optimize costs safely.
Key Takeaways (5.2c)
- BigQuery costs are driven by the amount of data scanned.
- Use Partitioning on date/time columns to prune large chunks of historical data.
- Use Clustering on high-cardinality columns (like IDs) to organize data within partitions for faster lookup.
- Avoid
LIMITas a cost-saving mechanism for scans.
Consideration 5.2d: Infrastructure cost planning (e.g., committed-use discounts, sustained-use discounts, network tiers)
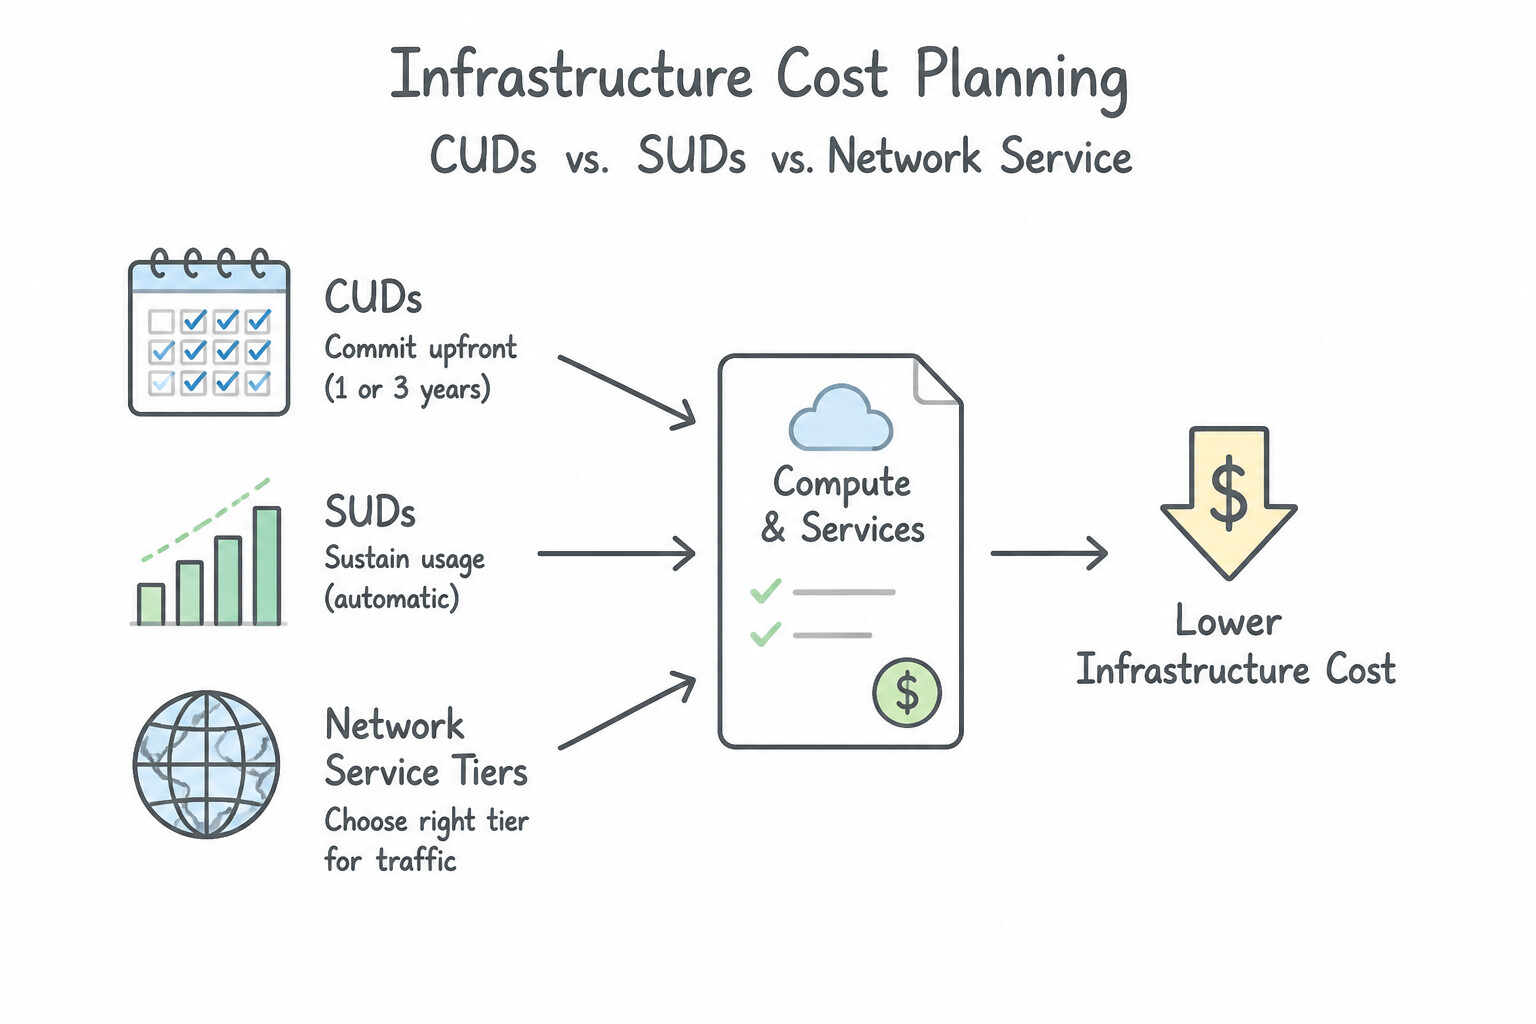
- Infrastructure Cost Planning:
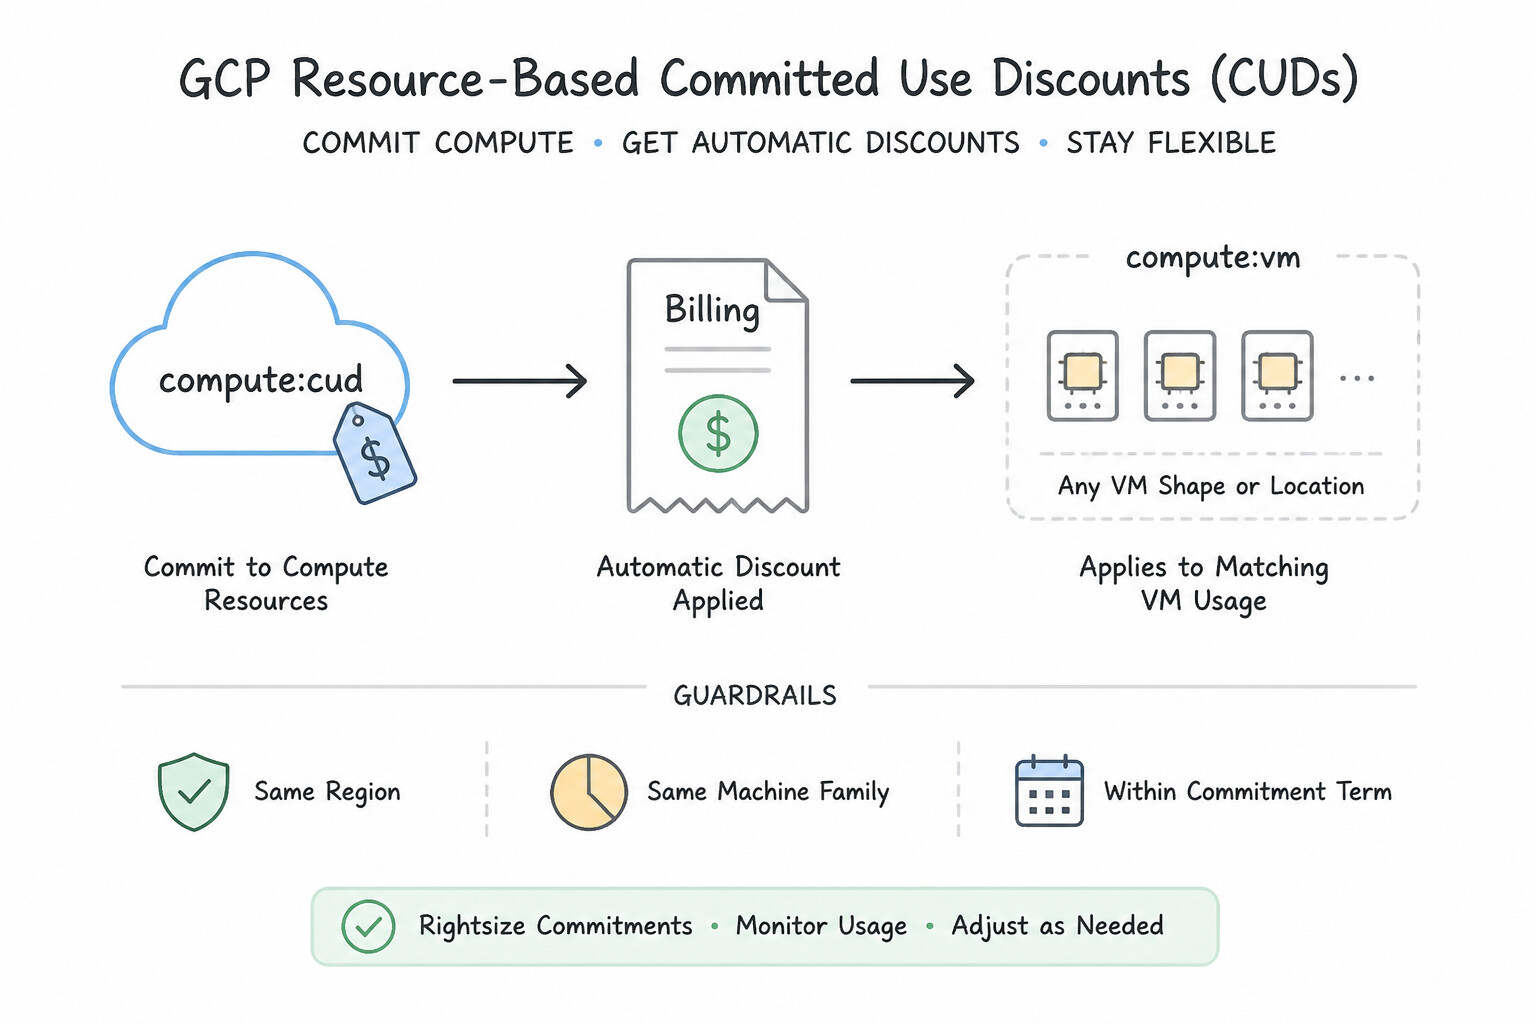
CUDsvs.SUDsvs.Network Service Tiers(5.2d): - Resource-Based Committed Use Discounts (
CUDs): Commit to a specific amount of vCPUs, memory, GPUs, Local SSDs, or sole-tenant nodes in a specific region and machine family for 1 year (~37% discount) or 3 years (~55%–70% discount). Enable CUD Sharing across the Billing Account so any project under the billing account can consume unused commitment capacity! - Compute Flexible (Spend-Based) CUDs: Commit to spending a minimum $/hour across Compute Engine, Google Kubernetes Engine (including GKE Autopilot), and Cloud Run across any region and any machine family for 1 year (28% discount) or 3 years (46% discount). Choose Flexible CUDs when your teams frequently migrate between regions, machine types, VMs, GKE, and Cloud Run!
- Sustained Use Discounts (
SUDs): Automatic, zero-commitment monthly discounts (up to 20%–30%) applied when eligible machine series (N1,N2,N2D,C2) run for more than 25% of a billing month. (architectures note:E2,Tau T2D,A2,M3do NOT receive SUDs because they already have lower flat baseline pricing). - Network Service Tiers (
Premiumvs.Standard): - Premium Tier (Default): Enters Google's private global fiber backbone at the edge PoP closest to the end user + supports Global External Load Balancing with a single global anycast IP. Choose for latency-sensitive global user traffic.
- Standard Tier: Routes traffic over the public ISP transit network and exits/enters near the GCP region + uses Regional Load Balancing at a significantly lower egress cost per GB. Choose for cost-sensitive regional workloads, batch file downloads, or non-latency-critical APIs.
Key Implementation Patterns
- Choosing Between Flexible and Resource-Based CUDs: Use Purchase flexible committed use discounts for a specific hourly spend. Flexible committed use discounts cover spend across multiple machine families, making them ideal for dynamic environments. (Avoid alternative: Resource-based discounts are tied to specific hardware families and do not apply if you switch machine types.)
- Leveraging Spot VMs for Fault-Tolerant Pipelines: Use Configure the instance group to use Spot VMs. Spot VMs provide the deepest discounts (up to 91%) and are ideal for fault-tolerant, flexible workloads like rendering. (Avoid alternative: Sustained use discounts offer significantly lower savings (approx. 30%) compared to Spot VMs.)
- Optimizing Network Tiers for Batch Workloads: Use Configure the external IP address of the source virtual machine (VM) to use the Standard Tier. Standard Tier uses the public internet for transit, offering lower costs suitable for non-latency-sensitive workloads. (Avoid alternative: Premium Tier is the higher-cost, high-performance option, which contradicts the goal of reducing egress costs.)
Key Takeaways (5.2d)
- Use Resource-based CUDs when workloads are stable and predictable on specific machine families.
- Use Flexible CUDs when workloads are dynamic or require frequent changes to machine types or regions.
- Committed use discounts act as a contract: you pay the committed amount regardless of whether you use the resources.
- Spot VMs offer the lowest possible compute cost (up to 91% off) but can be interrupted at any time.
Consideration 5.2e: Leveraging Google Cloud recommenders (e.g., cost, security, performance, manageability, reliability)
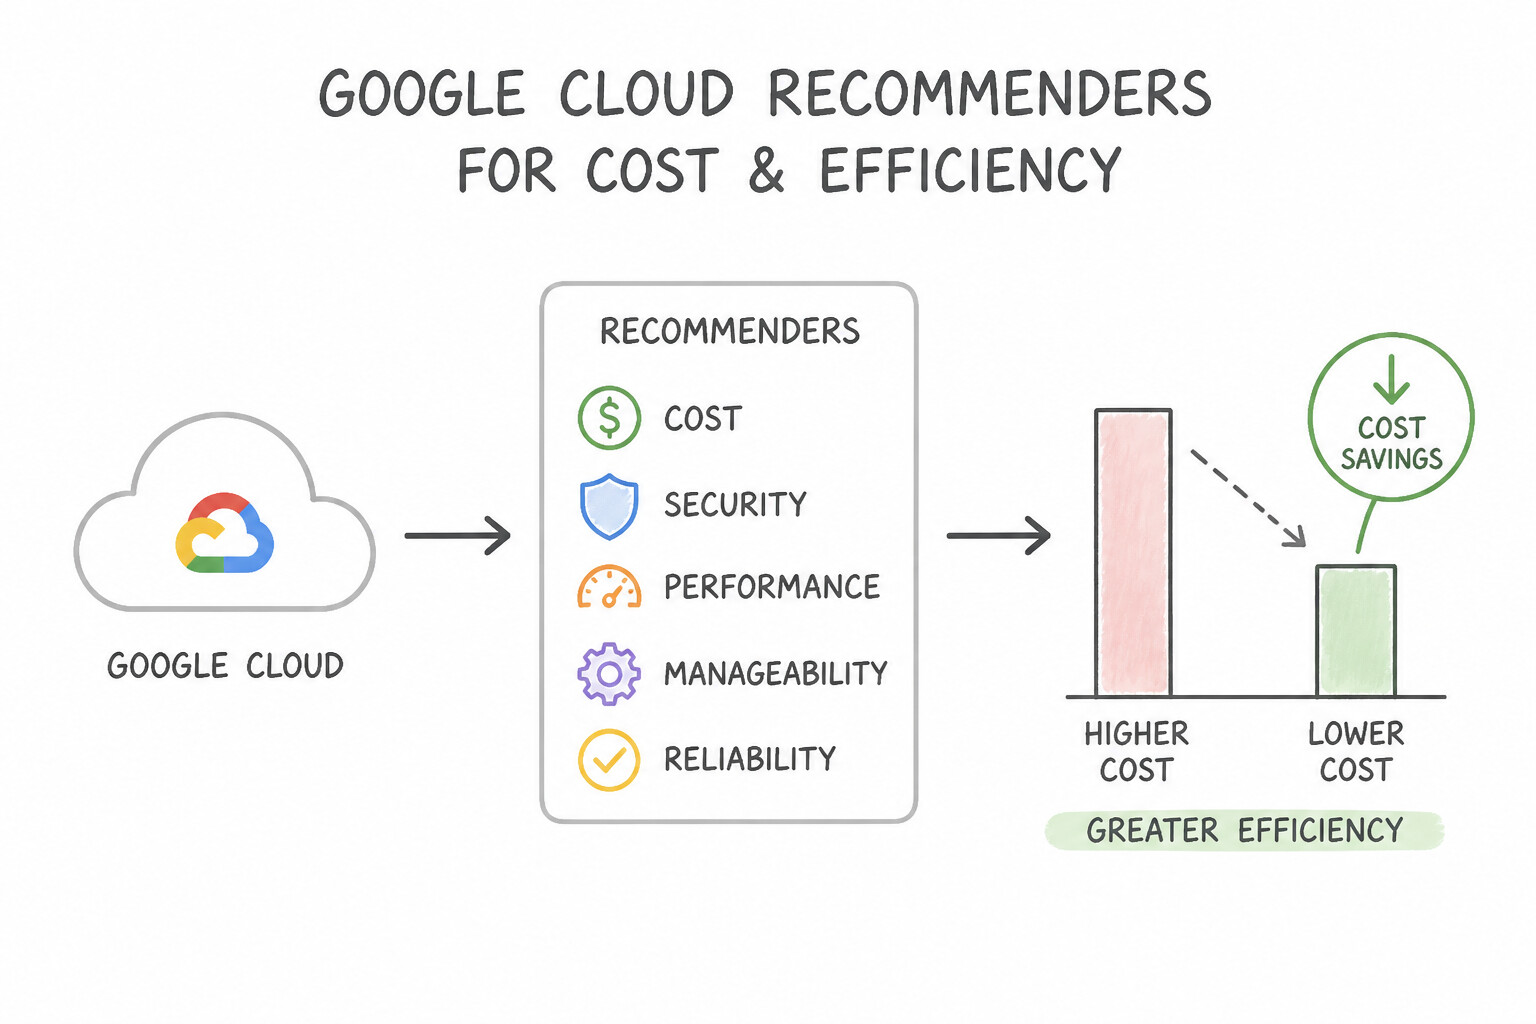
- Leveraging Google Cloud Recommenders for Cost & Efficiency (5.2e):
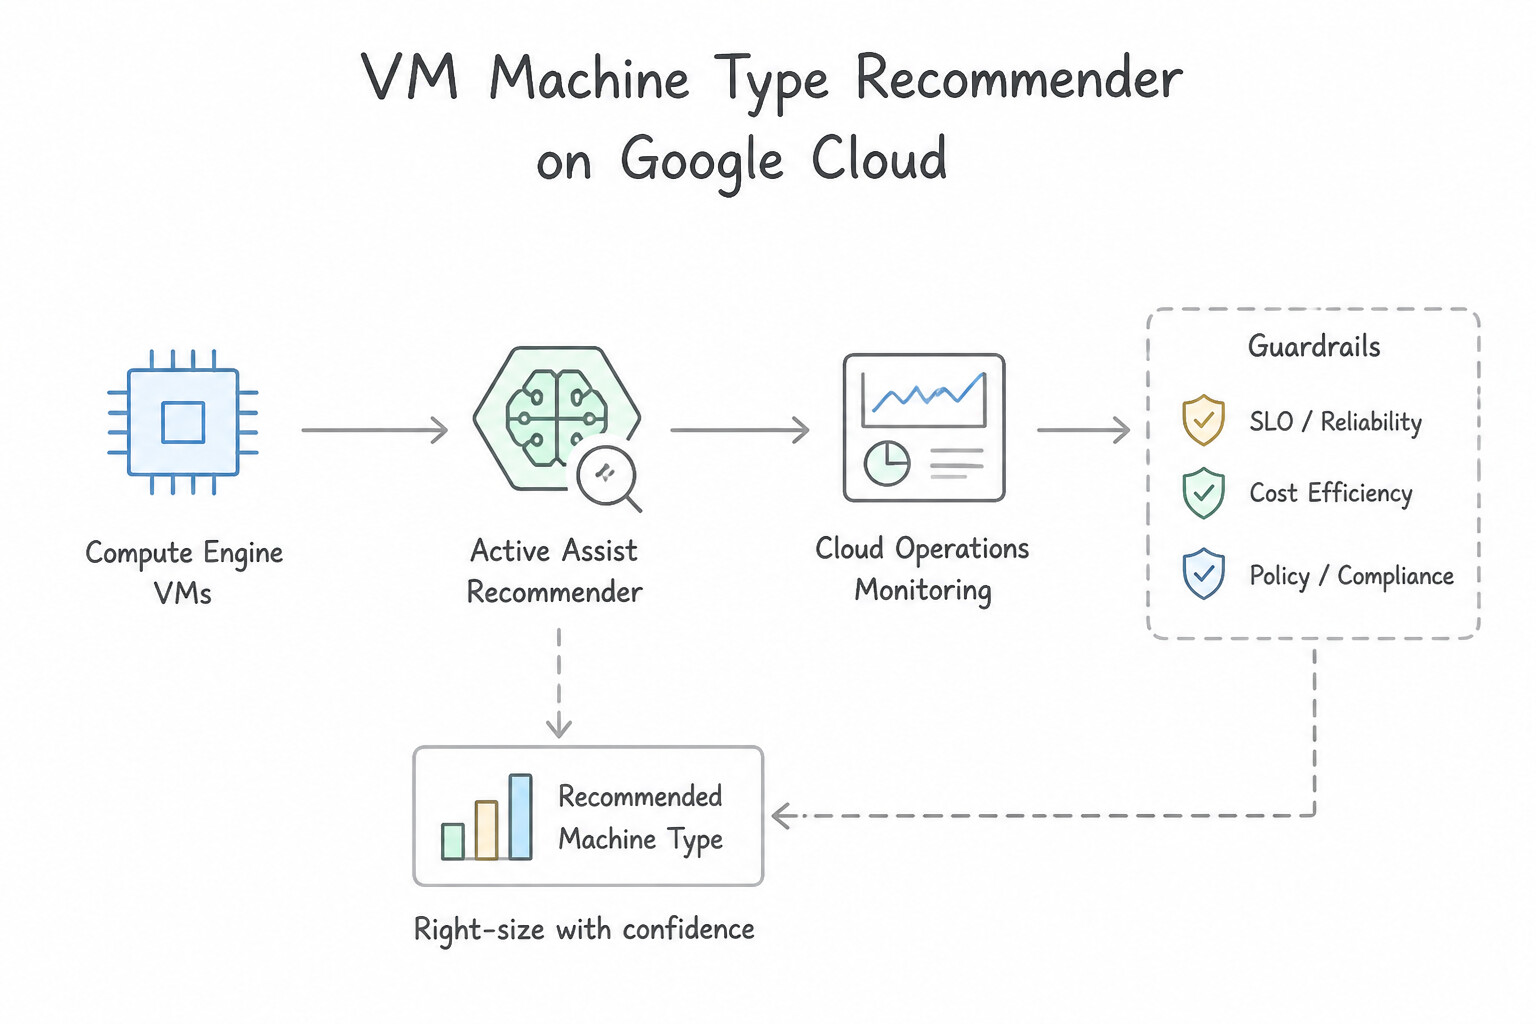
- VM Machine Type Recommender: Analyzes 8+ days of CPU and memory metrics in Cloud Monitoring and suggests downsizing over-provisioned VMs (e.g.,
n2-standard-16→n2-custom-4-16384). - Idle Resource Recommender (
Idle VM,Unattached Persistent Disk,Unassigned Static External IP,Idle Cloud SQL): Identifies forgotten resources incurring 24/7 charges; snapshot and delete unattached disks, and release unused static IPs! - Committed Use Discount (
CUD) Recommender: Analyzes historical baseline usage across your Billing Account and calculates the optimal 1-year or 3-year commitment purchase to maximize Commitment Coverage Ratio and Commitment Utilization.
Key Implementation Patterns
- Automated Remediation of Idle Resources: Use Create a scheduled automation script that queries the Idle VM Recommender API. Configure the script to stop the instances listed in the recommendations. Use the Idle VM Recommender API to identify unused instances and automate their shutdown via a script.
- Centralized Recommendation Analysis via BigQuery: Use Configure the export of Cloud Recommender data to BigQuery at the organization level. Connect Looker Studio to the BigQuery dataset. Recommender has a built-in feature to export data to BigQuery, enabling easy analysis in Looker Studio.
- Rightsizing for Static Workloads: Use Use the Rightsizing Recommender to identify underutilized virtual machine (VM) instances. Apply the recommendations to switch to smaller machine types. The Rightsizing Recommender automatically detects over-provisioned VMs based on historical metrics and suggests smaller, cheaper machine types.
Key Takeaways (5.2e)
- Idle resources should be stopped, not resized.
- Rightsizing is for active resources that are over-provisioned.
- Active Assist Recommenders provide machine-learning-based insights for cost and performance.
- Use the Recommender API to build automated remediation workflows (FinOps).
Consideration 5.2f: Optimizing individual workload costs (e.g., GKE, Cloud Run, Compute Engine)
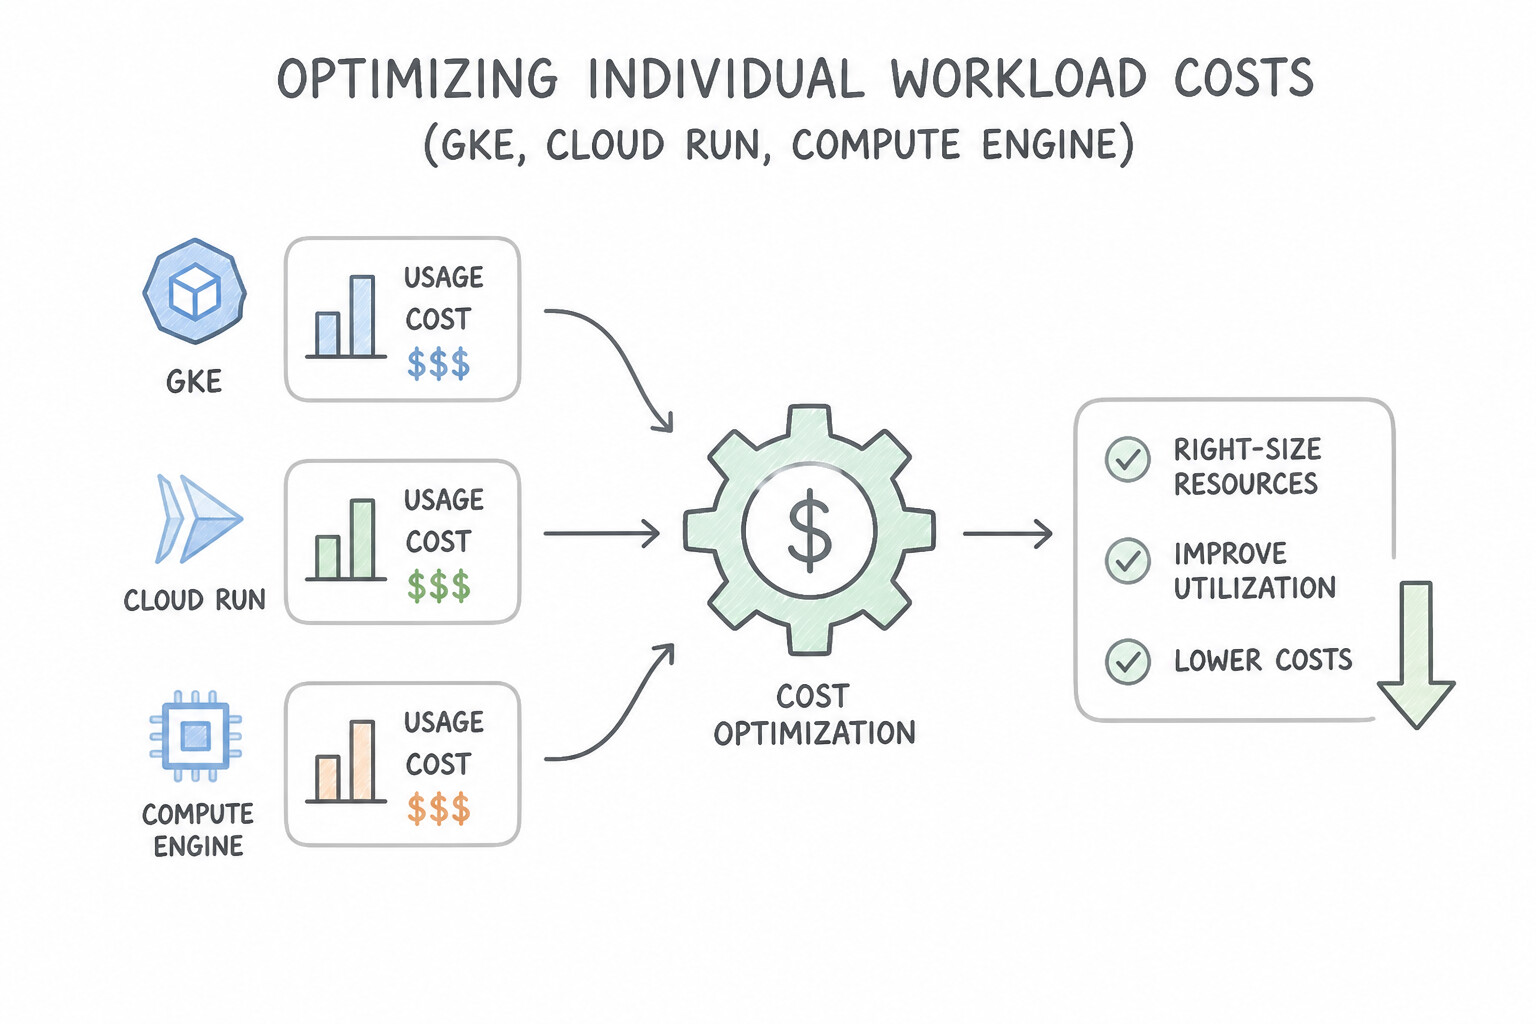
- Optimizing Individual Workload Costs (
GKE,Cloud Run,Compute Engine—5.2f): - GKE Cost Optimization:
- Eliminate "Slack" (Requested vs. Used): Use the GKE Optimization tab + Vertical Pod Autoscaler (
VPAinOffmode) to right-size pod CPU/memoryrequestsso Cluster Autoscaler can pack more pods onto fewer nodes. - GKE Autopilot vs. GKE Standard: Migrate variable or small/medium stateless fleets to GKE Autopilot (where you pay only for Pod resource requests, with zero charge for unused node capacity or system DaemonSets!). On GKE Standard, enable Cluster Autoscaler with the
optimize-utilizationprofile (scales down underutilized nodes faster and bin-packs aggressively), scale downdevnode pools off-hours via scheduled autoscaling, and run fault-tolerant workloads on Spot Pod / Spot Node Pools. - Cloud Run Cost Optimization:
- Scale to Zero (
min-instances = 0): Setmin-instances=0indev/stagingand on intermittent production services so idle services cost $0.00. - CPU Allocation (
CPU only allocated during request processing): Default request-based billing only charges for CPU while an HTTP request is actively being handled (useCPU always allocatedonly if the container runs background threads after returning an HTTP response). - Tune Concurrency (
--concurrency): Increase concurrency (up to 80–1,000 requests per instance) for I/O-bound stateless APIs so 1 container instance handles 100 concurrent requests instead of spinning up 100 separate containers! - Compute Engine Cost Optimization: Choose
E2machine series for general-purpose cost optimization,Tau T2D/T2A(Arm) for scale-out web/microservices price-performance, Custom Machine Types when CPU-to-RAM ratios don't fit standard shapes, and Schedule VM Start/Stop (Instance Schedules) to shut downdev/testVMs on nights and weekends (saving ~70% automatically!).
Key Implementation Patterns
- GKE Batch Processing with Spot VMs: Use Create a new node pool that uses Spot VMs. Configure the batch jobs to run on this node pool. Spot VMs offer significant discounts for fault-tolerant, stateless workloads like batch processing. (Avoid alternative: VPA optimizes resource sizing but does not lower the unit cost of the underlying virtual machines.)
- Automated Rightsizing for Legacy GCE: Use Review and apply the rightsizing recommendations in the Google Cloud console to switch the instances to a smaller machine type. Rightsizing recommendations automatically identify underutilized VMs and suggest a smaller, more cost-effective machine type based on historical usage data.
- Cloud Run Concurrency Optimization: Use Increase the maximum concurrent requests per instance setting. Increasing concurrency allows each instance to handle more simultaneous requests, reducing the total instance count and cost. (Avoid alternative: Increasing resources per instance increases cost and does not solve the issue of low utilization due to request limits.)
Key Takeaways (5.2f)
- Spot VMs offer significant cost savings (60-91%) for workloads that can tolerate interruptions.
- Stateless batch processing is the primary use case for Spot VMs.
- In GKE, Spot VMs should be provisioned in separate node pools to isolate interruptible workloads from critical system components.
- Always assess if an application is fault-tolerant before choosing Spot VMs.
Quick Decision Cheat Sheet (Subsection 5.2)
If the Scenario Requires... | Choose This Google Cloud Pattern | Avoid This Common Mistake |
|---|---|---|
"Run stateless, fault-tolerant batch or CI/CD workloads on Compute Engine / GKE at up to 91% discount without a 24-hour runtime cutoff" | Spot VMs (or GKE Spot Pods / Node Pools) with a 30-second SIGTERM / shutdown handler | Legacy Preemptible VMs or 3-year Committed Use Discounts for short-lived burst jobs |
"Track and charge back shared multi-tenant GKE cluster costs to individual product teams and namespaces in BigQuery" | Enable GKE Cost Allocation and query the Cloud Billing Detailed Usage Export in BigQuery by namespace and labels | Deploying 30 separate GKE clusters just to separate billing per microservice |
"Cut GKE Managed Service for Prometheus ( GMP) metric billing costs by 75% without losing core visibility" | Increase PodMonitoring scrape interval (e.g., 15s → 60s) and use metricRelabeling (action: drop) on unused high-cardinality metrics | Disabling Cloud Monitoring across the entire project |
"Automatically shut down non-production Compute Engine VMs every evening at 7:00 PM and restart them at 8:00 AM Monday–Friday" | Configure Compute Engine Instance Schedules (attached to the VMs with compute.instances.start/stop permissions on the Compute Engine system SA) | Deleting and recreating the VMs manually every evening |
"Optimize Cloud Run cost for an I/O-bound REST API that spends 90% of request time waiting on downstream HTTP calls" | Increase --concurrency (e.g., 80–250), set min-instances=0 (if cold-start tolerant), and keep CPU allocated only during request processing | Setting --concurrency=1 (forces Cloud Run to bill for 100 separate container instances for 100 concurrent requests!) |
Further Reading (Subsection 5.2)
- Log exclusions — Documentation explaining how to configure exclusion filters to reduce costs by dropping log entries.
- Cloud Logging pricing — Overview of pricing models, highlighting the difference between ingestion and storage costs.
- Manage Trace sampling — Documentation on how to configure sampling rates to manage data volume and costs.
- Route logs to supported destinations — Explains how the Log Router works and how to create sinks to export logs to Cloud Storage, BigQuery, and Pub/Sub.
- Storage classes — Details the different storage classes (Standard, Nearline, Coldline, Archive) and their specific use cases regarding access frequency and cost.
- Spot VMs in GKE — Provides an overview of how Spot VMs function within GKE, specifically highlighting that they are best used for stateless, batch, or fault-tolerant workloads.
Book TOC · Previous · Chapter 5 of 6 · Next
AwesomeGCP.com Learning
The approach taken is a question-led learning approach: you explore realistic project scenarios where you need to make decisions or take actions to achieve business goals within specific constraints. Instead of passive learning, you are challenged to think and work through the options to master the Professional Cloud DevOps Engineer (PDOE) certification!