Book TOC · Previous · Chapter 4 of 6 · Next
Chapter 4: Preparing & Using Data for Analysis: BI Engine, Looker, BigQuery ML, Vertex AI & Analytics Hub
Chapter Focus: Materialized views, BI Engine caching, Looker semantic modeling, BigQuery ML vs. Vertex AI Feature Store preparation, RAG vector search in BigQuery/AlloyDB, and zero-copy sharing via Analytics Hub.
Subsection 4.1: Preparing data for visualization
The Big Picture
When 2,000 sales managers open a Looker or Looker Studio dashboard every Monday at 9:00 AM, a poorly architected visualization layer turns into an expensive bottleneck:
- Re-Scanning 10 TB Base Tables on Every Dashboard Filter Click (
4.1b,4.1c): Connecting a high-concurrency BI dashboard directly to a 10 TB raw transactional table—without precomputed aggregations or in-memory caching—triggers thousands of redundant multi-terabyte scans. Combining BigQuery Materialized Views (with Smart Tuning, which automatically rewrites queries against the base table to read from the pre-aggregated view!) with BigQuery BI Engine (sub-second in-memory vectorized caching) drops query latency from 30 seconds to<500mswhile slashing slot usage by 95%. - Query Execution Antipatterns in the BigQuery Execution Plan (4.1d): Even when tables are partitioned, queries crawl when analysts write SQL antipatterns: self-joining a billion-row table instead of using Window Functions (
LAG,LEAD,ROW_NUMBER), joining on non-unique or skewed keys (CROSS JOINrow explosion where output rows \gg input rows), sorting the entire dataset with a top-levelORDER BYwithout aLIMIT, or scanningSELECT *. - Owner's Credentials vs. Viewer's Credentials in BI Dashboards (
4.1a,4.1e): Sharing a Looker Studio report configured with Owner's Credentials over a sensitive table exposes the report creator's full data view to every recipient unless switched to Viewer's Credentials (paired with BigQuery Row-Level Security, Dynamic Data Masking, and Sensitive Data Protection).
Consideration 4.1a: Connecting to tools
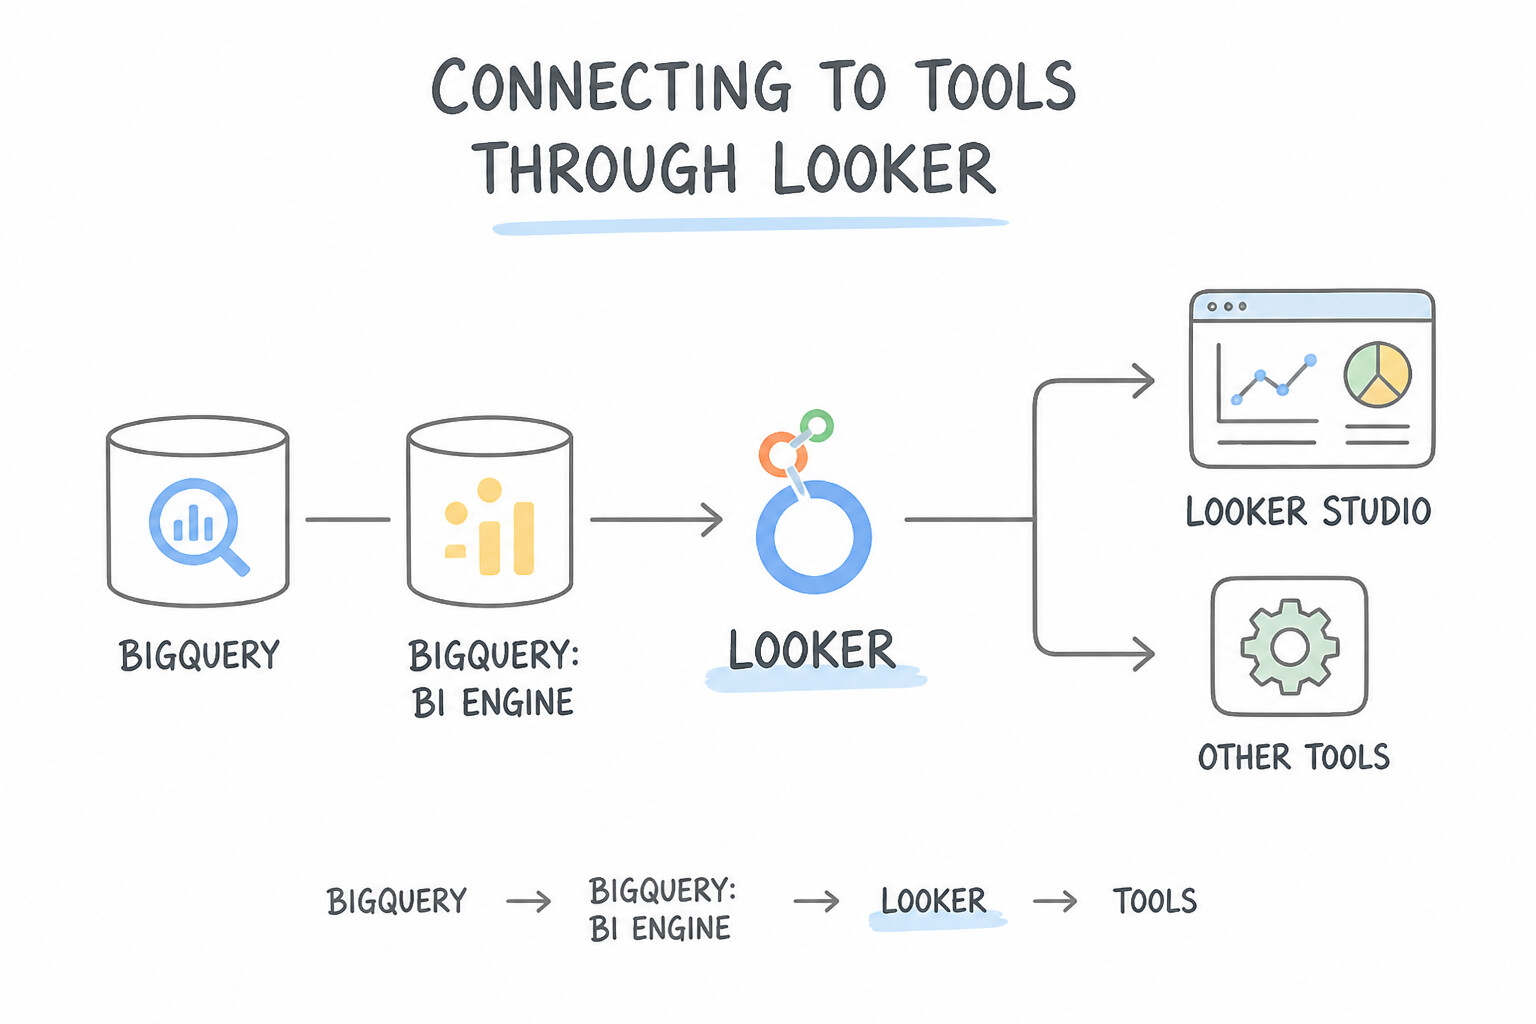
Know the exact architectural role of each Google Cloud visualization and exploration client:
- Looker (Enterprise BI Platform):
- Uses LookML, a Git-versioned declarative modeling language that defines a single source of truth for business metrics, table relationships, and access grants (
access_filter,required_access_grants). - Supports Persistent Derived Tables (
PDTs)—materializing complex multi-join LookML views back into a scratch BigQuery dataset on a schedule or trigger. - Looker Studio (Self-Service Dashboards):
- Lightweight browser-based dashboarding natively accelerated by BigQuery BI Engine.
- Data Freshness vs. Cost: Looker Studio caches query results by default (e.g., 12 hours). If a scenario says "Looker Studio dashboard does not reflect streaming data written 15 minutes ago" → lower the Data Freshness interval in the Looker Studio data source settings (down to 15 minutes or 1 minute); conversely, if a dashboard is generating excessive BigQuery on-demand scan costs for static daily data → increase the Data Freshness cache interval and enable
use_query_cache! - Connected Sheets (Spreadsheet Interface at Petabyte Scale):
- Whenever a scenario states "financial analysts want to analyze 100 million rows in a familiar spreadsheet interface using pivot tables and formulas without exporting CSVs or hitting row limits" → choose Connected Sheets! It executes calculations directly inside BigQuery while rendering the results in Google Sheets.
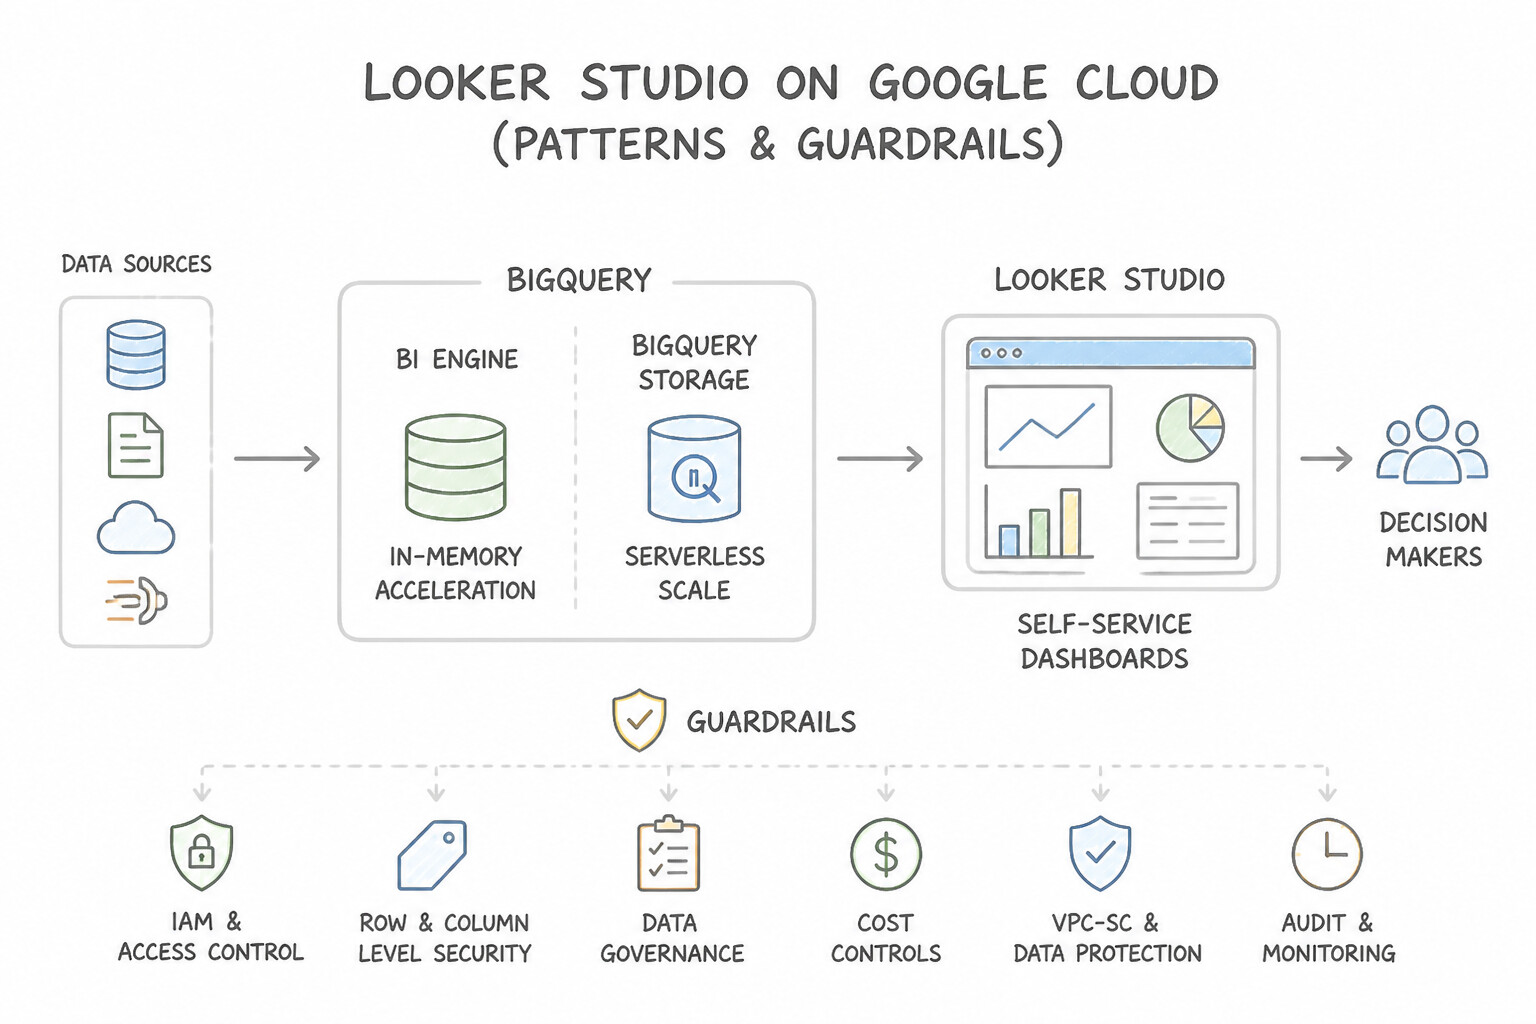
Key Implementation Patterns
- Optimizing Looker Studio Performance with BI Engine: Use Configure a BigQuery BI Engine reservation for the project where the dataset resides. BigQuery BI Engine provides in-memory caching that accelerates Looker Studio dashboards to sub-second latency. (Avoid alternative: Dataflow requires manual pipeline creation and maintenance, which violates the requirement to avoid manual pre-aggregation.)
- Analyzing Big Data via Spreadsheet Interface: Use Use Connected Sheets to connect the Google Sheet directly to the BigQuery dataset. Connected Sheets enables analysis of large BigQuery datasets within the familiar Sheets interface without writing SQL or moving data. (Avoid alternative: A 5TB dataset exceeds the maximum capacity and import limits of a standard Google Sheet.)
- Handling Data Access Credentials in Looker Studio: Use Configure the data source to use Owner's Credentials. Owner's Credentials use your permissions to fetch data, allowing the VP to view the dashboard without direct database access. (Avoid alternative: Viewer's Credentials require the viewer to have direct database access, which the VP lacks.)
Key Takeaways (4.1a)
- BigQuery BI Engine creates an in-memory caching layer to accelerate dashboard queries.
- Use BI Engine when you need sub-second latency for high-concurrency BI workloads.
- BI Engine works transparently with Looker Studio without changing SQL or datasets.
- Standard spreadsheets cannot load terabytes of data due to memory and row limits.
Consideration 4.1b: Precalculating fields
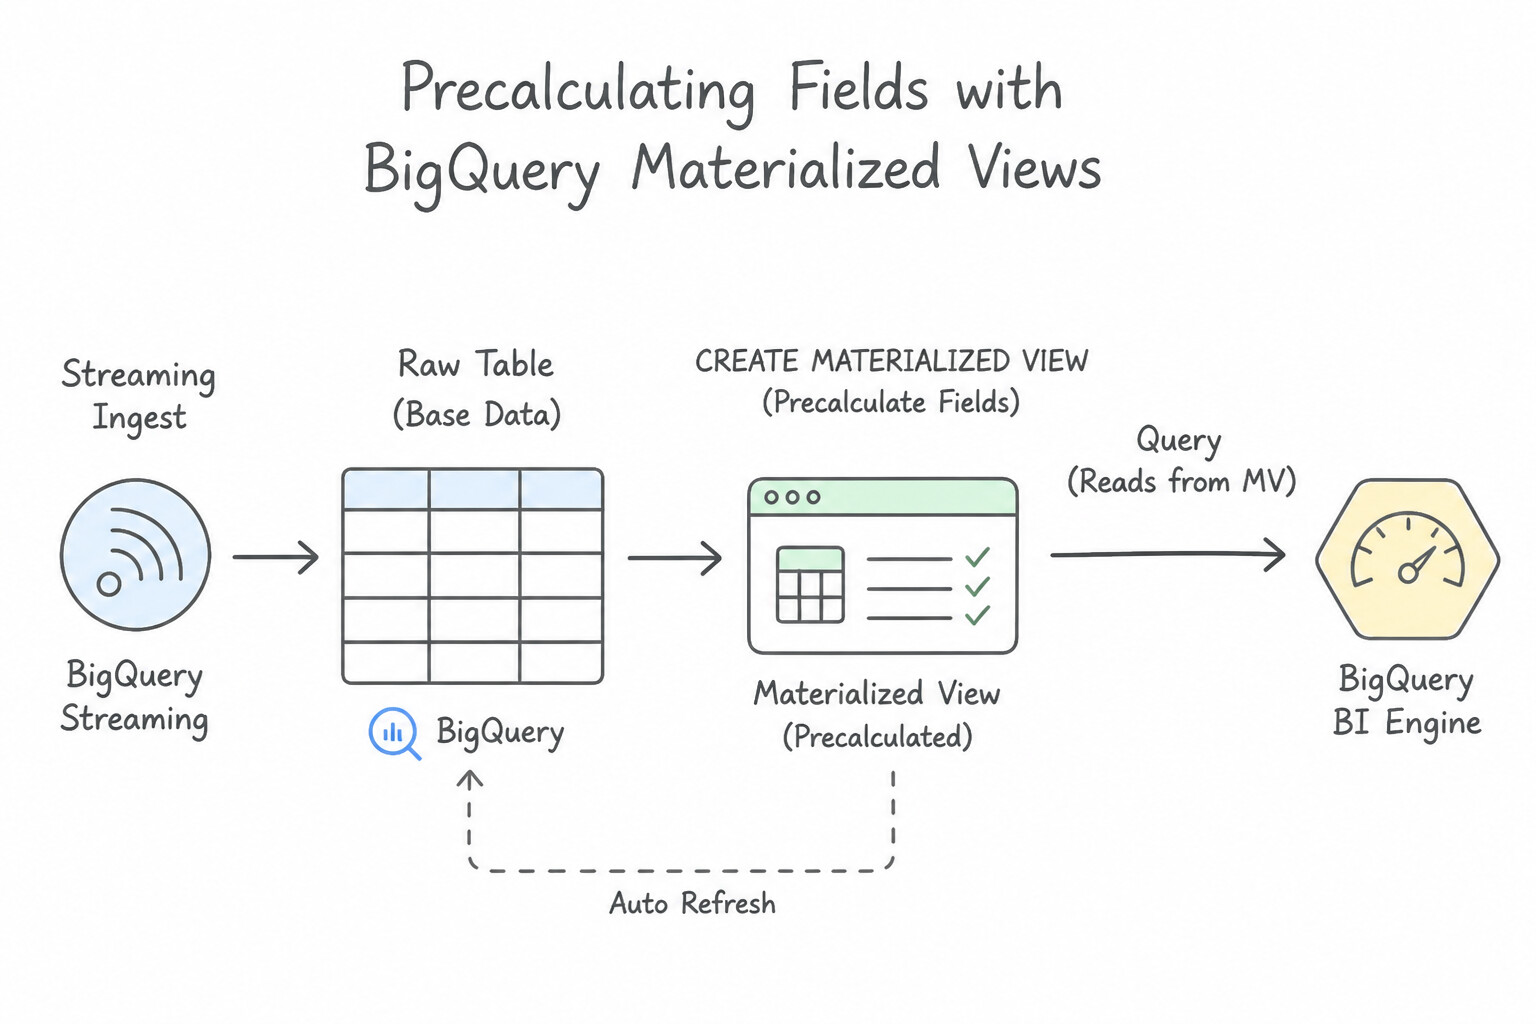
When should you use a Logical View, a Materialized View, or a Scheduled Table (Dataform)?
- Standard Logical View (
CREATE VIEW): Zero storage cost; re-executes the underlying SQL query every time the view is queried. Use for security filtering (Authorized Views) or schema abstraction when underlying queries are already fast. - BigQuery Materialized View (
CREATE MATERIALIZED VIEW): - Caches precomputed aggregate results (
SUM,COUNT,AVG,MIN,MAX,APPROX_COUNT_DISTINCT,HLL_COUNT.INIT) and automatically refreshes incrementally within 5 minutes of base table changes (and combines cached partitions with live delta reads from the base table's streaming buffer so results are always 100% fresh and consistent!). - Scheduled Queries / Dataform Incremental Tables:
- Use when the precalculation involves arbitrary complex SQL not supported by Materialized Views (e.g., multi-stage window functions, external UDFs, or non-deterministic functions), updating the summary table on an explicit schedule.
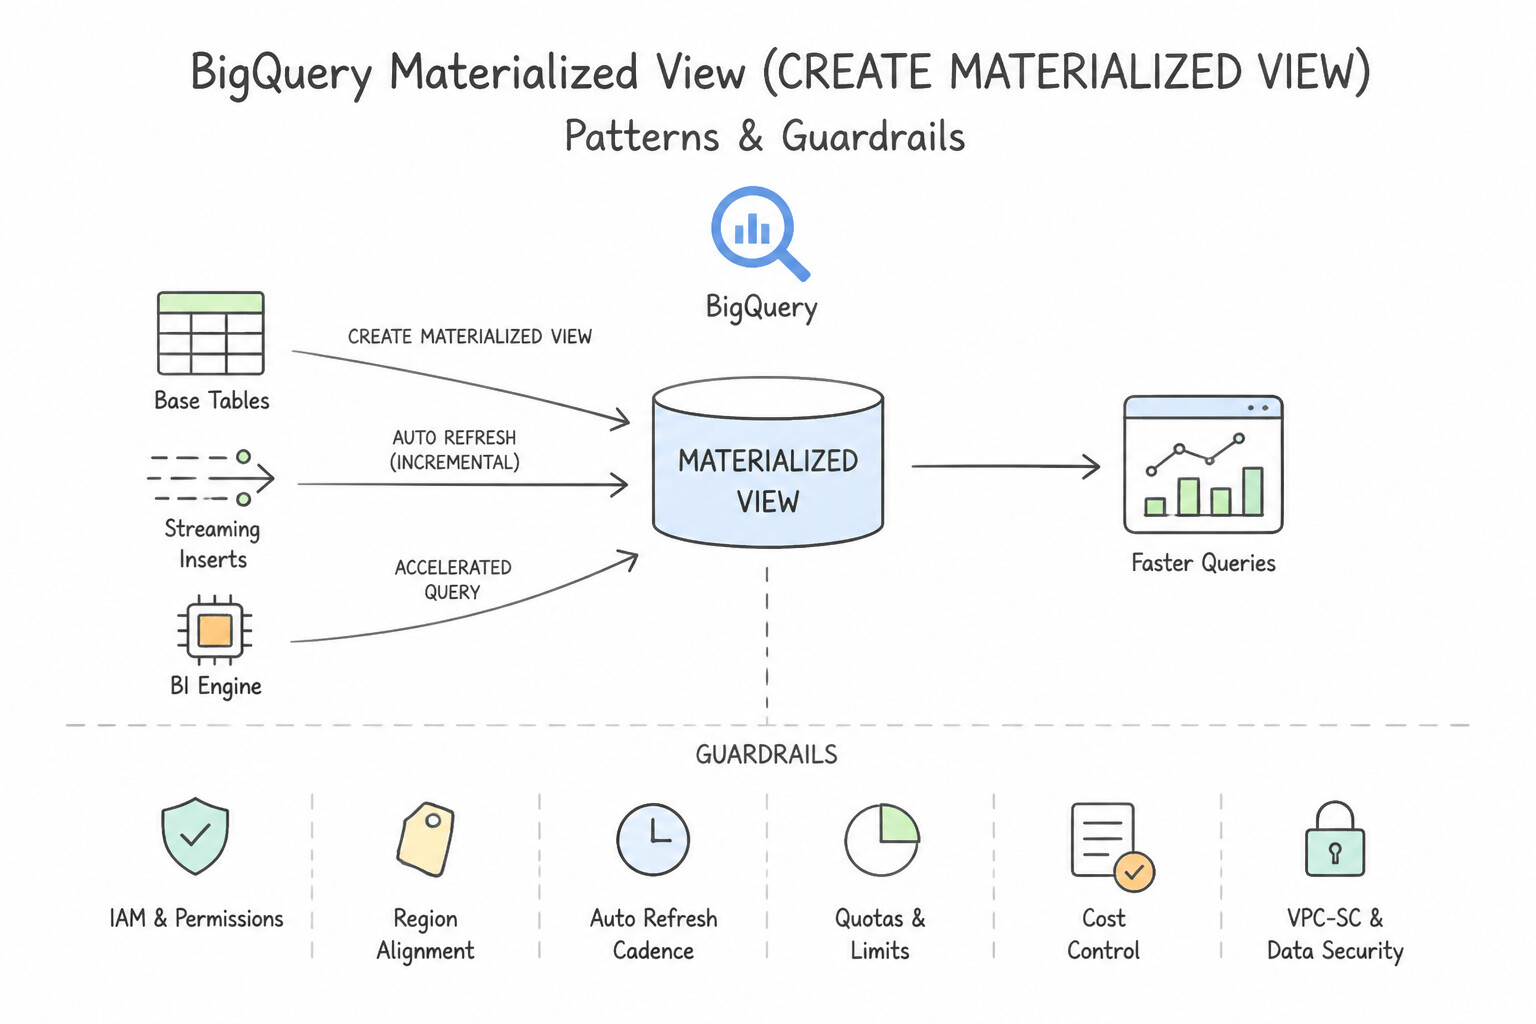
Key Implementation Patterns
- BigQuery Materialized Views for Real-Time Aggregation: Use Create a materialized view that sums the sales by region. Materialized views precalculate aggregates and automatically sync with streaming data to provide real-time results with lower cost and latency. (Avoid alternative: Adding more compute resources does not reduce the amount of data scanned or optimize the data structure itself.)
- BigQuery BI Engine for Sub-Second Latency: Use Configure BigQuery BI Engine with sufficient memory to cache the active dataset. BigQuery BI Engine provides in-memory caching for BigQuery, enabling sub-second query speeds for tools like Looker Studio. (Avoid alternative: Materialized views precalculate aggregates but do not offer the flexible in-memory acceleration needed for sub-second dashboard interactivity.)
Key Takeaways (4.1b)
- Materialized Views in BigQuery are best for accelerating aggregation queries on large datasets.
- They provide real-time freshness by automatically combining cached data with streaming deltas.
- Logical views do not improve performance or reduce cost; they only simplify query syntax.
- Scheduled queries introduce data latency and are not suitable for real-time requirements.
Consideration 4.1c: BigQuery features for business intelligence (e.g., BI Engine, materialized views)
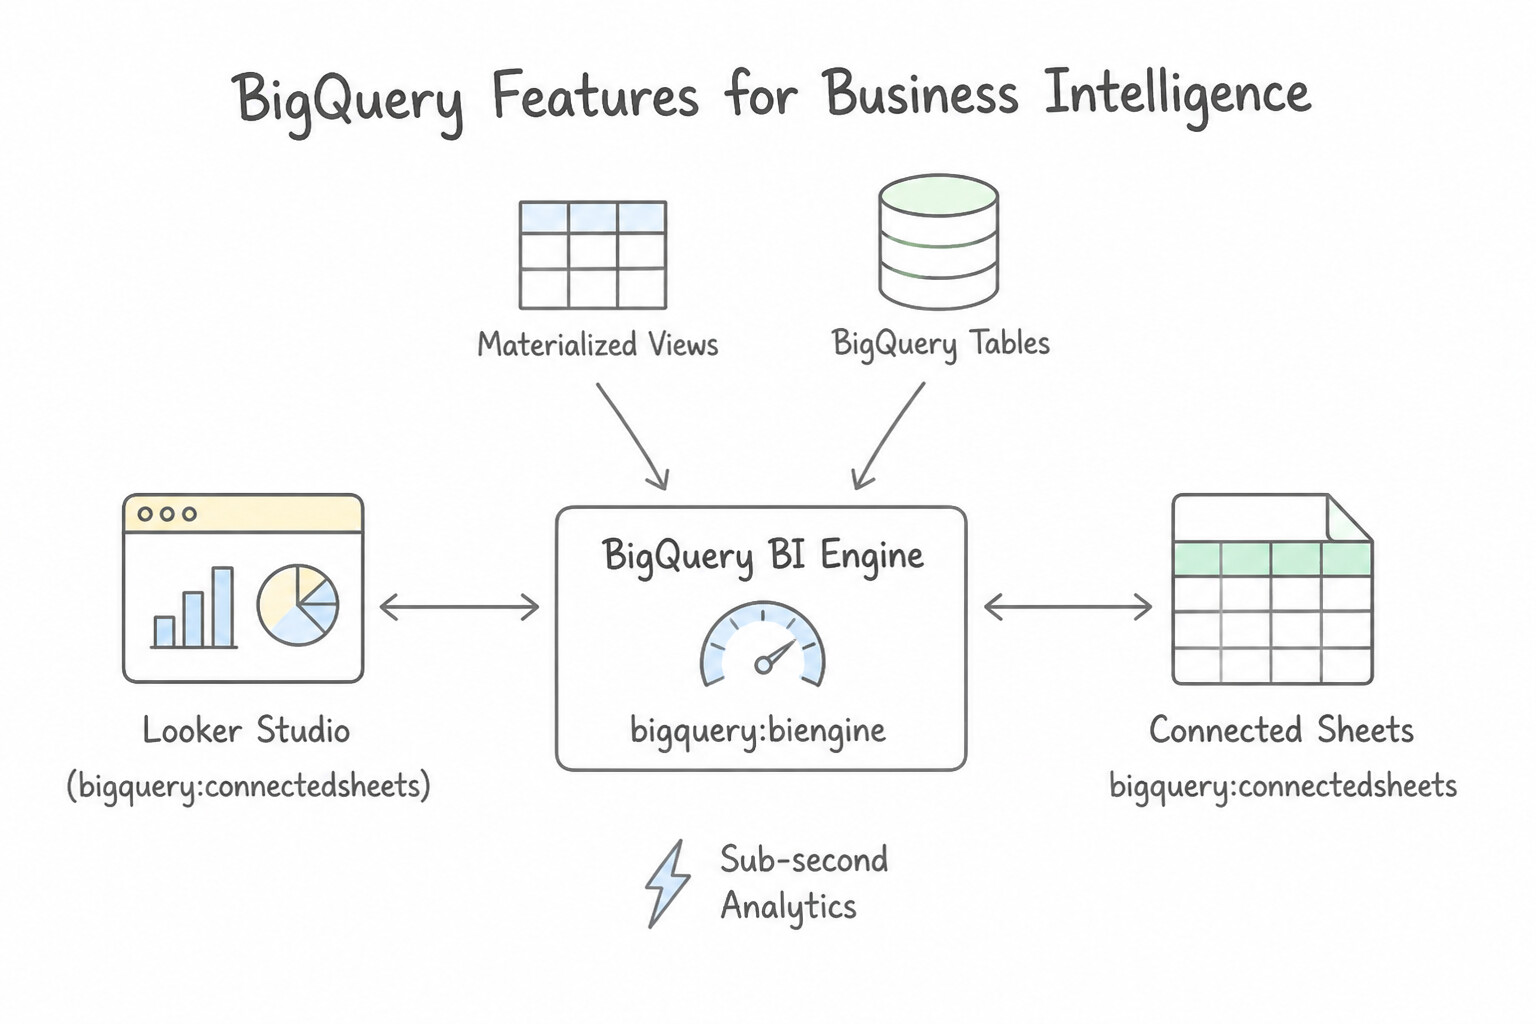
Combine BigQuery BI Engine and Materialized Views for sub-second dashboard performance:
- BigQuery BI Engine:
- Fast, in-memory analysis service with a vectorized query execution engine built directly into BigQuery.
- Reserve memory capacity (
GBof BI Engine RAM in your region) and BigQuery automatically caches hot columns/partitions in memory for Looker, Looker Studio, Connected Sheets, and standard SQL API clients—requiring zero SQL rewrites or data movement. - Materialized View
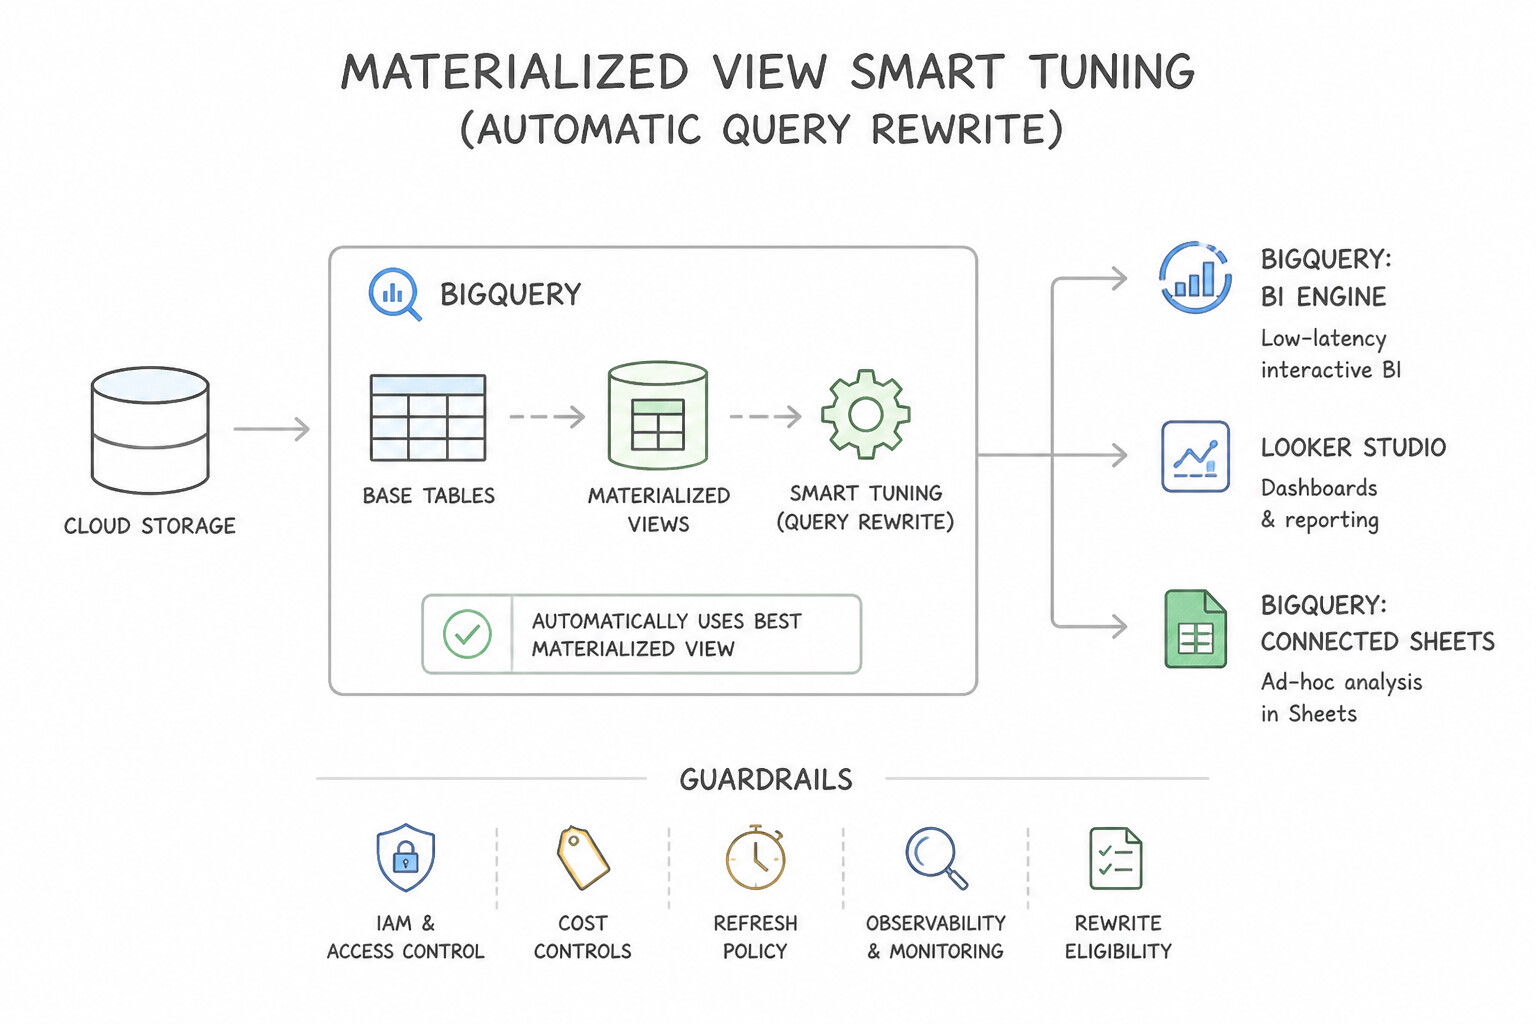
Smart Tuning(Automatic Query Rewrite): - Even if legacy BI dashboards and analysts continue running
SELECT region, SUM(sales) FROM prod.raw_orders GROUP BY regiondirectly against the base table (raw_orders), BigQuery's Smart Tuning optimizer automatically intercepts the query and rewrites it under the hood to read frommv_regional_sales—delivering 10x–100x faster execution and lower bytes scanned without changing a single dashboard query!
Key Implementation Patterns
- Accelerating High-Concurrency Dashboards: Use Configure BigQuery BI Engine by reserving memory capacity for the project. BigQuery BI Engine is an in-memory analysis service that provides sub-second latency for Looker Studio dashboards. (Avoid alternative: Materialized views precompute queries but store them on disk, which is generally slower than the in-memory caching provided by BI Engine.)
- Analyzing Big Data in Spreadsheets: Use Use Connected Sheets to establish a live connection between Google Sheets and the BigQuery dataset. Connected Sheets enables analysis of BigQuery data within Sheets without moving the data. (Avoid alternative: Google Sheets cannot store billions of rows natively due to cell limits.)
- Cost Optimization for Aggregated Queries: Use Create a BigQuery materialized view that defines the aggregation query. Materialized views pre-compute and store aggregation results, reducing data scanning costs and improving performance while updating automatically. (Avoid alternative: Logical views do not store data or pre-compute results; they re-run the full query every time.)
Key Takeaways (4.1c)
- BigQuery BI Engine is the primary solution for accelerating Looker Studio dashboards to sub-second latency.
- BI Engine works by caching data in memory, handling high concurrency effectively.
- Materialized views improve performance but are disk-based; BI Engine is memory-based.
- Connected Sheets enables the analysis of billions of rows of BigQuery data within Google Sheets.
Consideration 4.1d: Troubleshooting poor performing queries
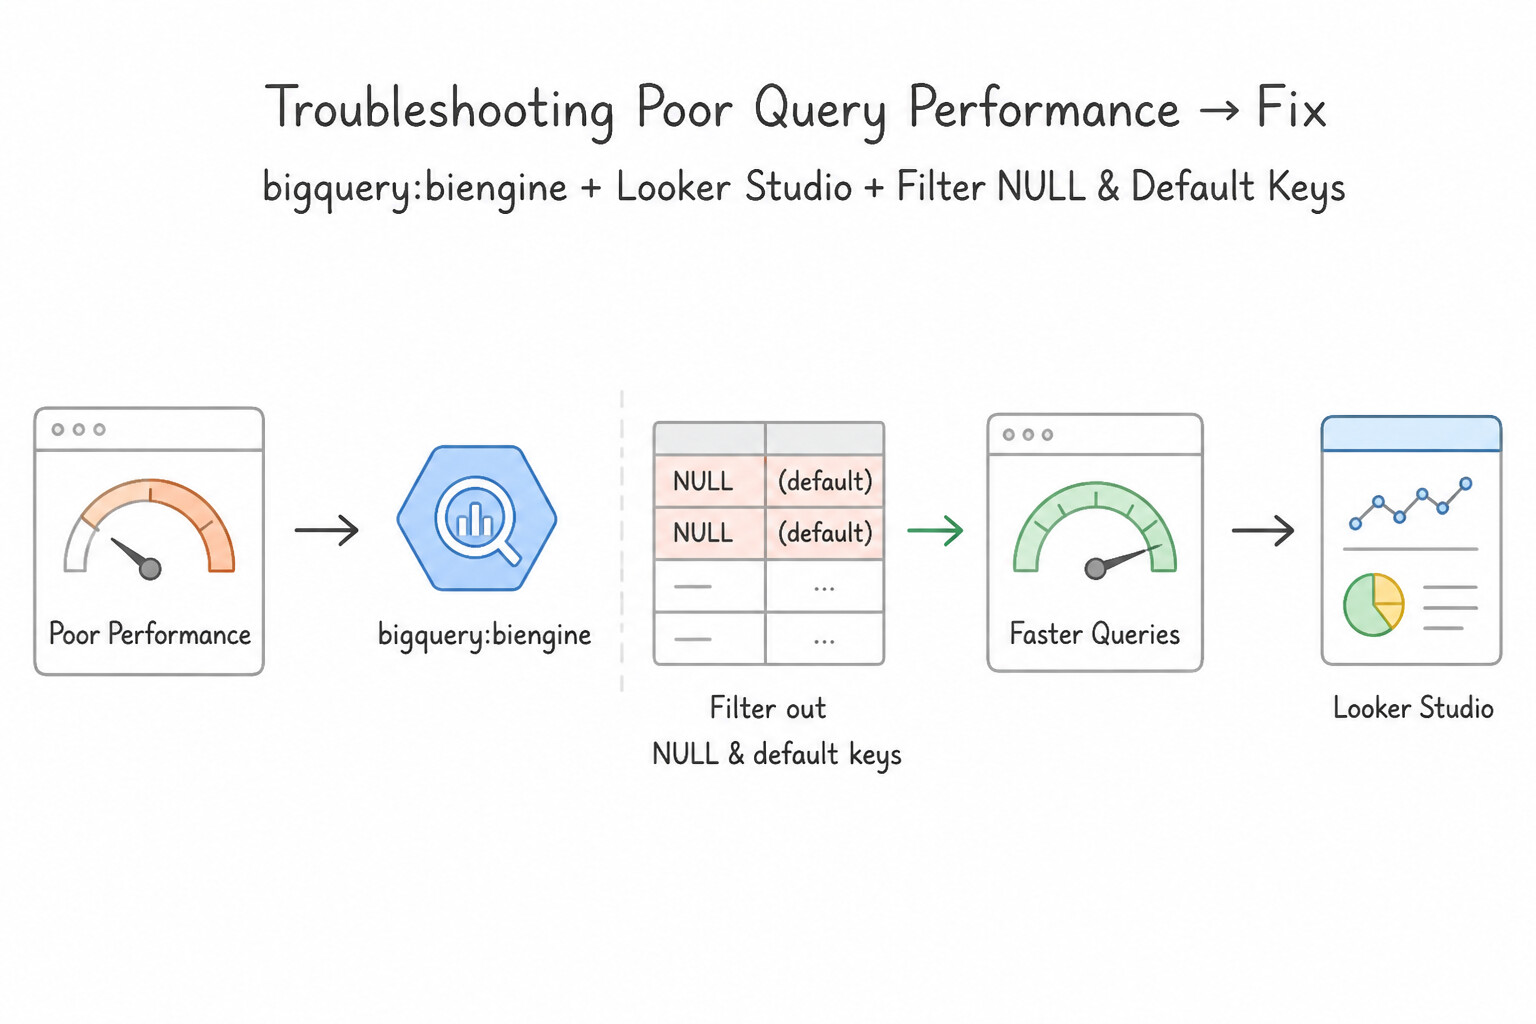
When a BigQuery query is slow, inspect the Query Execution Plan (Execution Details / Execution Graph) for these 5 classic bottlenecks:
- Data Skew / Partition Skew (
Max Compute Time >> Avg Compute Time): - Look at the stage timing bar: if the Average worker time is
200msbut the Maximum (Tail) worker time is45 seconds, one slot worker is stuck processing a single skewed key (NULL,'UNKNOWN', or'guest_user') during aJOINorGROUP BY! - Fix: Filter out
NULL/default keys before theJOIN, or use approximate aggregation functions (APPROX_COUNT_DISTINCT,APPROX_TOP_COUNT) which avoid exact single-key shuffles. - Shuffle Spill to Disk & Join Row Explosion (
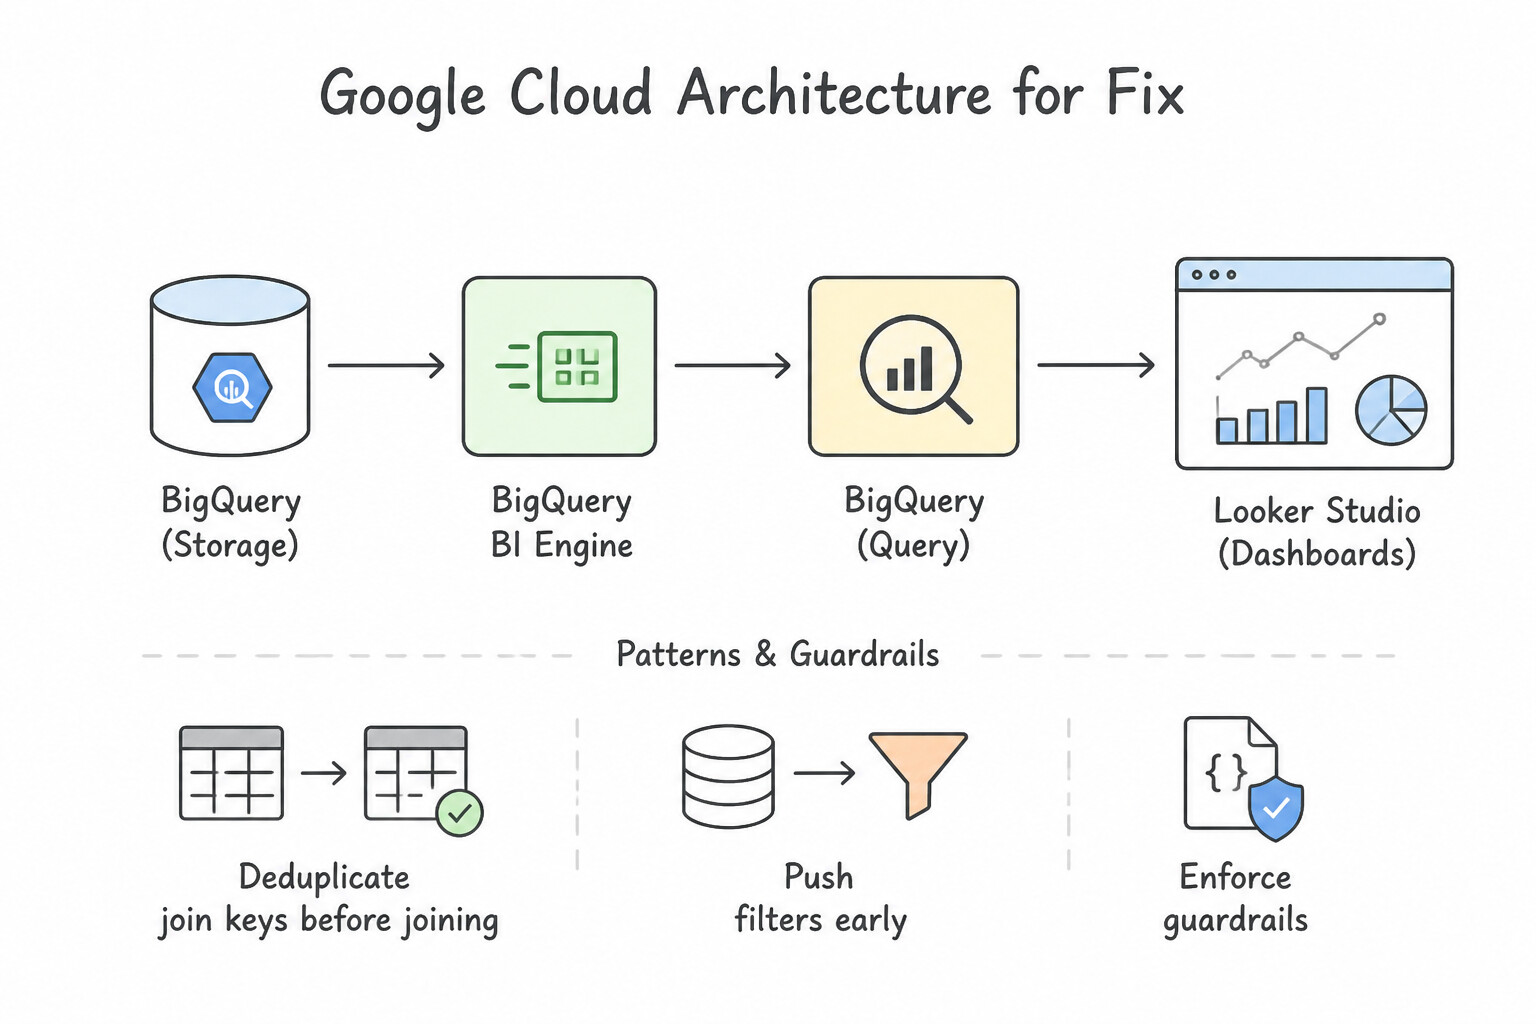
Output Rows >> Input Rows): - Caused by joining on non-unique keys (many-to-many cartesian product) or placing the smaller table on the wrong side or filtering too late.
- Fix: Deduplicate join keys before joining, push
WHEREfilters as early as possible (beforeJOIN), and place the largest table first followed by smaller tables ordered by size. - Self-Joins vs. Analytic Window Functions:
- Never join a 10 TB table to itself (
FROM events a JOIN events b ON a.user_id = b.user_id) to compare consecutive events! Replace self-joins with Window Functions (LAG(),LEAD(),FIRST_VALUE(),ROW_NUMBER() OVER (PARTITION BY user_id ORDER BY ts)). - Top-Level
ORDER BYWithoutLIMIT(Resources Exceeded): - Sorting 500 million rows at the final stage forces a single merge node (
COALESCE) to sort the entire result set in memory, triggeringResources exceeded during query execution. Always add aLIMIT Nclause to top-levelORDER BYqueries, or sort within partitions (OVER (PARTITION BY ... ORDER BY ...)). - High-Cardinality Point Lookups in Unstructured Logs (
Search Index): - When troubleshooting requires finding a specific
trace_id,ip_address, or email buried insideSTRINGorJSONcolumns across 100 TB, create a BigQuery Search Index (CREATE SEARCH INDEX ... ON table(ALL COLUMNS)) and query with theSEARCH()function.
Key Implementation Patterns
- Resolving Dashboard Latency with BI Engine: Use Configure BigQuery BI Engine and reserve sufficient memory capacity for the dataset. BI Engine provides in-memory caching for BigQuery, accelerating Looker Studio dashboards to sub-second speeds for datasets that fit in memory.
- Reducing Bytes Scanned via Partitioning: Use Create a new table partitioned by "TransactionDate" and clustered by "MerchantID". Load the data into this table. Partitioning by the date column reduces scan costs, and clustering by the ID improves sort/filter performance. (Avoid alternative: Partitioning by high-cardinality columns like IDs often hits table limits and does not optimize for date-based filtering.)
- Optimizing Aggregations with Materialized Views: Use Create a BigQuery materialized view that aggregates the metrics from the base table. Materialized views pre-compute aggregations for speed and automatically include recent changes for real-time consistency. (Avoid alternative: Scheduled queries introduce data staleness (latency) and do not meet the real-time requirement.)
Key Takeaways (4.1d)
- BI Engine is the primary tool for reducing latency in BigQuery for interactive dashboards.
- Sub-second response requirements usually necessitate in-memory solutions.
- Partitioning and Clustering are for cost and performance optimization on large datasets, but BI Engine is superior for interactivity on small-to-medium datasets.
- Interactive dashboards generate frequent, distinct queries; caching exact results (Cached Query Results) is less effective if filters change constantly.
Consideration 4.1e: Security, data masking, IAM, and Cloud DLP
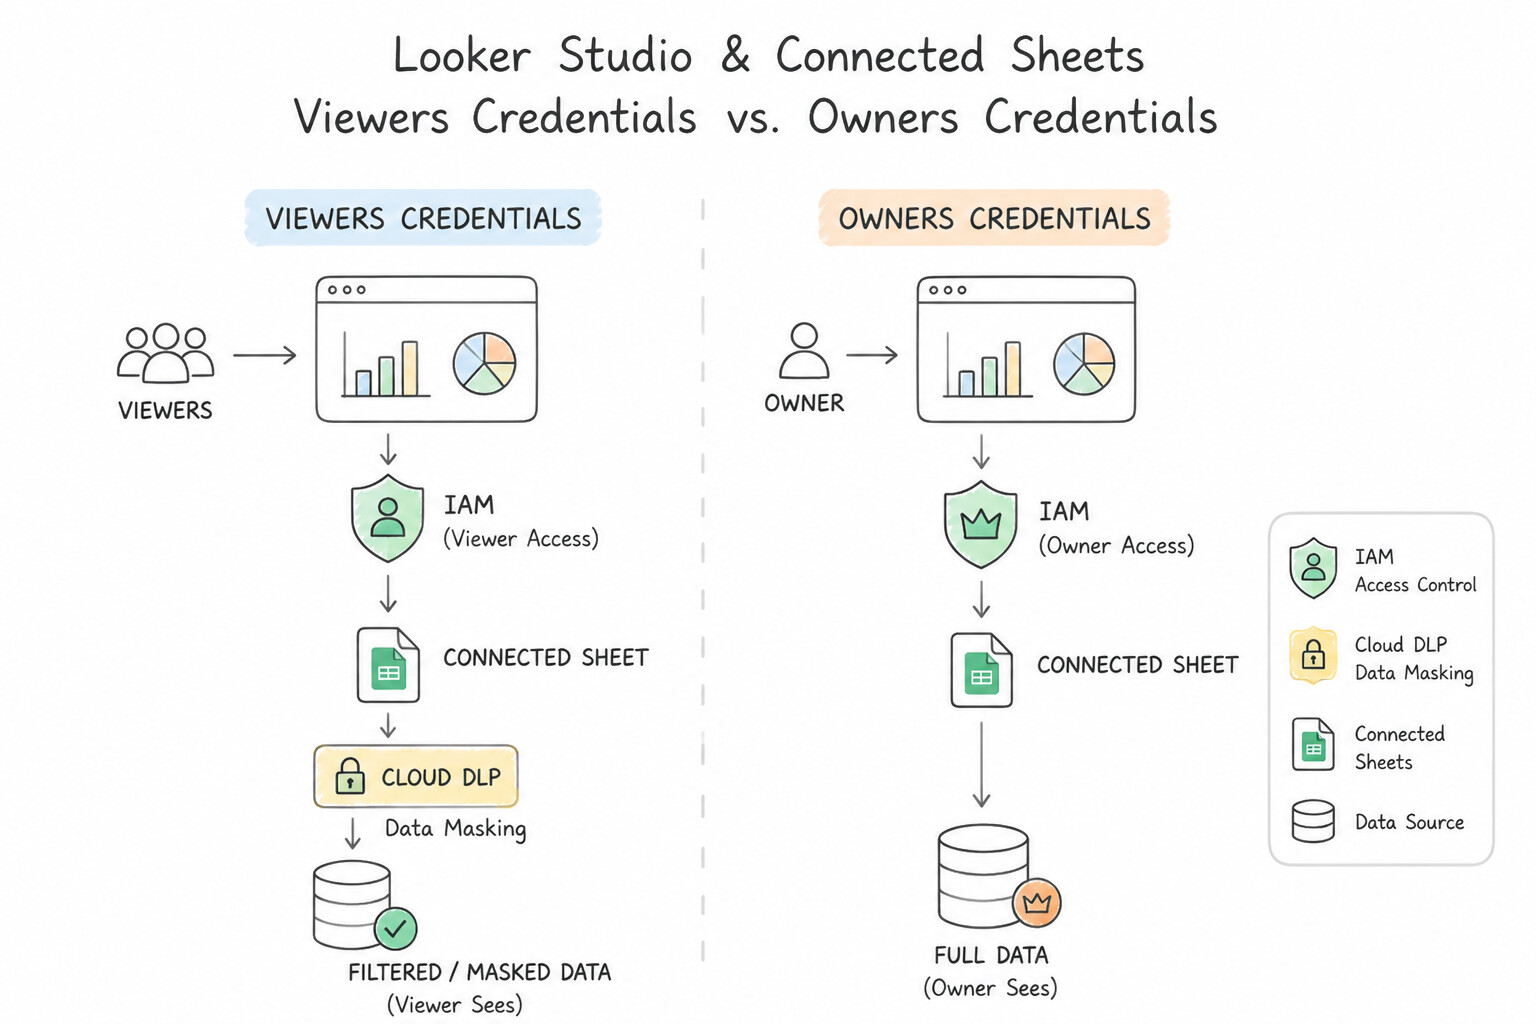
Ensure BI dashboards never leak unauthorized rows or columns:
- Viewer's Credentials vs. Owner's Credentials in Looker Studio / Connected Sheets:
- Owner's Credentials: Every viewer of the dashboard queries BigQuery using the report creator's identity—meaning BigQuery
SESSION_USER()evaluates to the owner, bypassing per-viewer Row-Level Security and Dynamic Data Masking! - Viewer's Credentials: Always select Viewer's Credentials when dashboard viewers have different row-level (
Row Access Policies) or column-level (Policy Tags+Dynamic Data Masking) permissions in BigQuery. - Protecting Query Cache When Row-Level Security Is Active:
- BigQuery automatically scopes query result caches per user and disables cross-user cache sharing on tables with Row-Level Security or Column-Level Dynamic Masking so User B never receives a cached result computed for User A.
Key Implementation Patterns
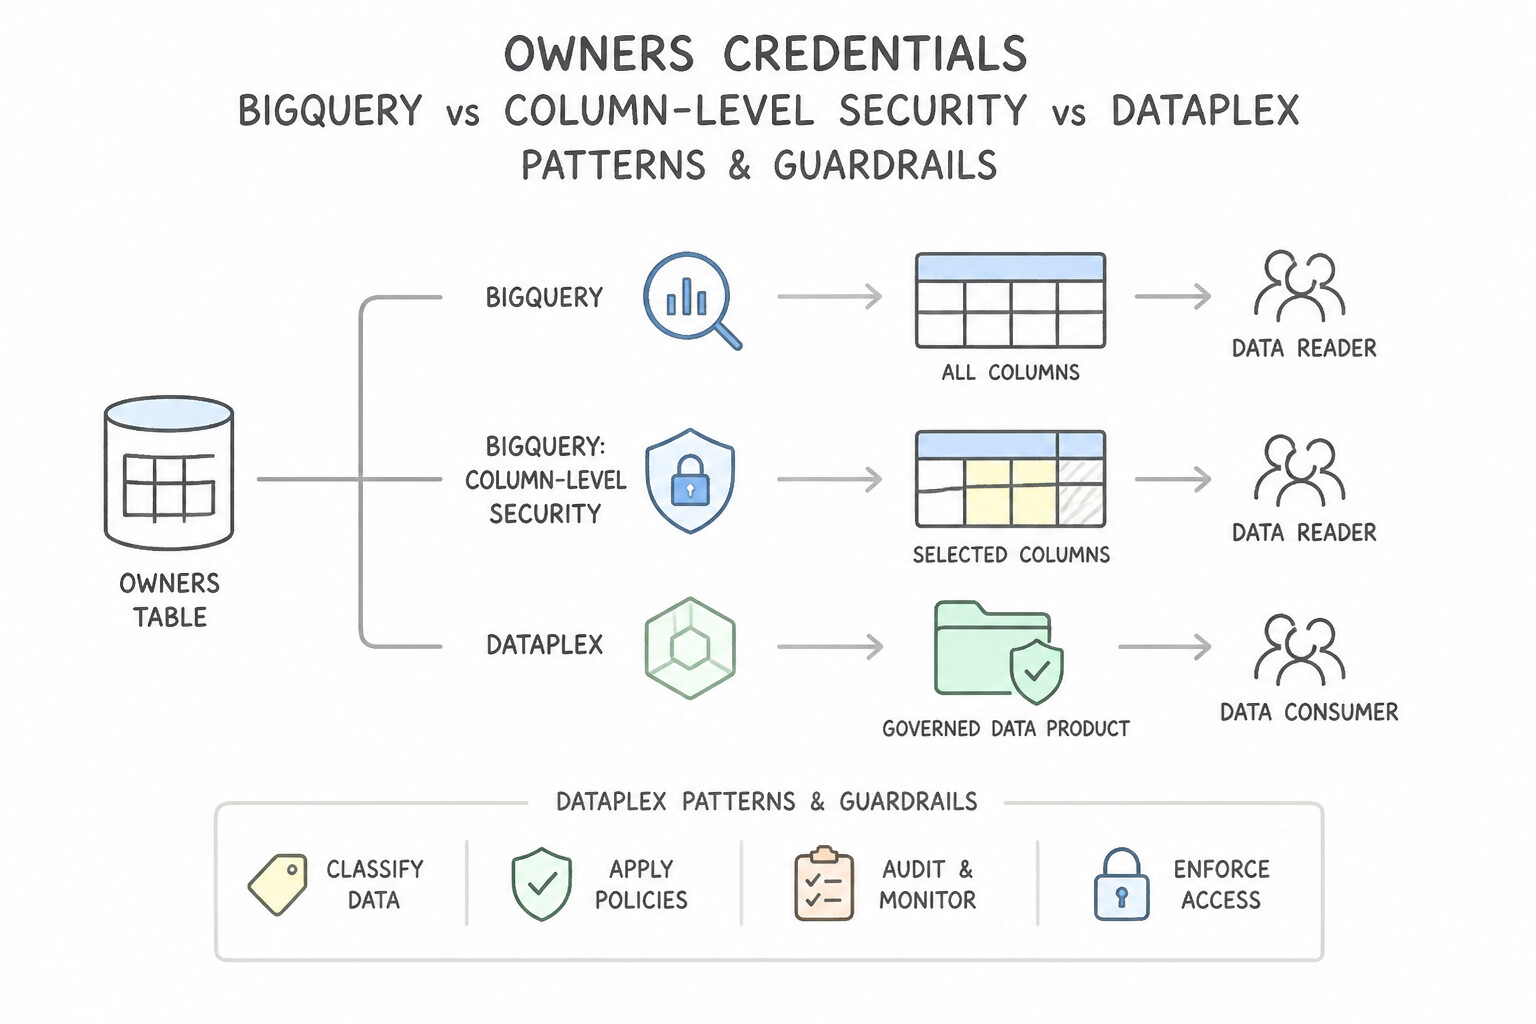
- Dynamic Data Masking for Analysts: Use Configure column-level security using Policy Tags. Create a taxonomy, assign a policy tag to the SSN column, and set a data masking rule for the analysts. BigQuery Policy Tags with Dynamic Data Masking allow you to obscure specific columns for certain users while keeping the table schema intact.
- Regional Data Isolation: Use Create a row-level security policy on the table that filters data based on the user's identity. Row-level security policies automatically filter rows based on the user's identity, allowing a single table to serve multiple regions securely. (Avoid alternative: Authorized views require creating separate objects for each region, increasing maintenance overhead compared to row-level security.)
- Permanent PII Redaction in ETL: Use Create a Dataflow pipeline to process the logs. Call the Cloud Data Loss Prevention (Cloud DLP) API within the pipeline to de-identify the credit card numbers before writing the results to BigQuery. Dataflow can call Cloud DLP to redact data in-flight, ensuring only clean data reaches BigQuery.
Key Takeaways (4.1e)
- Use BigQuery Policy Tags for column-level security.
- Use Dynamic Data Masking to obscure sensitive data (PII) without duplicating tables or creating views.
- Avoid using Cloud DLP for real-time access control; DLP is better suited for scanning and de-identifying data during ingestion or discovery.
- Use Row-Level Security to filter data rows based on user identity or group membership.
Quick Decision Cheat Sheet (Subsection 4.1)
If the Scenario Requires... | Choose This Google Cloud Pattern | Avoid This Common Mistake |
|---|---|---|
"Sub-second interactive dashboard response time over BigQuery with zero infrastructure management" | BigQuery BI Engine + Materialized Views | Exporting BigQuery tables to Cloud SQL every 5 minutes |
"Query fails with Resources exceeded during query execution on a query with a final ORDER BY timestamp DESC" | Add a LIMIT clause to the ORDER BY (or partition the sort using OVER (PARTITION BY ... ORDER BY ...)) | Switching from Standard SQL to Legacy SQL |
"Fast point lookups for specific IP addresses, UUIDs, or error codes inside 50 TB of STRING/JSON logs in BigQuery" | Create a BigQuery Search Index ( CREATE SEARCH INDEX) and use the SEARCH() function | Partitioning by ip_address (only date/timestamp/integer partitioning is supported) or running LIKE '%uuid%' full scans |
"Enforce centralized, Git-versioned business metric definitions across all enterprise dashboards" | Looker with LookML semantic modeling | Letting every analyst write custom calculated fields independently in separate Looker Studio reports |
Further Reading (Subsection 4.1)
- Introduction to BigQuery BI Engine — Overview of BI Engine capabilities, architecture, and how it accelerates SQL queries for BI tools.
- Get started with Connected Sheets — Official Google Workspace documentation explaining how Connected Sheets allows you to analyze billions of rows of BigQuery data in Google Sheets.
- Using Connected Sheets with BigQuery — Google Cloud documentation detailing the technical integration, permissions, and benefits of using Connected Sheets for BigQuery analysis.
- Control access to data sources - Looker Studio Help — Refer to the section 'Data credentials' which explains the difference between Owner's and Viewer's credentials.
- Introduction to materialized views — Explains how materialized views significantly boost performance and reduce costs for workloads with common repeated queries, and how they handle real-time data synchronization.
- Get started with Connected Sheets — Provides an overview of how Connected Sheets works with BigQuery to analyze billions of rows without SQL.
Subsection 4.2: Preparing data for AI and ML
The Big Picture
Preparing enterprise data for traditional Machine Learning and Generative AI (RAG) is a core pillar of the modern Google Cloud architecture (4.2a and 4.2b). Three architectural pitfalls sink production AI/ML data pipelines:
- Training-Serving Skew & Point-in-Time Data Leakage (4.2a): If data scientists engineer features in Python Pandas for training (
mean_30d_spend), and backend engineers re-implement those features in Java SQL for online serving, subtle differences in null handling or window boundaries cause Training-Serving Skew—destroying model accuracy in production. Worse, computing training features using a simpleJOINwithout a point-in-time timestamp cutoff leaks future customer behavior into historical training rows! BigQuery ML (TRANSFORMclause) and Vertex AI Feature Store (backed by BigQuery offline storage + Bigtable/Optimized online serving with point-in-time lookups) eliminate both bugs. - Unnecessary Data Export for Tabular ML (4.2a): Exporting 10 TB of structured tabular data out of BigQuery to Cloud Storage CSVs and spinning up custom GPU clusters just to train a customer churn classifier (
Logistic Regression/XGBoost) or sales forecast (ARIMA_PLUS) wastes days of engineering time and violates data governance perimeters. BigQuery ML (BQML) trains, evaluates, explains (ML.EXPLAIN_PREDICT), and serves models directly inside BigQuery using standard SQL. - Naive Embedding & Unfiltered RAG Retrieval (4.2b): Generating embeddings with a symmetric similarity task type instead of asymmetric retrieval task types (
RETRIEVAL_DOCUMENTfor corpus chunks vs.RETRIEVAL_QUERYfor user questions) degrades recall. And building a RAG pipeline over millions of PDFs/images in Cloud Storage without BigQuery Object Tables +ML.GENERATE_EMBEDDING+VECTOR_SEARCH(withIVF/TreeAHvector indexes) forces brittle custom ETL orchestration.
Consideration 4.2a: Preparing data for feature engineering, training and serving ML models (e.g., BigQueryML)
Master every production-relevant aspect of BigQuery ML (BQML) and Vertex AI Feature Store:
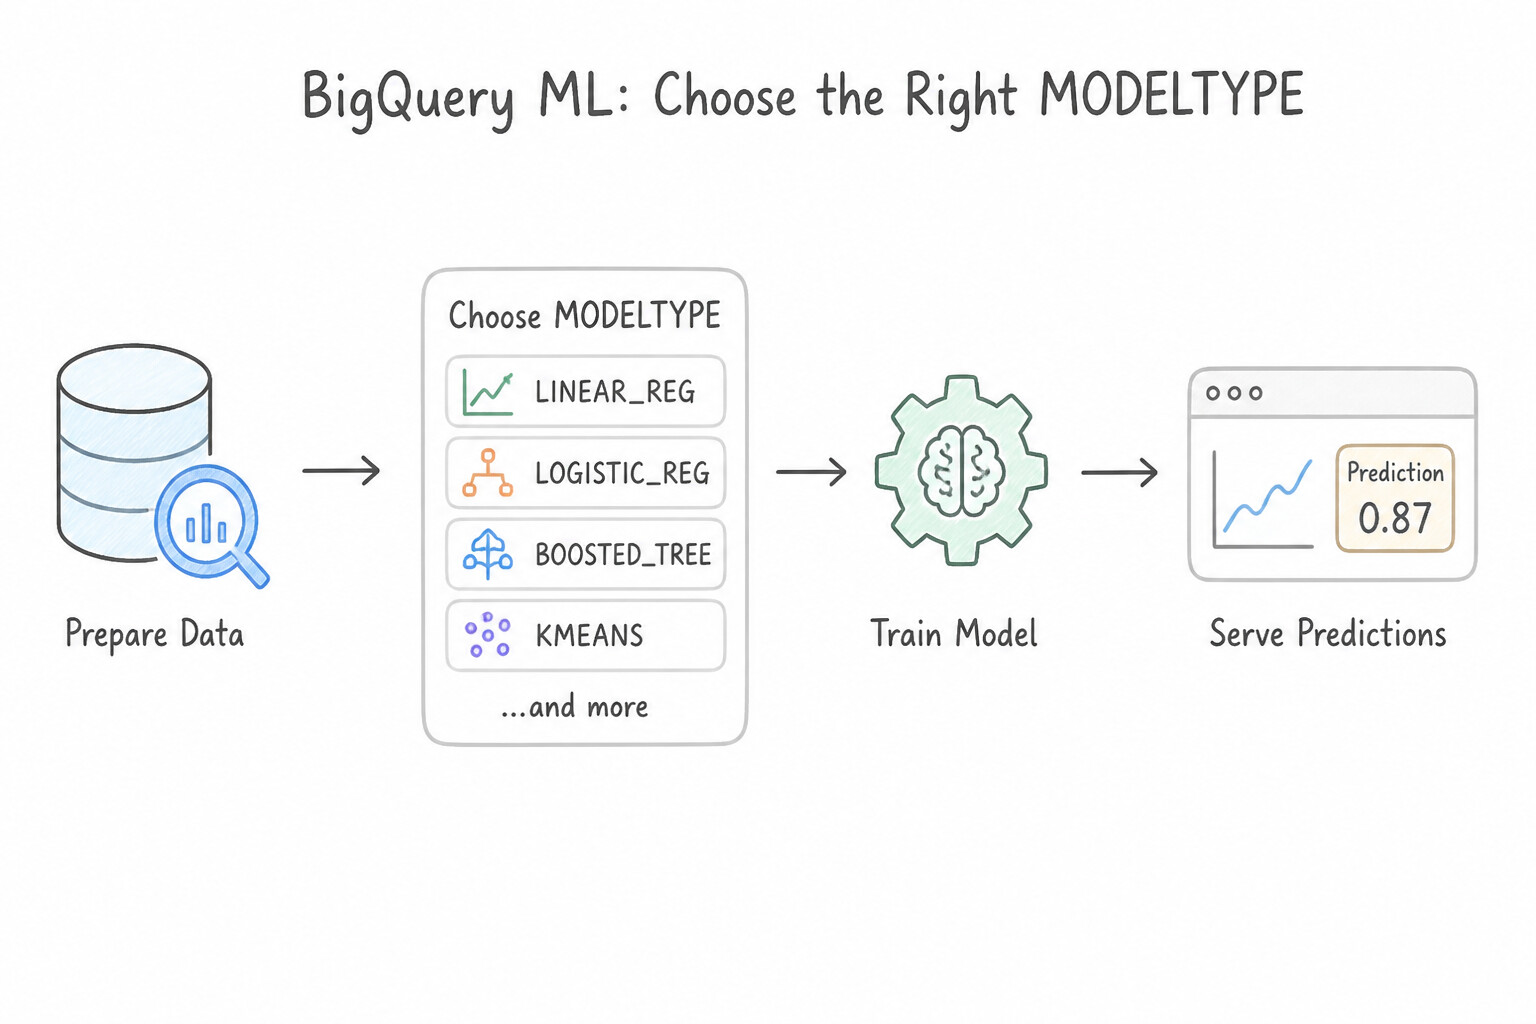
- Choosing the Right
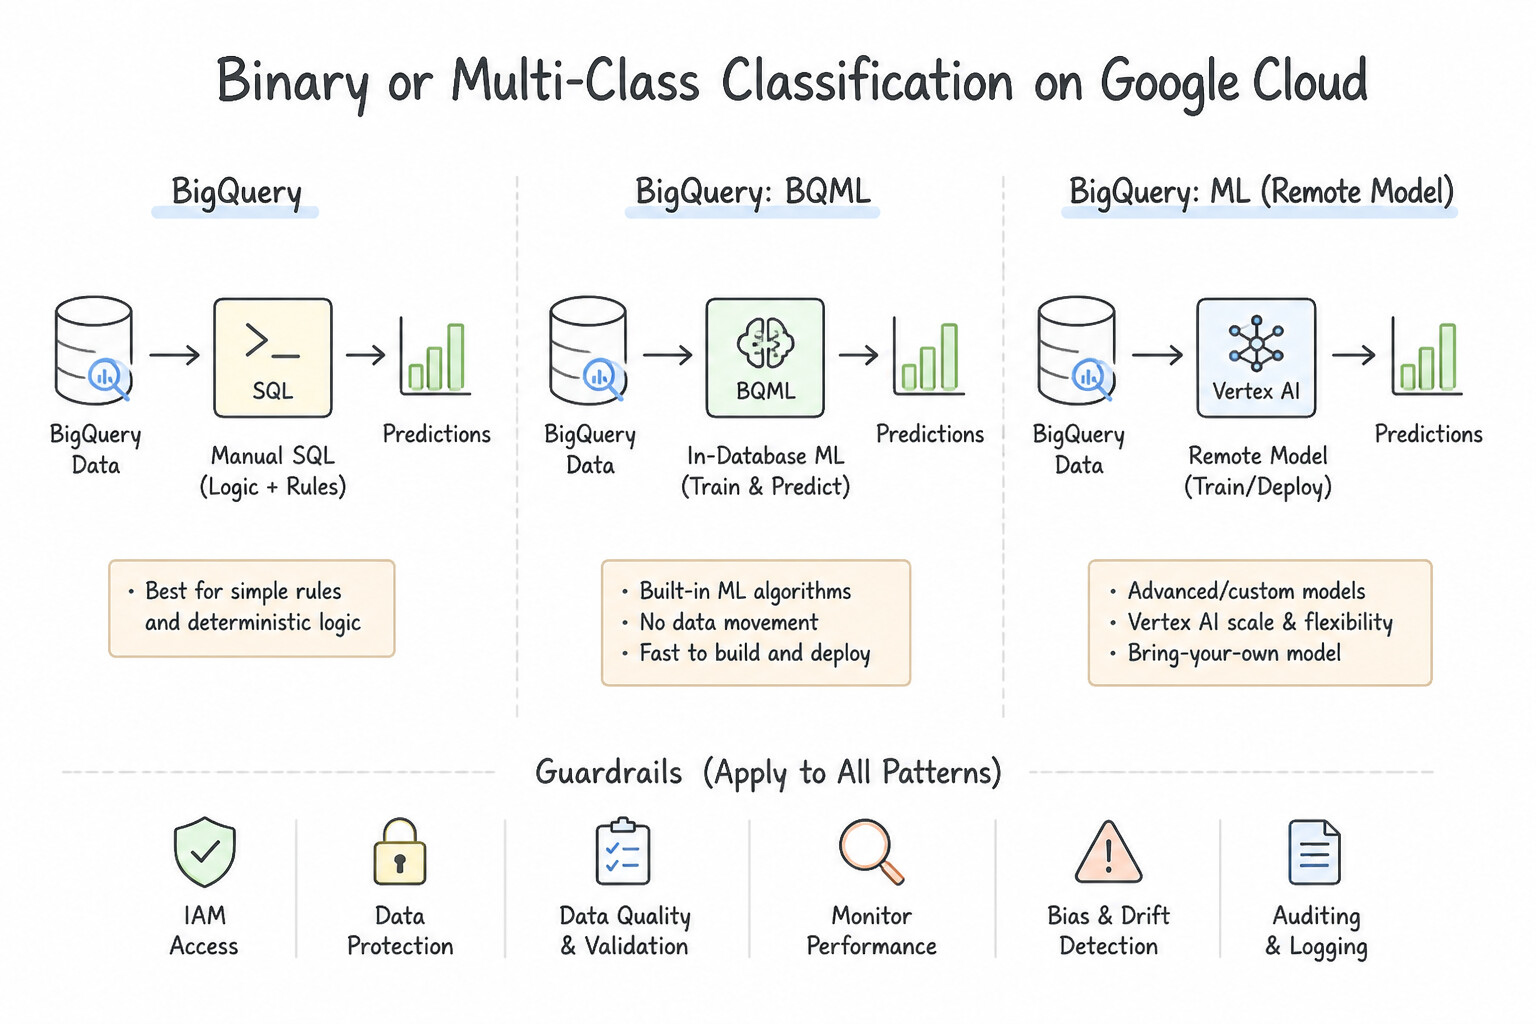
MODEL_TYPEin BigQuery ML: - Binary or Multi-Class Classification (churn, fraud, click prediction):
LOGISTIC_REG(fast baseline),BOOSTED_TREE_CLASSIFIER(XGBoostfor high accuracy on tabular data),DNN_CLASSIFIER, orAUTOML_CLASSIFIER. - Continuous Value Regression (LTV, house price, trip duration):
LINEAR_REG,BOOSTED_TREE_REGRESSOR,DNN_REGRESSOR, orAUTOML_REGRESSOR. - Time-Series Forecasting (daily demand, server load with seasonality & holidays):
ARIMA_PLUSorARIMA_PLUS_XREG(handles missing dates, step changes, trends, seasonalities, and regional holiday effects automatically!). - Unsupervised Customer Segmentation / Anomaly Detection:
KMEANS(ML.DETECT_ANOMALIESworks onKMEANS,ARIMA_PLUS,PCA, andAUTOENCODER). - Collaborative Filtering / Product Recommendations:
MATRIX_FACTORIZATION(requires user, item, and rating columns; note: requires reserved/Enterprise slots). - Preventing Training-Serving Skew with the
TRANSFORM(...)Clause: - Always wrap preprocessing functions (
ML.STANDARD_SCALER,ML.MIN_MAX_SCALER,ML.ONE_HOT_ENCODER,ML.BUCKETIZE,ML.FEATURE_CROSS) inside theCREATE MODEL ... TRANSFORM(...)clause! BigQuery saves the exact training mean, standard deviation, and category vocabulary inside the model artifact and applies them automatically duringML.PREDICT—completely eliminating training-serving skew! - Preventing Data Leakage in Train/Eval Splits:
- For time-dependent data, never use
DATA_SPLIT_METHOD = 'RANDOM'(leaks future trends into training). UseDATA_SPLIT_METHOD = 'SEQ'withDATA_SPLIT_COL = 'event_timestamp'(or'CUSTOM'). - Real-Time Low-Latency Serving vs. Batch/Streaming SQL Inference:
- For batch or micro-batch streaming inside BigQuery/Dataflow, run
SELECT * FROM ML.PREDICT(MODEL ...)directly. - When an external web/mobile app needs
<10msonline inference or online feature lookups, export the BQML model to Vertex AI Model Registry / Endpoints (EXPORT MODELor nativeVERTEX_AI_MODEL_IDregistration) and serve features via Vertex AI Feature Store!
Key Implementation Patterns
- Handling Missing Numerical Data in BQML: Use Use the TRANSFORM clause in your CREATE MODEL statement and apply the ML.IMPUTER function to the square_footage column with the mean strategy. Use the ML.IMPUTER function within the TRANSFORM clause to automatically fill NULLs with the mean value.
- Feature Crossing for Spatial Data: Use Apply ML.BUCKETIZE to the latitude and longitude columns, and then apply ML.FEATURE_CROSS to the results. Bucketizing coordinates creates ranges, and crossing them creates a grid system representing specific geographic areas. (Avoid alternative: Crossing raw floating-point numbers creates too many unique categories and leads to overfitting.)
Key Takeaways (4.2a)
- Imputation: Always handle NULLs in numerical features to prevent data loss or model errors.
- ML.IMPUTER: Use this BQML function within the TRANSFORM clause for automatic mean or median replacement.
- TRANSFORM Clause: encapsulating preprocessing logic within the model prevents training-serving skew.
- Feature Crosses allow linear models to learn non-linear interactions between features.
Consideration 4.2b: Preparing unstructured data for embeddings and RAG
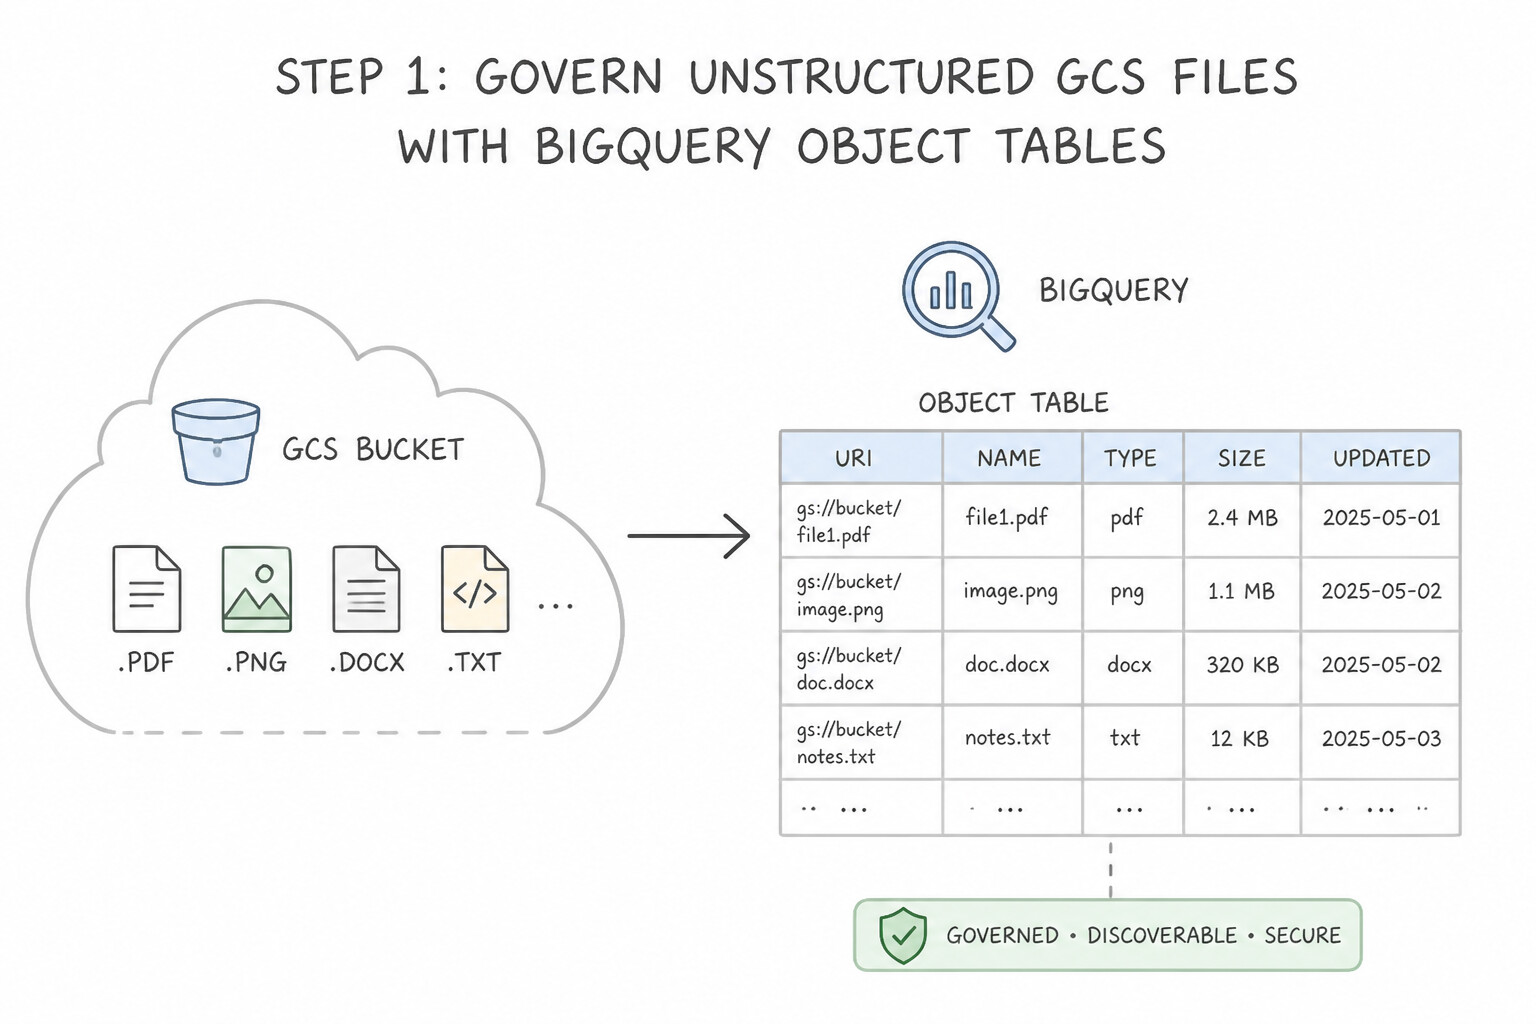
Build scalable, governed Retrieval-Augmented Generation (RAG) pipelines over unstructured enterprise data:
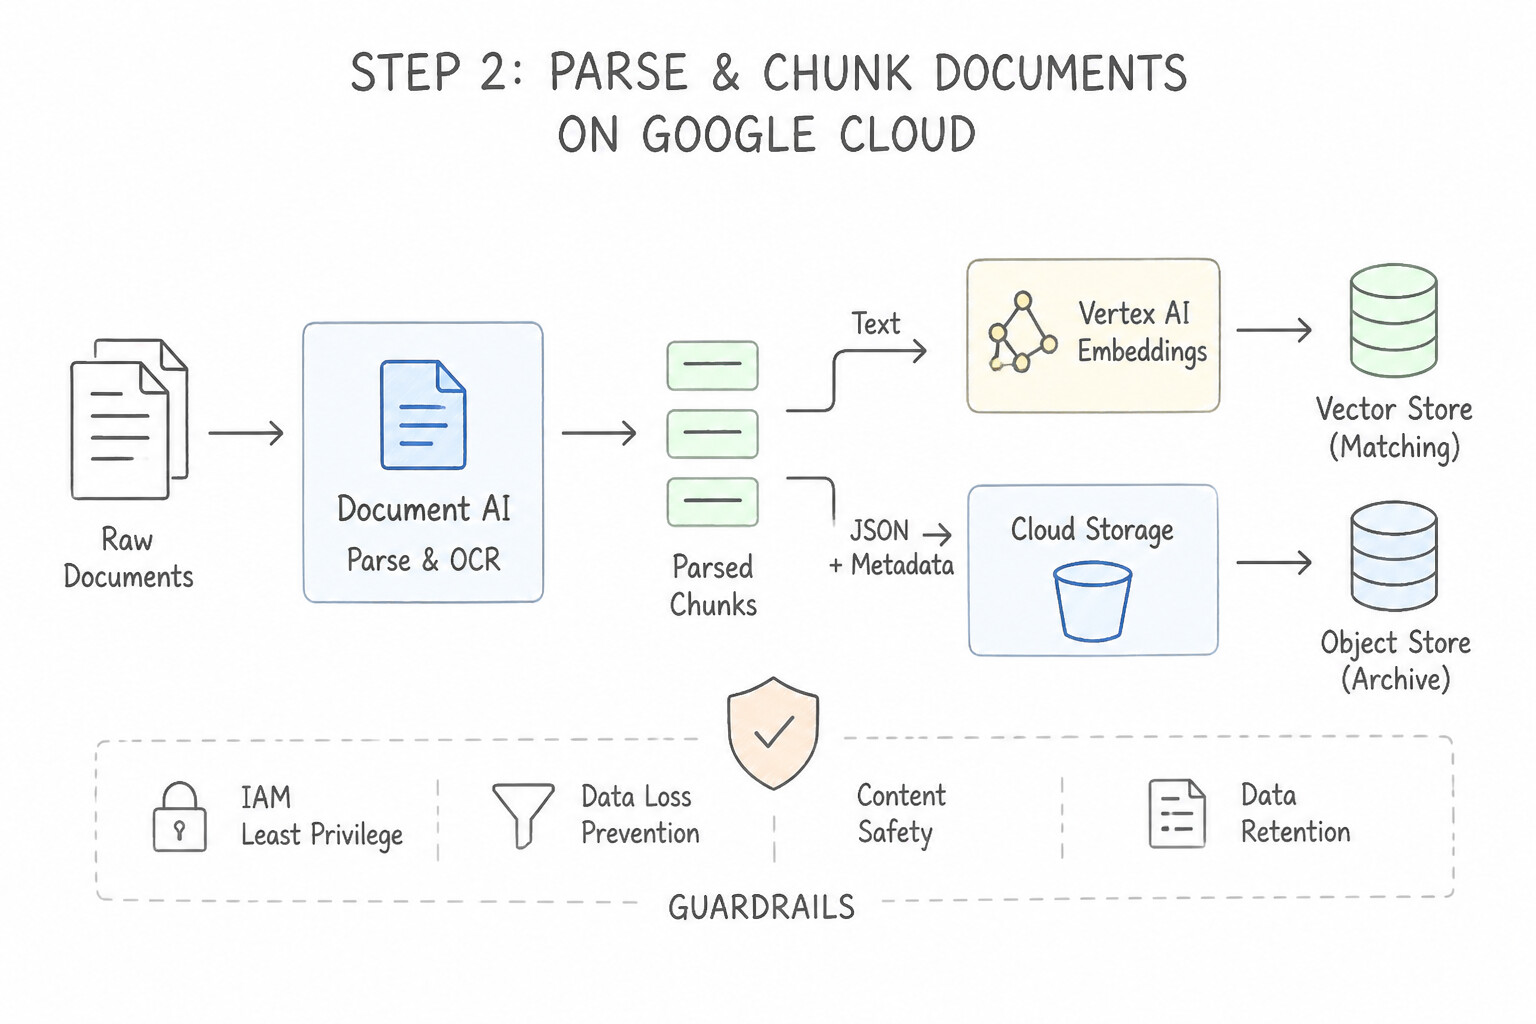
- Step 1 — Govern Unstructured GCS Files with
BigQuery Object Tables: - Create a BigQuery Object Table (
CREATE EXTERNAL TABLE ... WITH CONNECTION ... OPTIONS(object_metadata = 'SIMPLE', uris = ['gs://bucket/pdfs/*'])) over unstructured PDFs, images, or audio files in Cloud Storage. Object Tables provide a structured row per file (uri,content_type,size,updated,md5_hash) and allow you to enforce BigQuery Row-Level Security on unstructured files! - Step 2 — Parse & Chunk Documents (
Document AI/ML.PROCESS_DOCUMENT): - Extract structured entities and layout-aware text chunks (preserving tables, headers, and paragraphs) from PDFs using Document AI Layout Parser or
ML.PROCESS_DOCUMENTin BigQuery. - Step 3 — Generate Embeddings with Correct Asymmetric
task_type: - Use
ML.GENERATE_EMBEDDINGin BigQuery (backed by a Vertex AI remotetext-embedding-004/text-embedding-005or multimodal embedding model). - Key Architectural Rule: When calling Vertex AI text embedding models for RAG, set
task_type = 'RETRIEVAL_DOCUMENT'when embedding the knowledge-base document chunks, and settask_type = 'RETRIEVAL_QUERY'when embedding the user's incoming search question! (UseSEMANTIC_SIMILARITYonly when comparing two symmetric texts). - Step 4 — Index & Retrieve Vectors (
VECTOR_SEARCH/Vertex AI Vector Search/AlloyDB pgvector): - In-Warehouse Analytics & Batch/Interactive RAG (
BigQuery VECTOR_SEARCH): Create an approximate nearest neighbor index (CREATE VECTOR INDEX ... OPTIONS(index_type = 'IVF' | 'TREE_AH', distance_type = 'COSINE')) on theARRAY<FLOAT64>embedding column and query viaVECTOR_SEARCH(), passing retrieved context toML.GENERATE_TEXT(Gemini). - Ultra-Low-Latency Online App RAG (
<10ms–20msat high QPS): Sync embeddings to Vertex AI Vector Search (Streaming Index with hybrid dense+sparse filtering) or AlloyDB for PostgreSQL (pgvector+ScaNNindex).
Key Implementation Patterns
- Preprocessing Scanned Documents for RAG: Use Use Document AI to extract text from the scanned PDFs. Generate embeddings from the extracted text. Scanned PDFs are images; you must use OCR (Document AI) to convert them into text before generating text embeddings. (Avoid alternative: Changing model parameters does not fix the issue that the input data is in an image format rather than text.)
- Multimodal Embedding Generation: Use Use Vertex AI Multimodal Embeddings to generate vectors for the user's image and the catalog data, and store them in Vertex Search. Multimodal embeddings map images and text to the same vector space, enabling semantic search across different data types.
- Optimizing Chunking Strategies: Use Implement a chunk overlap (sliding window) between adjacent text segments. Chunk overlap ensures that information spanning a split boundary is fully captured in at least one of the adjacent chunks. (Avoid alternative: Increasing chunk size changes the split points but does not prevent information from being cut in half at the new boundaries.)
Key Takeaways (4.2b)
- Text embedding models require text input; they cannot process raw image files directly.
- Scanned PDFs are images, not text files, even if they contain words visible to the human eye.
- Use Google Cloud Document AI to perform OCR and extract text from images before analysis.
- Preprocessing is a critical step in ML pipelines to ensure data is in the correct format for the model.
Quick Decision Cheat Sheet (Subsection 4.2)
If the Scenario Requires... | Choose This Google Cloud Pattern | Avoid This Common Mistake |
|---|---|---|
"Serve consistent ML features for both offline batch training in BigQuery (with point-in-time correctness) and <10ms online serving" | Vertex AI Feature Store | Maintaining two separate SQL and Python feature codebases manually |
"Highly imbalanced fraud dataset (99.8% legitimate, 0.2% fraud) in BigQuery ML classification" | Set AUTO_CLASS_WEIGHTS = TRUE in CREATE MODEL options and evaluate using ROC_AUC / PR_AUC (Precision-Recall) | Evaluating an imbalanced model using overall Accuracy (a dummy model predicting 0% fraud gets 99.8% accuracy!) |
"Score streaming events in BigQuery without moving data to an external container endpoint" | Use BigQuery ML ( ML.PREDICT) directly over the streaming table/Dataflow pipeline | Exporting streaming rows to GCS every minute to run batch PyTorch jobs |
"Accelerate VECTOR_SEARCH over 20 million embedding rows in BigQuery so it doesn't perform a brute-force scan" | Create a Vector Index ( CREATE VECTOR INDEX ... OPTIONS(index_type='TREE_AH' or 'IVF')) | Clustering on an ARRAY<FLOAT64> column (arrays cannot be clustered directly in BigQuery) |
Further Reading (Subsection 4.2)
- The TRANSFORM clause in BigQuery ML — Documentation explaining how to use the TRANSFORM clause to specify preprocessing steps inside the model definition.
- ML.IMPUTER function — Reference for the ML.IMPUTER function, which replaces NULL values with the mean, median, or mode.
- How BigQuery ML does feature preprocessing | Google Cloud Blog — Refer to the section on 'Feature crossing' to understand how to combine features effectively using SQL syntax.
- ML.FEATURE_CROSS function — Documentation explains the syntax and behavior of creating struct features from input columns.
- Document AI overview — Explains how Document AI uses machine learning to extract structured data and text from unstructured documents like pdfs and images.
- Get text embeddings — Documentation on how to use Vertex AI to generate embeddings, highlighting that the input must be text.
Subsection 4.3: Sharing data
The Big Picture
Enterprises increasingly monetize and share datasets with external partners, suppliers, regulators, and internal subsidiaries. Subsection 4.3 tests how you replace brittle legacy data-sharing pipelines with zero-copy, privacy-preserving architectures:
- The Nightly Export & Copy Synchronization Trap (
4.3b,4.3d): Exporting a 20 TB BigQuery dataset to Cloud Storage CSVs every night and transferring it to 30 external partner organizations creates 600 TB of duplicate storage, incurs egress charges, and leaves partners looking at 24-hour-stale data. BigQuery Analytics Hub solves this via Data Exchanges, Listings, and Linked Datasets: the publisher stores the dataset once (paying only for single-copy storage), while each subscriber mounts a read-only Linked Dataset in their own project that reflects live updates instantaneously (with each subscriber paying for their own query compute slots!). - Privacy-Safe Multi-Party Collaboration (
4.3a,4.3d): When a retailer and a media network want to measure campaign conversion overlap without either party exposing their raw customer PII list or allowingSELECT *row-level extraction, standard dataset sharing is too permissive. Analytics Hub Data Clean Rooms with Analysis Rules (Aggregation Thresholds & Differential Privacy) enforce that subscribers can only run approved aggregate queries where every output group contains at least$K$ minimum distinct users. - Sharing Reports vs. Datasets (
4.3a,4.3c): When external stakeholders only need curated visual KPIs rather than SQL access, publishing governed Looker dashboards (embedded with signed SSO / access grants) or scheduled visual reports prevents raw table exposure.
Consideration 4.3a: Defining rules to share data
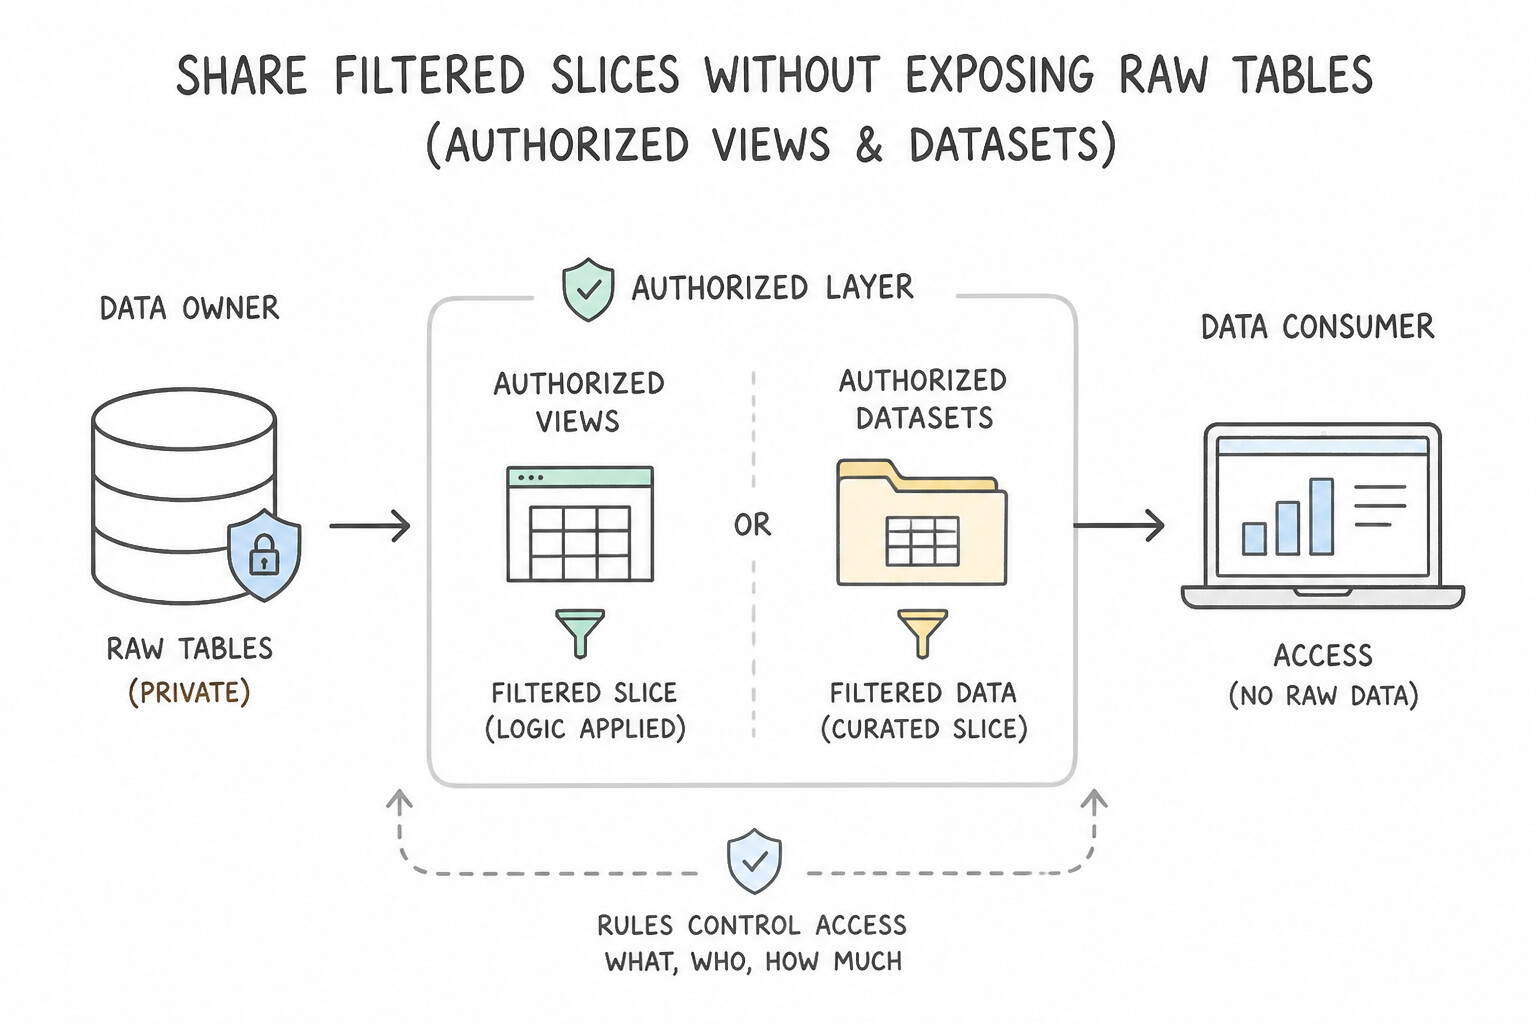
Choose the right sharing boundary based on whether you are sharing within one project, across projects, or across distrusting external parties:
- Sharing Filtered Slices Without Exposing Raw Tables (
Authorized Views/Authorized Datasets/Authorized Routines): - Create a view (or table-valued function) in a dedicated
shared_viewsdataset that filters rows (e.g.,WHERE tenant_email = SESSION_USER()) or omits sensitive columns. - Authorize the entire
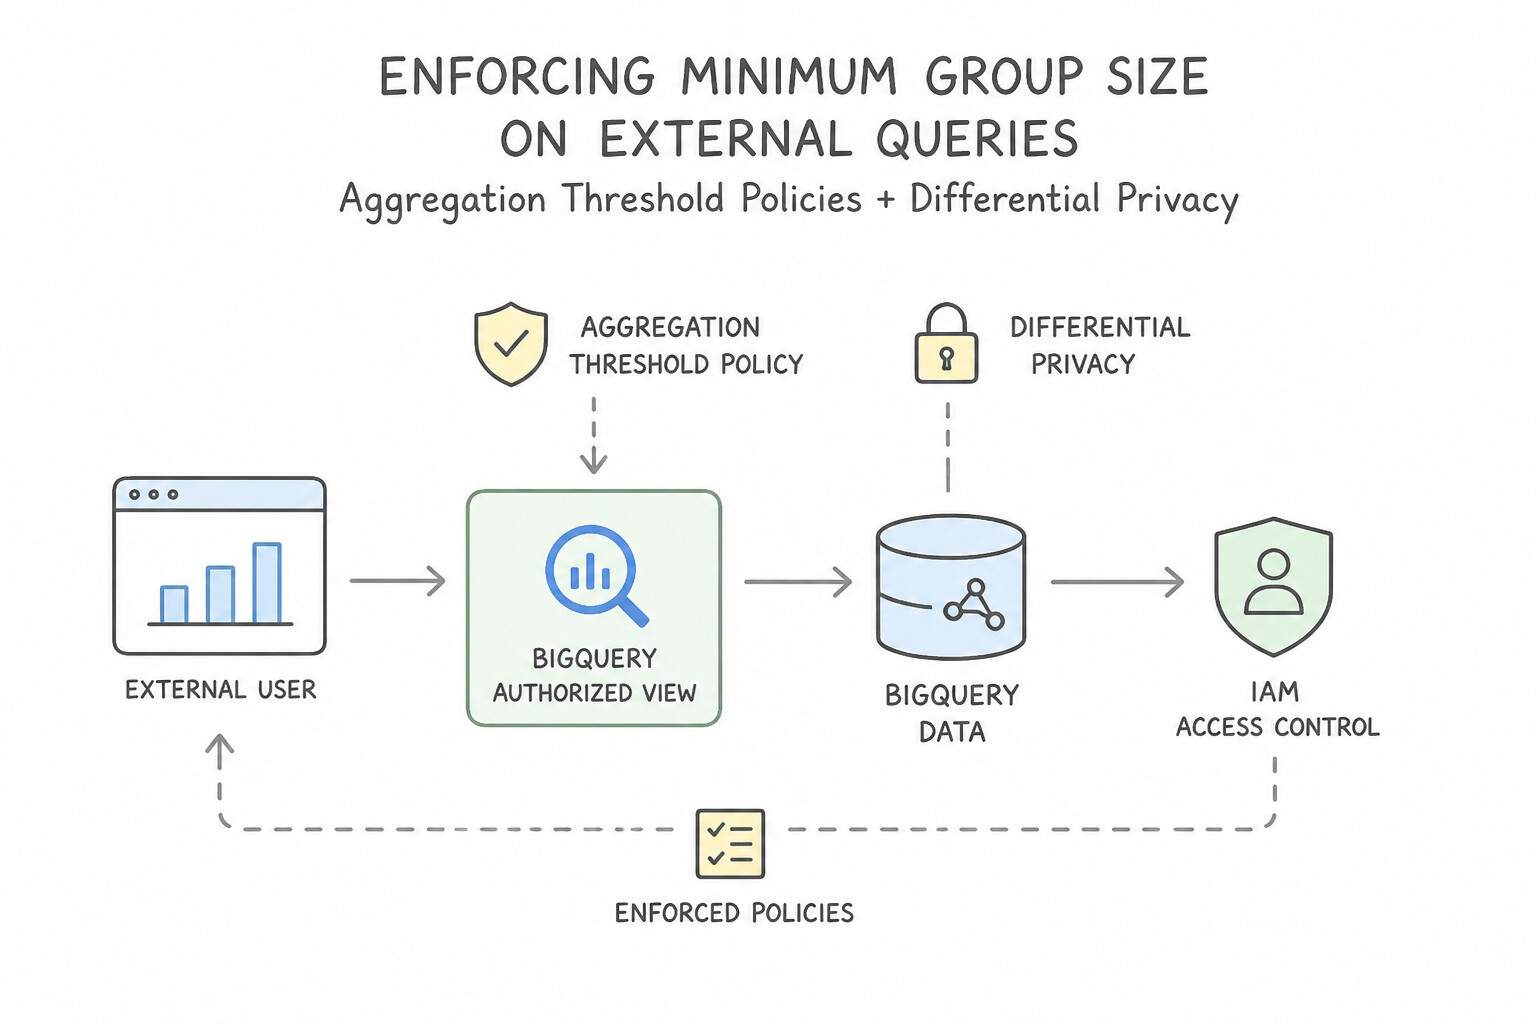
shared_viewsdataset (Authorized Dataset) on the underlyingraw_datadataset so you don't have to authorize individual views one by one! - Enforcing Minimum Group Size on External Queries (
Aggregation Threshold Policies/Differential Privacy): - When external partners query a shared view or Data Clean Room and you must prevent them from isolating a single individual's record via clever
WHEREclauses, attach a BigQuery Aggregation Policy (OPTIONS(privacy_policy= '{"aggregation_threshold_policy": {"threshold": 50, "privacy_unit_columns": ["user_id"]}}')) so queries must useSELECT WITH AGGREGATION_THRESHOLD(orSELECT WITH DIFFERENTIAL_PRIVACY) and groups with fewer than 50 users are automatically suppressed!
Key Implementation Patterns
- Restricting Column Access without Data Duplication: Use Create a view that queries the
sales_rawtable for the required aggregates. Authorize the view to access the source dataset. Grant the marketing team access to the view. Authorized Views allow users to query a view without having direct access to the underlying source tables. - Secure Sharing with External Organizations: Use Create an Analytics Hub exchange and a listing for the dataset. Grant the partners permission to view the listing so they can subscribe. Analytics Hub enables a publisher-subscriber model for secure cross-organization data sharing without granular IAM management.
- Dynamic Filtering based on User Region: Use Create a row access policy on the table that filters data based on the SESSION_USER() function. Row-Level Security (RLS) dynamically filters rows based on the user's identity using a single policy on the table. (Avoid alternative: Authorized views require creating multiple resources (one per region), which complicates management compared to a single RLS policy.)
Key Takeaways (4.3a)
- Authorized Views enable data sharing with fine-grained control without exposing underlying source tables.
- Views are virtual and do not duplicate data storage.
- Always follow the principle of least privilege: grant access only to the specific data needed (aggregates) rather than the entire raw dataset.
- Analytics Hub is the preferred method for sharing BigQuery datasets across organizational boundaries.
Consideration 4.3b: Publishing datasets
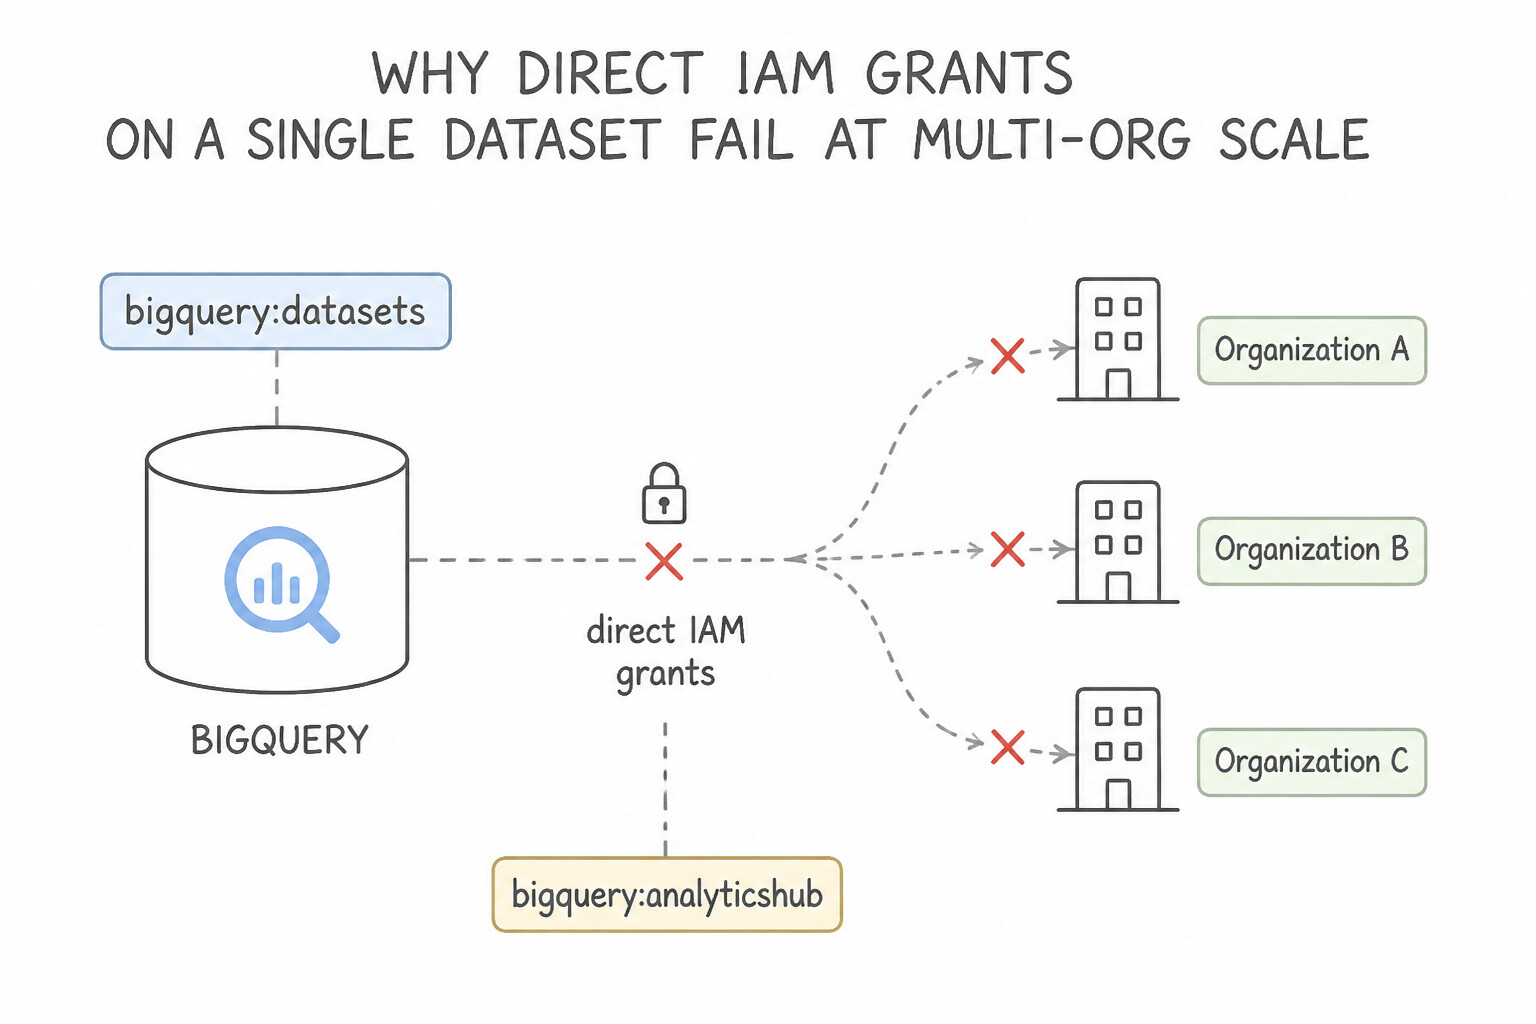
When publishing datasets to dozens or hundreds of internal/external consumers:
- Why Direct IAM Grants on a Single Dataset Fail at Multi-Org Scale:
- Manually managing external Google Group emails on a single dataset's IAM policy across 100 customer organizations creates audit clutter, hits IAM policy binding limits, and forces you to manage VPC-SC exceptions for every customer.
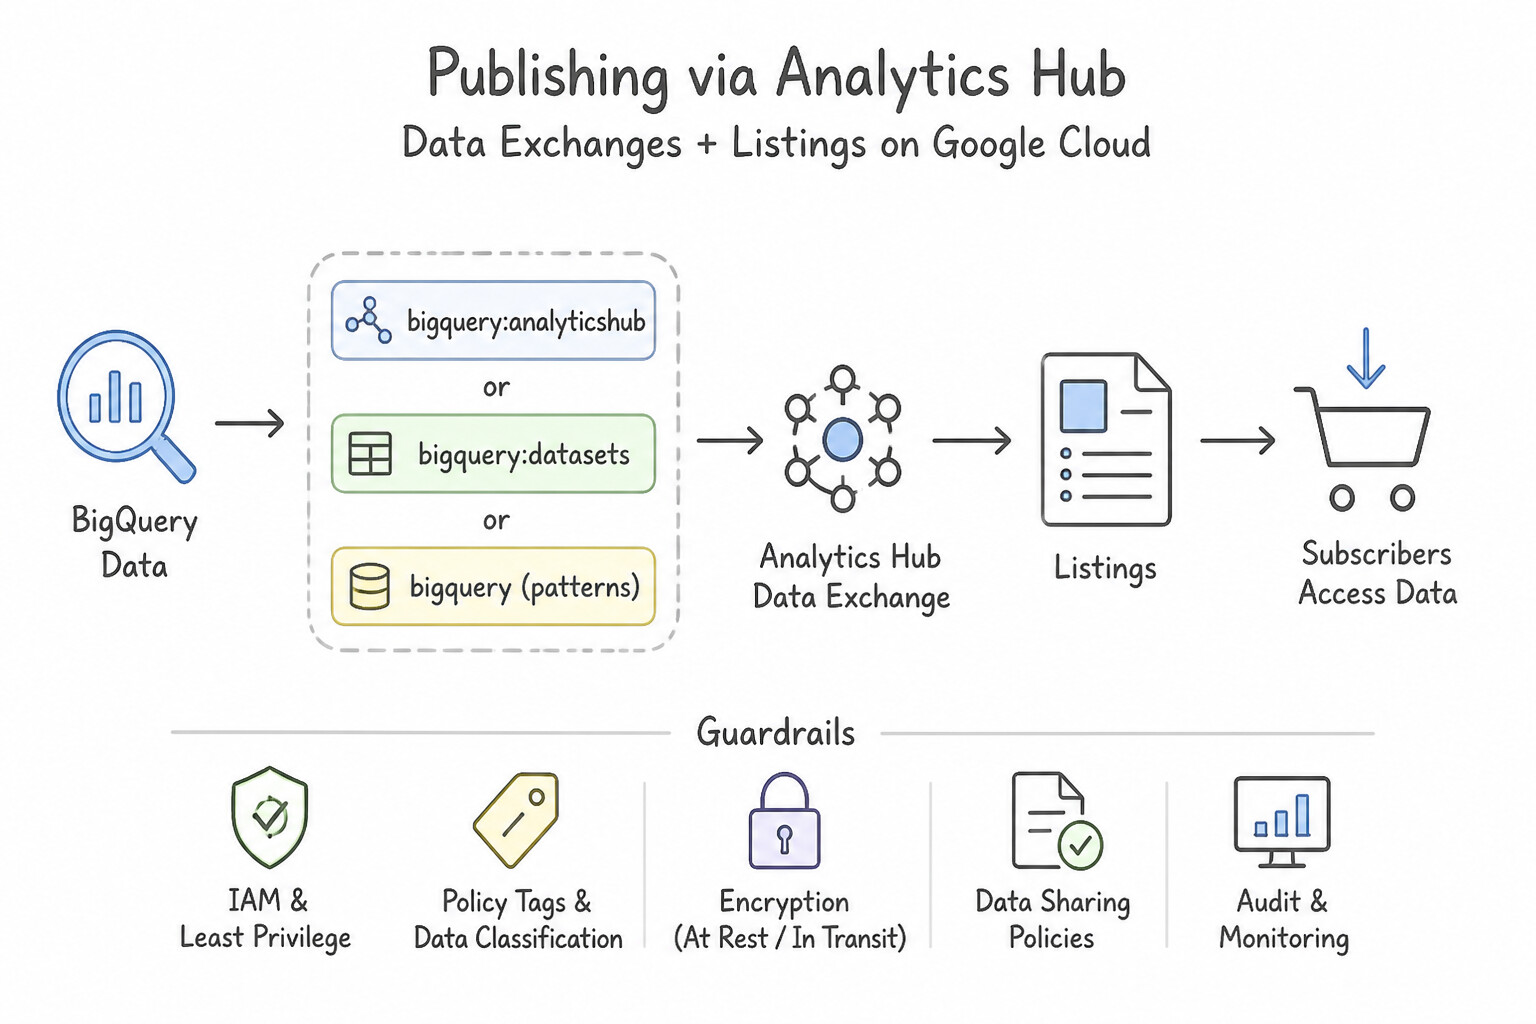
- Publishing via
Analytics Hub(Data Exchanges+Listings): - Create a Data Exchange (a logical container for sharing datasets inside or outside your organization).
- Create a Listing inside the Data Exchange pointing to your shared BigQuery dataset (which can contain tables, views, or multi-tenant Row Access Policies).
- Grant
roles/analyticshub.subscriberon the Listing to the target partner organizations (or publish the Listing commercially via Google Cloud Marketplace). - If a partner contract ends, simply revoke their subscription on the Listing—their Linked Dataset immediately loses access to the underlying data with zero file deletions required!
Key Implementation Patterns
- Zero-Copy External Sharing via Analytics Hub: Use Create an Analytics Hub exchange, publish a listing for the dataset, and share the listing with the suppliers. Analytics Hub enables zero-copy, real-time data sharing across organizations with central subscription management.
- Scaling View Management with Authorized Datasets: Use Configure the dataset containing the views as an authorized dataset on the central raw data dataset. Authorized datasets allow all views within a dataset to access source data automatically, simplifying management. (Avoid alternative: Granting direct access bypasses the logic and restrictions defined within the views.)
- Authorized Views for Aggregated Data Access: Use Create a view that aggregates the counts. Authorize the view to access the source dataset. Grant the researchers the BigQuery Data Viewer role on the view. Authorized Views allow users to query a view without having read access to the underlying tables, ensuring PII remains secure.
Key Takeaways (4.3b)
- Analytics Hub allows for secure, zero-copy data sharing across organizational boundaries.
- Zero-copy sharing ensures data is real-time and avoids storage duplication costs.
- Using Exchanges and Listings simplifies the management of subscriptions compared to manual IAM assignments.
- Exporting data (CSV/Files) removes the real-time benefit and creates governance issues.
Consideration 4.3c: Publishing reports and visualizations
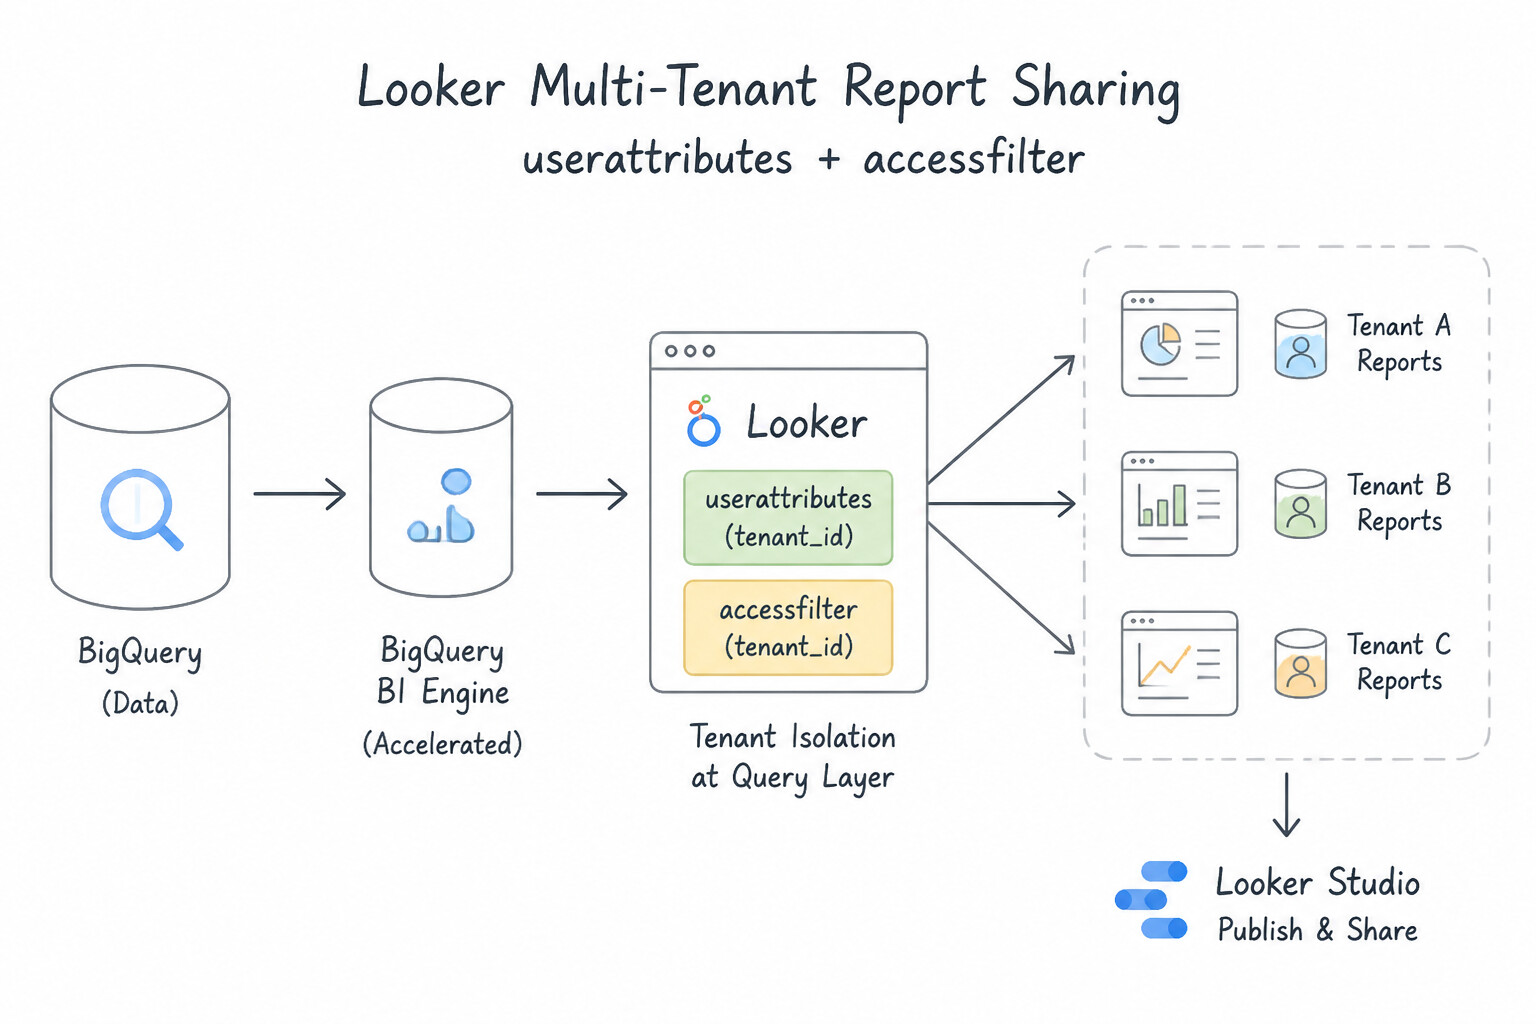
When business requirements call for sharing interactive dashboards or scheduled reports rather than raw SQL tables:
- Looker Multi-Tenant Report Sharing (
user_attributes+access_filter): - For external B2B portals or multi-department dashboards in Looker, assign a
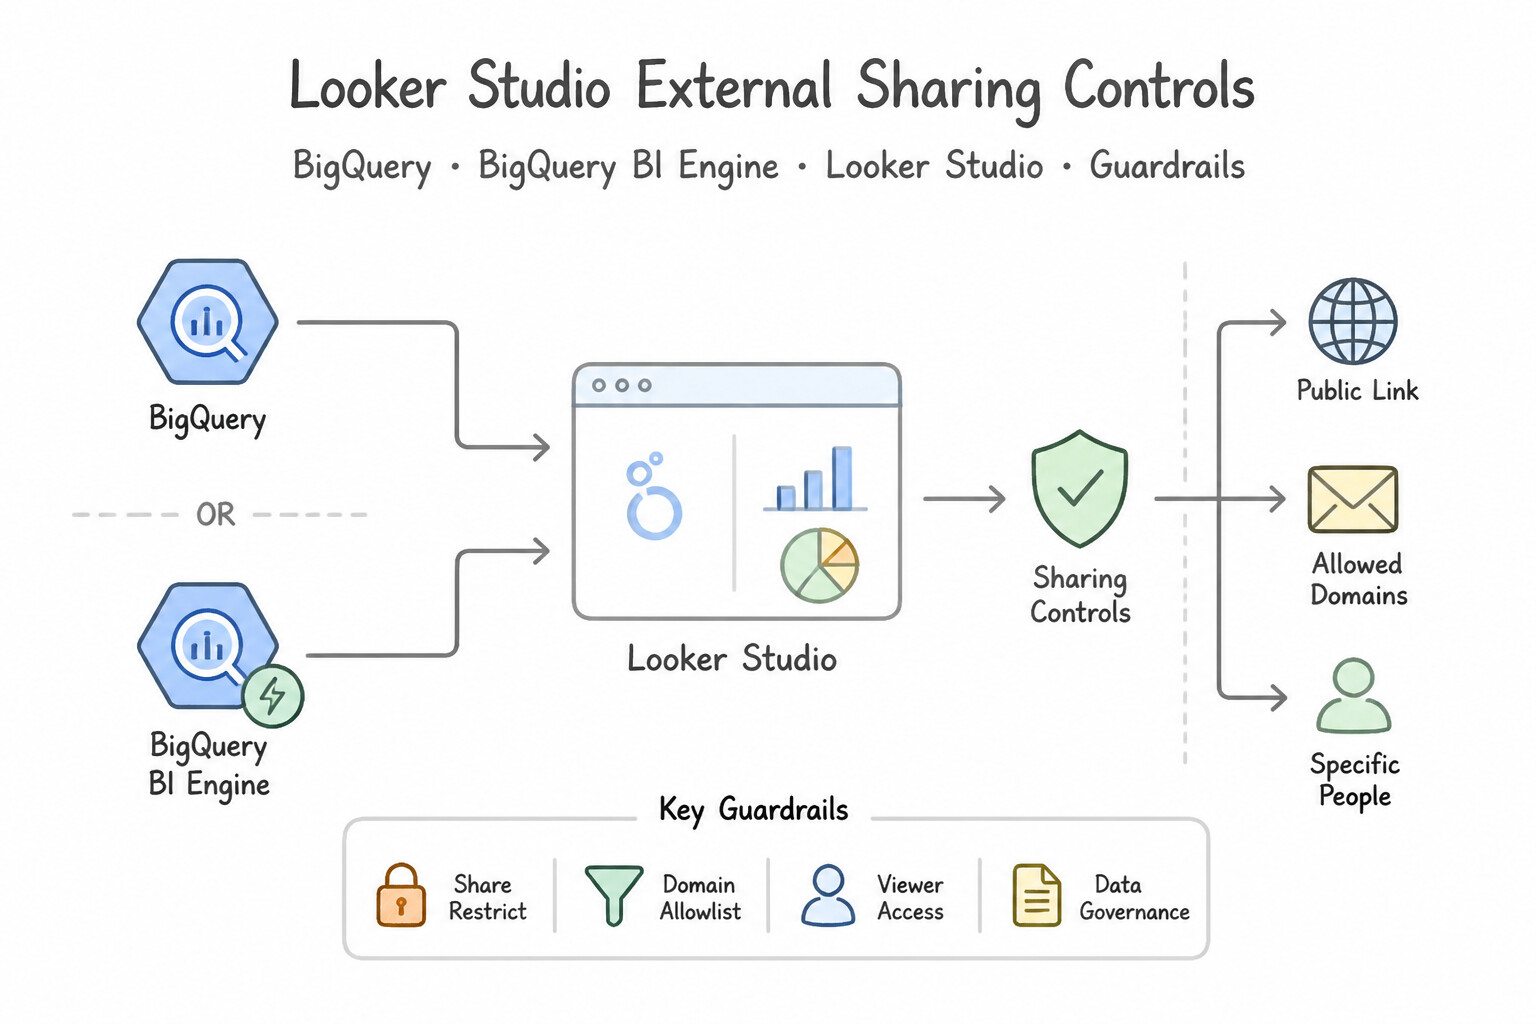
user_attribute(e.g.,customer_tenant_id) to each user's SSO session and bind it to anaccess_filterin the LookMLexploredefinition. Looker automatically injectsWHERE table.tenant_id = '<user_attribute>'into every generated SQL query cleanly and deterministically. - Looker Studio External Sharing Controls:
- Remember: If a Looker Studio report is shared externally using Owner's Credentials, external viewers can see whatever data the Owner has access to (unless filtered by report parameters, which can be manipulated in URLs if not locked). For strict per-viewer row isolation, use Viewer's Credentials + BigQuery
SESSION_USER(), or use Looker withaccess_filter.
Key Implementation Patterns
- Optimizing Dashboard Latency: Use Enable BigQuery BI Engine and reserve memory capacity for the project. BigQuery BI Engine caches data in memory to provide sub-second latency for high-concurrency dashboards like Looker Studio. (Avoid alternative: Moving data to Cloud Bigtable adds unnecessary complexity and migration effort compared to simply enabling BI Engine.)
- Secure Multi-Tenant Reporting: Use Define row-level access policies on the BigQuery table and configure the Looker Studio data source to use Viewer's Credentials. Viewer's Credentials pass the user's identity to BigQuery, enabling Row-Level Security policies to filter data dynamically.
Key Takeaways (4.3c)
- BI Engine is the primary tool for accelerating SQL/BI dashboards on BigQuery using in-memory caching.
- Use BI Engine when you need sub-second latency and high concurrency for reporting.
- Materialized Views improve performance by pre-computing queries to disk but are generally slower than in-memory caching for interactive BI.
- Avoid migrating data (e.g., to Bigtable) just for dashboard performance if a native accelerator like BI Engine is available.
Consideration 4.3d: BigQuery sharing (Analytics Hub)
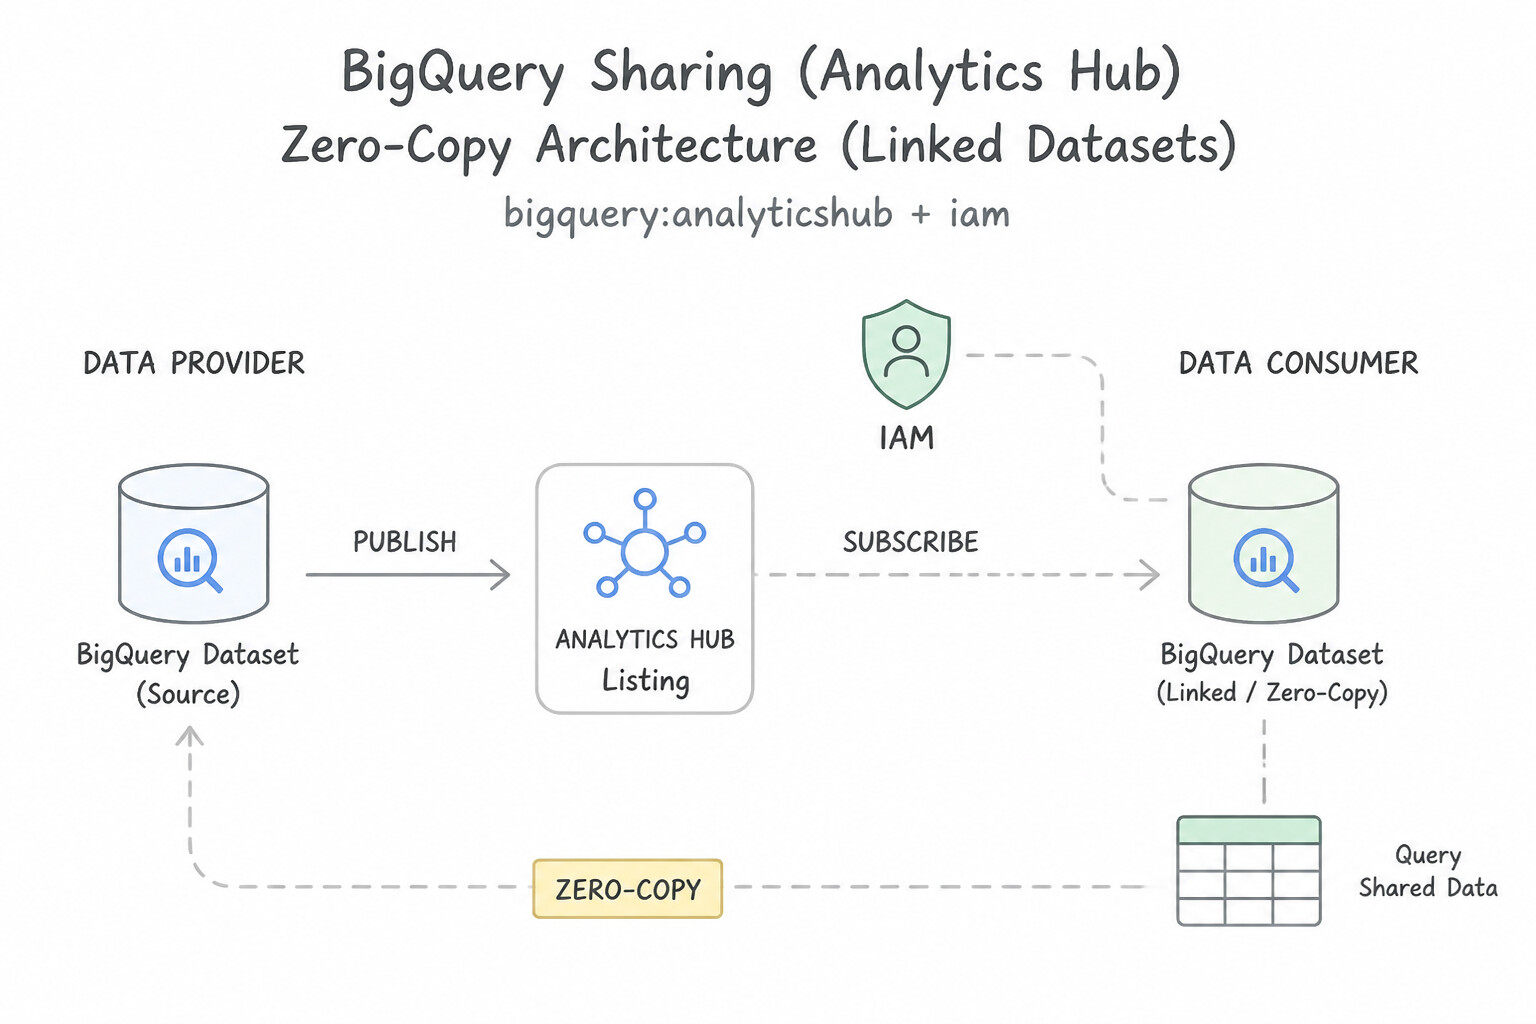
Memorize the exact mechanics and billing model of Analytics Hub:
- Zero-Copy Architecture (
Linked Datasets): - When a subscriber clicks "Add Dataset to Project" on an Analytics Hub Listing, BigQuery creates a Linked Dataset in the subscriber's project.
- A Linked Dataset is a read-only symbolic pointer to the publisher's dataset—zero data is copied or moved, and updates made by the publisher appear instantaneously to all subscribers.
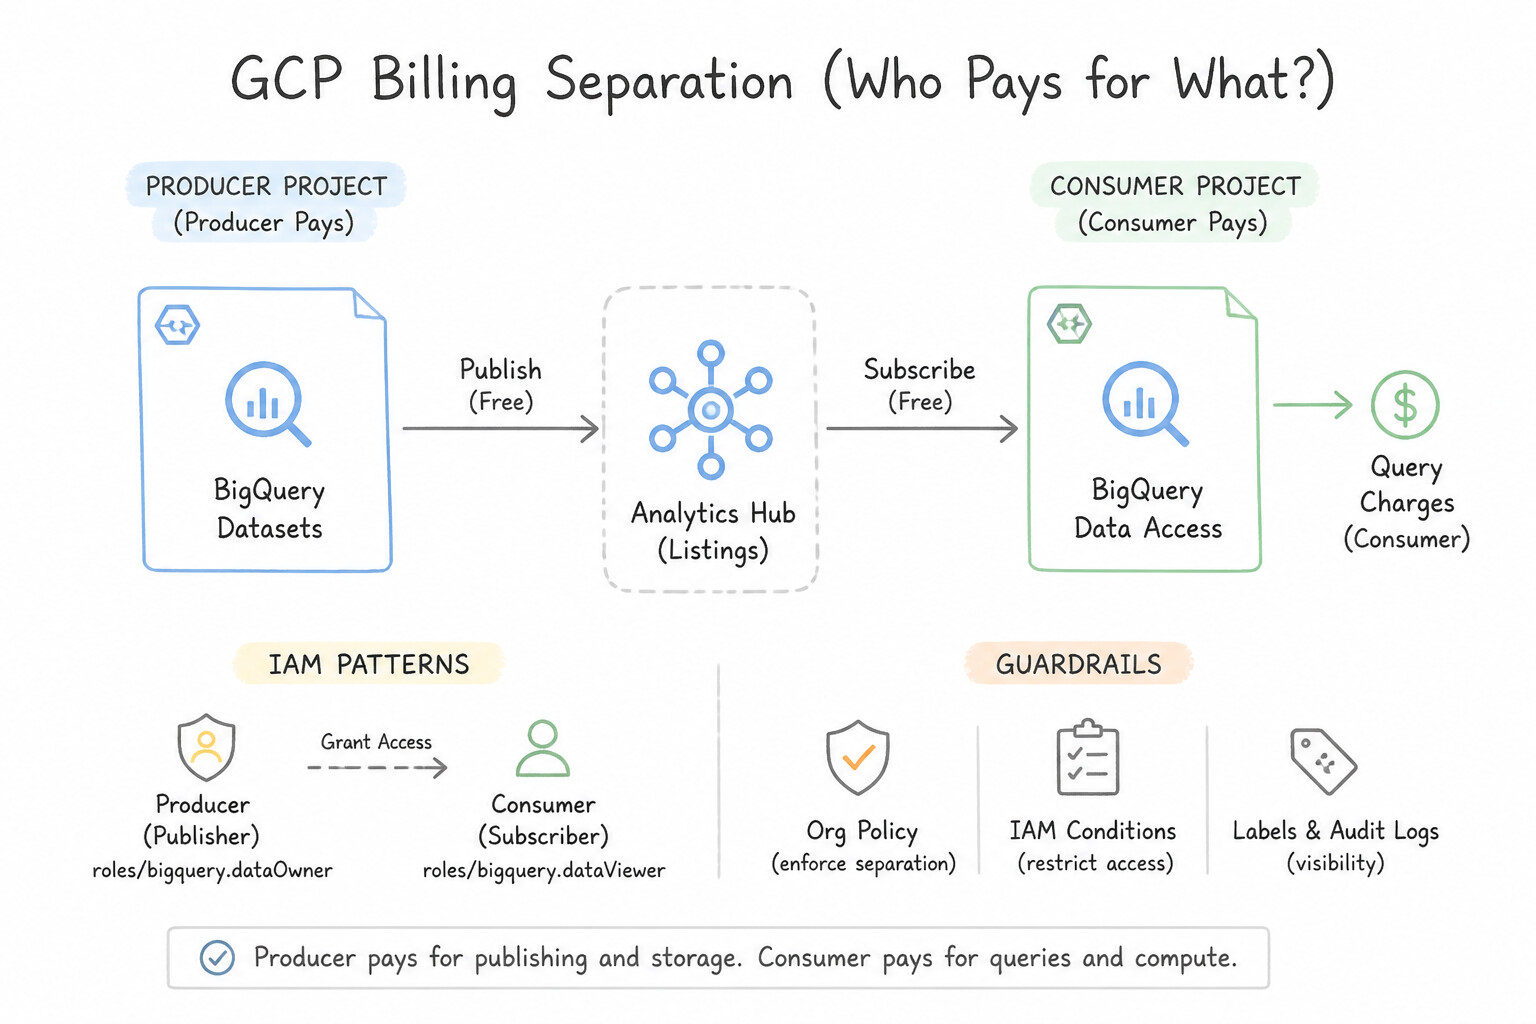
- Billing Separation (Who Pays for What?):
- Publisher pays only for the single copy of BigQuery storage in their source project.
- Subscriber pays for the BigQuery compute (slots / bytes scanned) consumed when running queries against the Linked Dataset in their own project!
- Analytics Hub Data Clean Rooms:
- Purpose-built environment in Analytics Hub where multiple parties (e.g., a Retailer and an Ad Publisher) can contribute datasets into a shared clean room and run privacy-centric overlap/attribution queries governed by Analysis Rules (preventing raw row egress and enforcing aggregation thresholds).
Key Implementation Patterns
- Secure Cross-Organizational Data Sharing: Use Create a Private Exchange in Analytics Hub. Publish a listing for the dataset and grant the partner the Subscriber role. Analytics Hub Private Exchanges allow secure, in-place data sharing across organizations without direct IAM grants on source resources.
- Data Latency in Linked Datasets: Use Tell them they will see the data immediately because the linked dataset queries the source directly. Linked datasets are symbolic links to the source, so data updates are visible in real time. (Avoid alternative: Analytics Hub does not use scheduled replication; access is live.)
- Granular Access Control for Listings: Use Grant the roles/analyticshub.subscriber IAM role to the 'HR-Analytics' group on the specific listing. Applying the Subscriber role at the listing level provides granular access control restricted to that specific dataset. (Avoid alternative: Granting permissions at the exchange level applies to all listings in that exchange.)
Key Takeaways (4.3d)
- Analytics Hub enables secure data sharing across organizational boundaries without data replication.
- Private Exchanges allow you to control exactly who can subscribe to your data listings.
- Subscribers access data via Linked Datasets, which are read-only views of the live source data.
- This method avoids managing external IAM users directly on your internal source projects.
Quick Decision Cheat Sheet (Subsection 4.3)
If the Scenario Requires... | Choose This Google Cloud Pattern | Avoid This Common Mistake |
|---|---|---|
"Zero-copy cross-organization BigQuery dataset sharing where subscribers pay for their own query compute" | BigQuery Analytics Hub ( Data Exchanges + Listings + Linked Datasets) | Cross-project bq cp jobs or granting external users roles/bigquery.jobUser inside your own production project |
"Multi-party data collaboration preventing row-level extraction and enforcing a minimum count of $K$ users per aggregated row" | Analytics Hub Data Clean Rooms with Aggregation Threshold / Differential Privacy policies | Sharing raw tables and asking partners to sign an NDA not to run SELECT * |
"Revoke an external partner's access to shared BigQuery data immediately when their subscription expires" | Revoke/delete their subscription on the Analytics Hub Listing | Asking the partner to delete the copied tables inside their own Google Cloud project |
Further Reading (Subsection 4.3)
- Creating authorized views — This official documentation page explains the concept of authorized views, how they differ from standard views regarding permissions, and provides the steps to create and authorize a view in BigQuery.
- Introduction to Analytics Hub — Overview of how Analytics Hub enables data exchanges and listings for cross-organization sharing.
- View and subscribe to listings and data exchanges — Documentation on how subscribers add a linked dataset to their project to access shared data.
- Introduction to BigQuery row-level security — Explains how row-level security works, when to use it, and provides examples of the syntax.
- Creating authorized datasets — This page explains how to authorize a dataset in BigQuery so that all views within it can access data in another dataset without individual configuration.
- Introduction to BigQuery BI Engine — Provides an overview of BI Engine, its architecture, and how it integrates with Looker Studio to provide fast, in-memory analysis.
Book TOC · Previous · Chapter 4 of 6 · Next
AwesomeGCP.com Learning
The approach taken is a question-led learning approach: you explore realistic project scenarios where you need to make decisions or take actions to achieve business goals within specific constraints. Instead of passive learning, you are challenged to think and work through the options to master the Professional Data Engineer (PDE) certification!