Book TOC · Previous · Chapter 4 of 6 · Next
Chapter 4: Database Observability, Query Insights, Performance Tuning, Cost Optimization & Automation
Chapter Focus: Query Insights, Spanner Lock/Transaction Introspection, Bigtable Key Visualizer, index/schema optimization, AlloyDB columnar engine, Memorystore read-through caching, CUDs, and zero-downtime maintenance.
Subsection 2.2: Configure database monitoring and troubleshooting options
The Big Picture
When a production database slows down at 2:00 AM, the amateur instinct is to double the instance vCPUs. Five minutes later, the bigger instance is also at 100% CPU—because the real culprit was a missing composite index triggering 500 concurrent full-table scans, an uncommitted idle transaction holding an exclusive row lock, or a monotonic row-key hotspot on a single Cloud Bigtable tablet! Subsection 2.2 tests your surgical command of Google Cloud's native diagnostic stack across all five considerations (2.2a through 2.2e):
- Slow Queries, Lock Waits & Missing Indexes (
2.2a&2.2d): In Cloud SQL and AlloyDB, Query Insights (paired withpg_stat_statements,pg_stat_activity,pg_locks, andEXPLAIN (ANALYZE, BUFFERS)) exposes the exact SQL query digests, wait events (LWLock,Lock,IO:DataFileRead), and even the originating microservice controller/route via SQL Commenter tags! In Cloud Spanner, you query the built-inSPANNER_SYSintrospection schemas (SPANNER_SYS.QUERY_STATS_TOP_MINUTE,LOCK_STATS_TOP_MINUTE,READ_STATS_TOP_MINUTE,TXN_STATS_TOP_MINUTE) and visual execution plans. In Cloud Bigtable, you open Key Visualizer heatmaps to spot bright horizontal lines indicating single-row or contiguous key-range hotspots. - Database Vitals & Storage/Memory Contention (
2.2b&2.2d): Correlating CPU, RAM (database/memory/utilization), Disk IOPS (database/disk/read_ops_count), replication lag (database/replication/replica_lag), and transaction ID wraparound age (pg_stat_database.datfrozenxid) in Cloud Monitoring tells you immediately whether a bottleneck is compute-bound, memory-swap-bound, I/O-throttled, or autovacuum-blocked. - Quota Exhaustion & Proactive Alerting (
2.2c&2.2e): Production outages frequently stem from silent quota ceilings—running out of regional SSD quota (SSD_TOTAL_GB), VPC peering connections, or concurrent Cloud SQL API operations—which must be monitored and alerted on via Cloud Monitoring Alerting Policies (using PromQL or MQL/threshold conditions) before an autoscaling or failover event fails.
Consideration 2.2a: Assess slow running queries and database locking; identify missing indexes
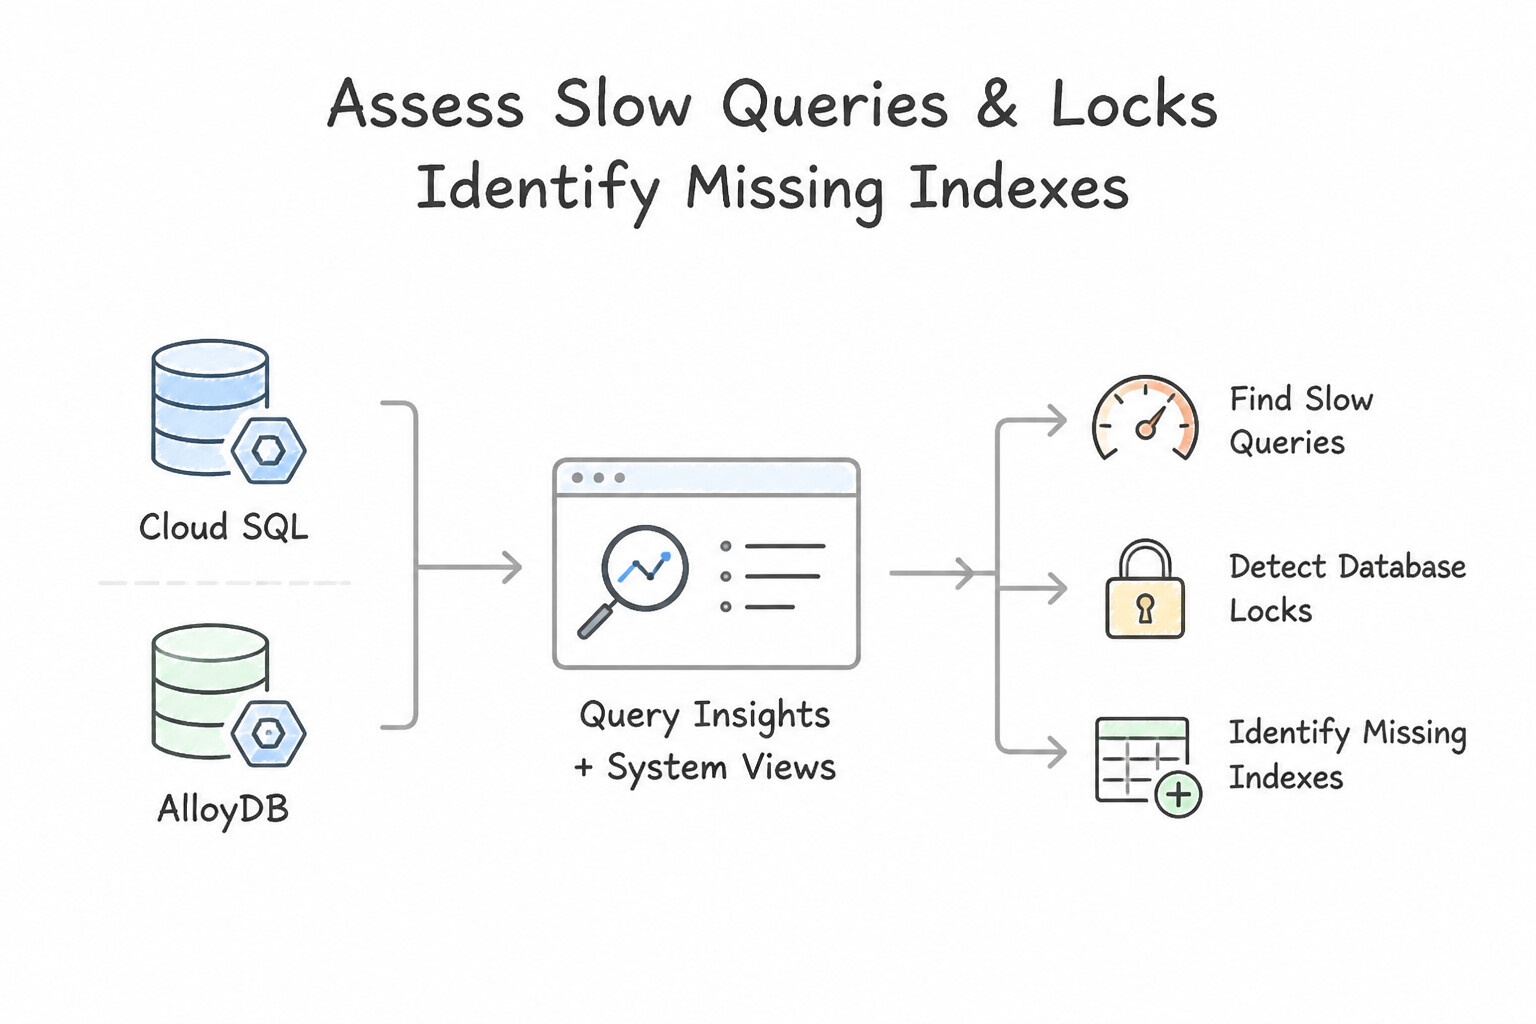
When a workload scenario requires how to diagnose slow queries or lock waits with minimal production impact:
- Cloud SQL & AlloyDB (
Query Insights+ System Views): - Query Insights is enabled by default on PostgreSQL/MySQL and uses low-overhead telemetry to display top queries by total execution time, average latency, CPU vs. I/O wait time, and Lock wait time. Pair it with SQL Commenter in your ORM so slow queries map directly to the application microservice, controller, and OpenTelemetry trace!
- PostgreSQL Live Diagnostics:
- Query
pg_stat_activity(wait_event_type = 'Lock',state = 'idle in transaction') joined withpg_locks(pg_blocking_pids(pid)) to identify the exact blocker session holding an uncommitted lock, and terminate it safely withpg_terminate_backend(pid)(or configureidle_in_transaction_session_timeoutandlock_timeout!). - Query
pg_stat_statementsto find queries with hightotal_exec_timeor low shared buffer hit ratios, and runEXPLAIN (ANALYZE, BUFFERS)to spotSeq Scan(Full Table Scan) where a B-Tree, composite, or partial index is missing. - In AlloyDB, run the built-in Index Advisor (
google_db_advisor), which automatically analyzes workload history and recommends specific indexes with estimated storage and latency improvements! - MySQL Diagnostics: Enable
slow_query_log = ON, setlong_query_time(e.g.,1or2seconds), enablelog_queries_not_using_indexes, and inspectperformance_schema.data_lock_waits/SHOW ENGINE INNODB STATUS. - Cloud Spanner Query & Lock Introspection (
SPANNER_SYS): - Query
SPANNER_SYS.QUERY_STATS_TOP_MINUTE(orTOP_10MINUTE/TOP_HOUR) to find high-latency SQL shapes. - Query
SPANNER_SYS.LOCK_STATS_TOP_MINUTEto identify the exact row key ranges (row_key_start) and columns experiencing heavy lock wait times (total_lock_wait_seconds), and switch reporting queries to Read-Only Transactions (which acquire zero locks in Spanner!).
Key Implementation Patterns
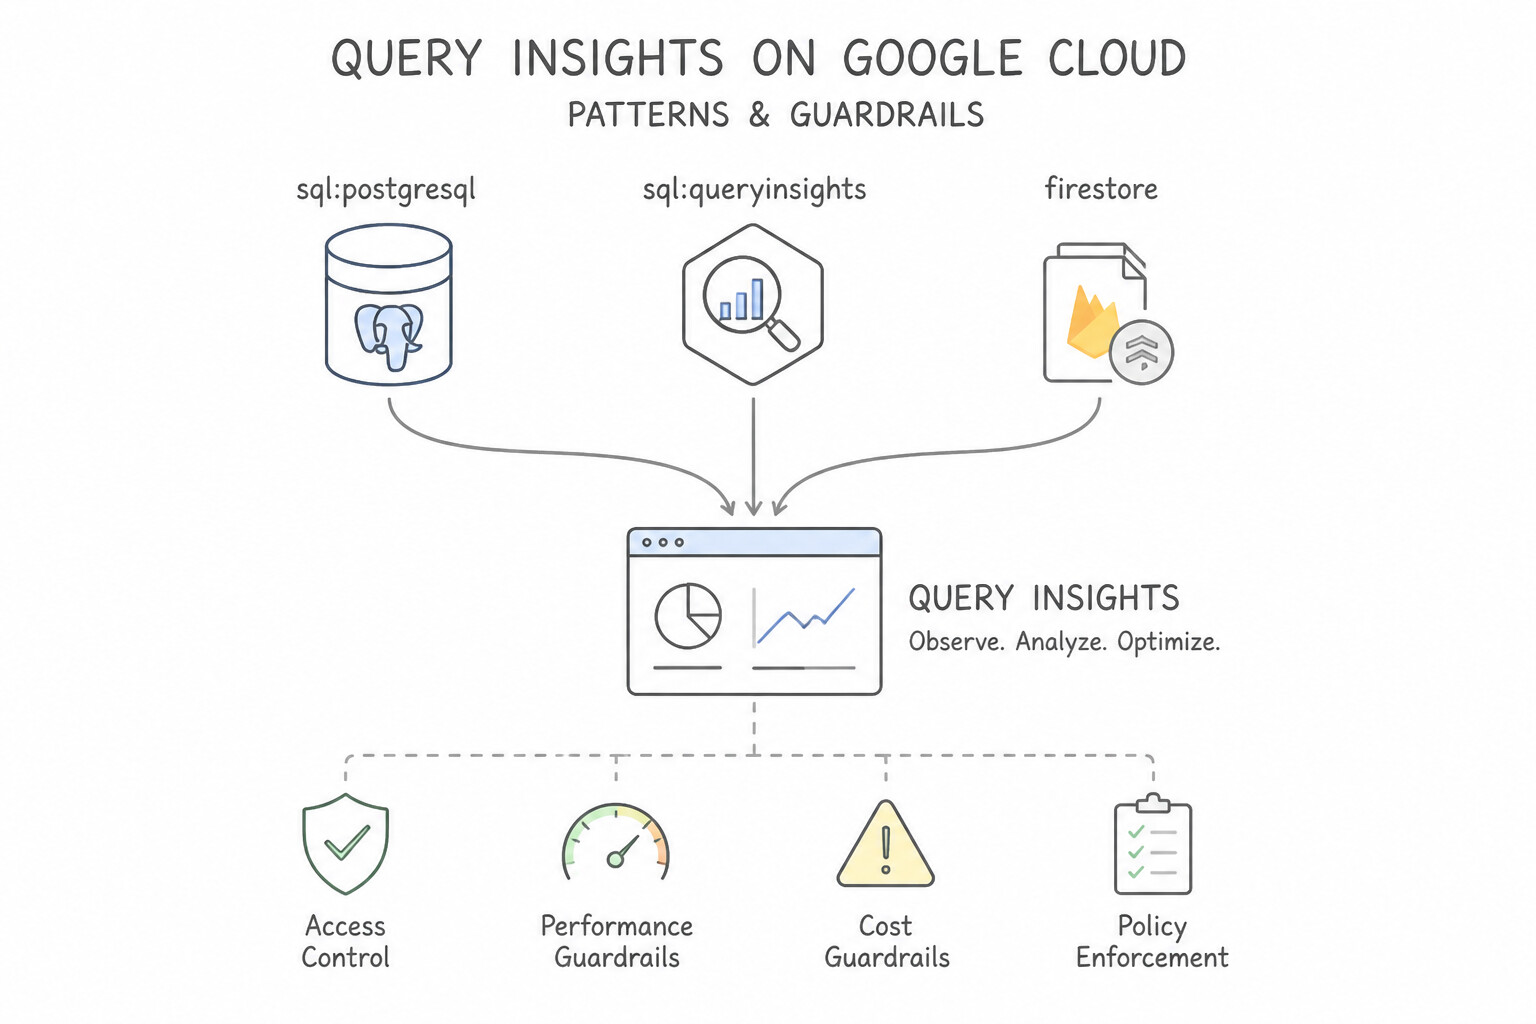
- Cloud SQL PostgreSQL - Query Insights: Use Use the Query Insights dashboard to identify the queries with the highest CPU load. Query Insights visualizes performance data and ranks queries by resource usage, making it the best tool to find high-load statements. (Avoid alternative: Restarting the database disrupts service and does not provide analysis on query performance or missing indexes.)
- Firestore - Composite Indexes: Use Follow the URL provided in the error message to create the required composite index. The error message URL directs you to the console with the specific composite index definition pre-filled for creation. (Avoid alternative: Single-field indexes are usually automatic and do not solve multi-field query requirements.)
- Cloud Spanner - Lock Statistics: Use Run a SQL query on the SPANNER_SYS.LOCK_STATS table. The SPANNER_SYS.LOCK_STATS introspection table provides details on lock conflicts and row ranges with high wait times. (Avoid alternative: SPANNER_SYS.QUERY_STATS is used for analyzing query CPU and latency performance, not lock contention.)
Key Takeaways (2.2a)
- High CPU usage in a database is often caused by inefficient SQL queries, such as those missing indexes.
- Query Insights is the primary native tool in Google Cloud for diagnosing query-level performance issues in Cloud SQL.
- Avoid blindly scaling resources (adding CPU/RAM) without first understanding the workload characteristics.
- Firestore requires composite indexes for queries that filter and sort on different fields.
Consideration 2.2b: Monitor and investigate database vitals – RAM, CPU, storage, I/O, and audit logging
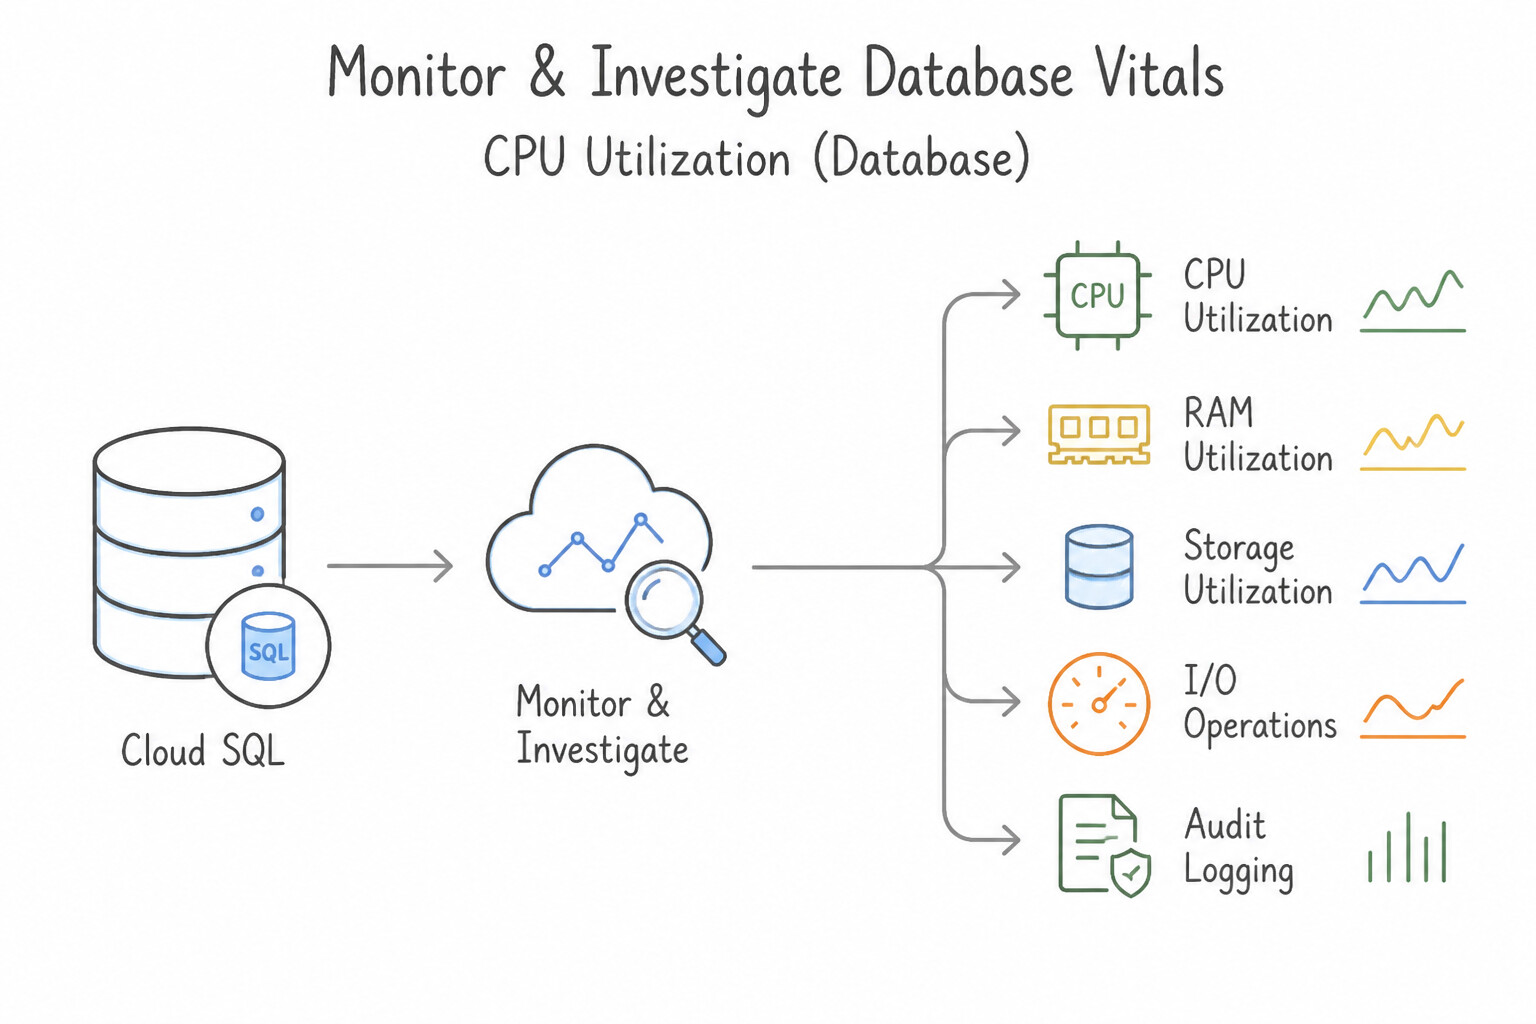
Know the exact Cloud Monitoring (cloudsql.googleapis.com, spanner.googleapis.com, bigtable.googleapis.com) metrics and log streams:
- CPU Utilization (
database/cpu/utilization): Sustained CPU >80% in Cloud SQL (or >65% regional / >45% multi-region in Spanner) indicates either under-provisioned compute or unindexed query scans (Seq Scan). - Memory Utilization (
database/memory/utilization): Approaching $90\%\text{--}100\%$ risks OS Out-Of-Memory (OOM) killer termination in PostgreSQL/MySQL. Check connection count (database/network/connections),work_mem/sort_buffer_size, and buffer pool sizing. - Storage & Disk I/O (
database/disk/utilization,read_ops_count,write_ops_count): HighIO Waitin Query Insights combined with flat-liningread_ops_count/write_ops_countat the Persistent Disk ceiling means the disk is IOPS-throttled (fix by increasing SSD GB, enabling Enterprise Plus Data Cache, or adding missing indexes). - Replication Lag (
database/replication/replica_lag): Measures how many seconds (or bytes) a read replica lags behind the primary. High lag is caused by single-threaded SQL replay bottlenecks (enable parallel replication in MySQL:slave_parallel_workers/replica_parallel_workers), under-sized replica CPU/IOPS, or massive bulk DML transactions on the primary.
Key Implementation Patterns
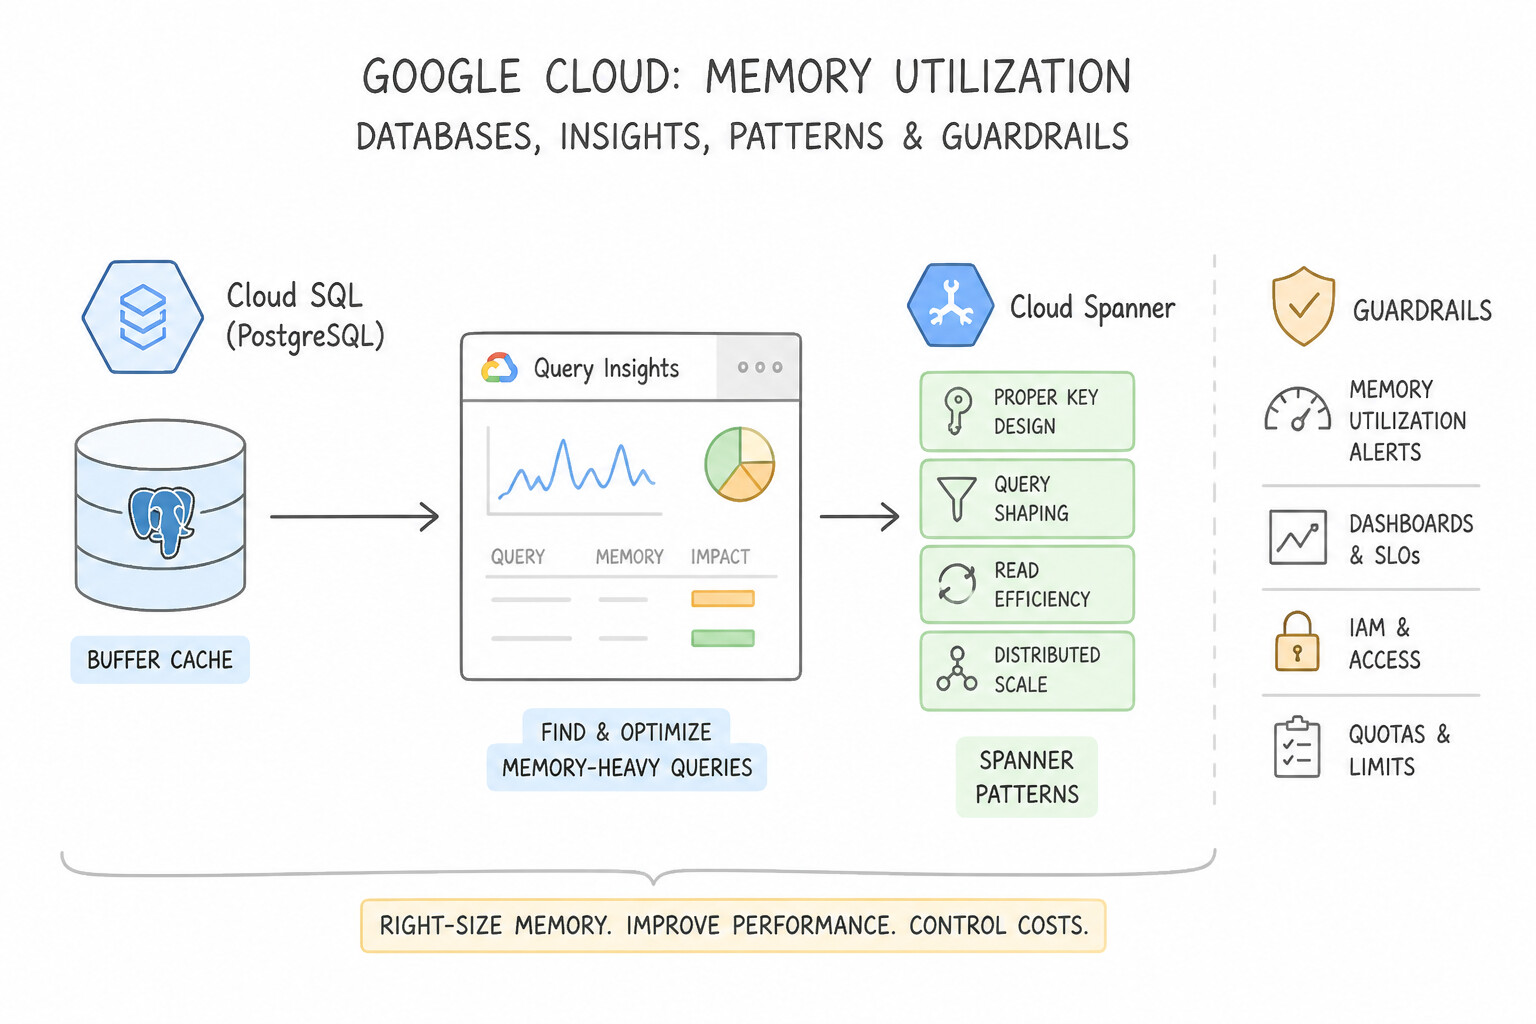
- Diagnosing Latency with Query Insights: Use Open the Query Insights dashboard in the Google Cloud console. Filter the Query load by CPU to view the normalized queries. Query Insights is the native tool for visualizing and analyzing Cloud SQL query performance and resource usage.
- Cloud Spanner Hotspotting Diagnosis: Use Use the Key Visualizer tool to scan for bright bands in the heatmap. Key Visualizer generates heatmaps to identify hotspots (bright bands) where traffic is unevenly concentrated on specific keys. (Avoid alternative: Storage utilization monitors capacity, not the performance distribution or specific row access patterns causing latency.)
Key Takeaways (2.2b)
- High CPU usage in a database often indicates inefficient queries, such as full table scans or missing indexes.
- Cloud Monitoring provides high-level resource metrics, but Query Insights provides application-level query details.
- Always prefer built-in diagnostic tools (like Query Insights) over manual log parsing for initial troubleshooting.
- Low overall CPU with high latency often indicates a hotspot (uneven load).
Consideration 2.2c: Monitor and update quotas
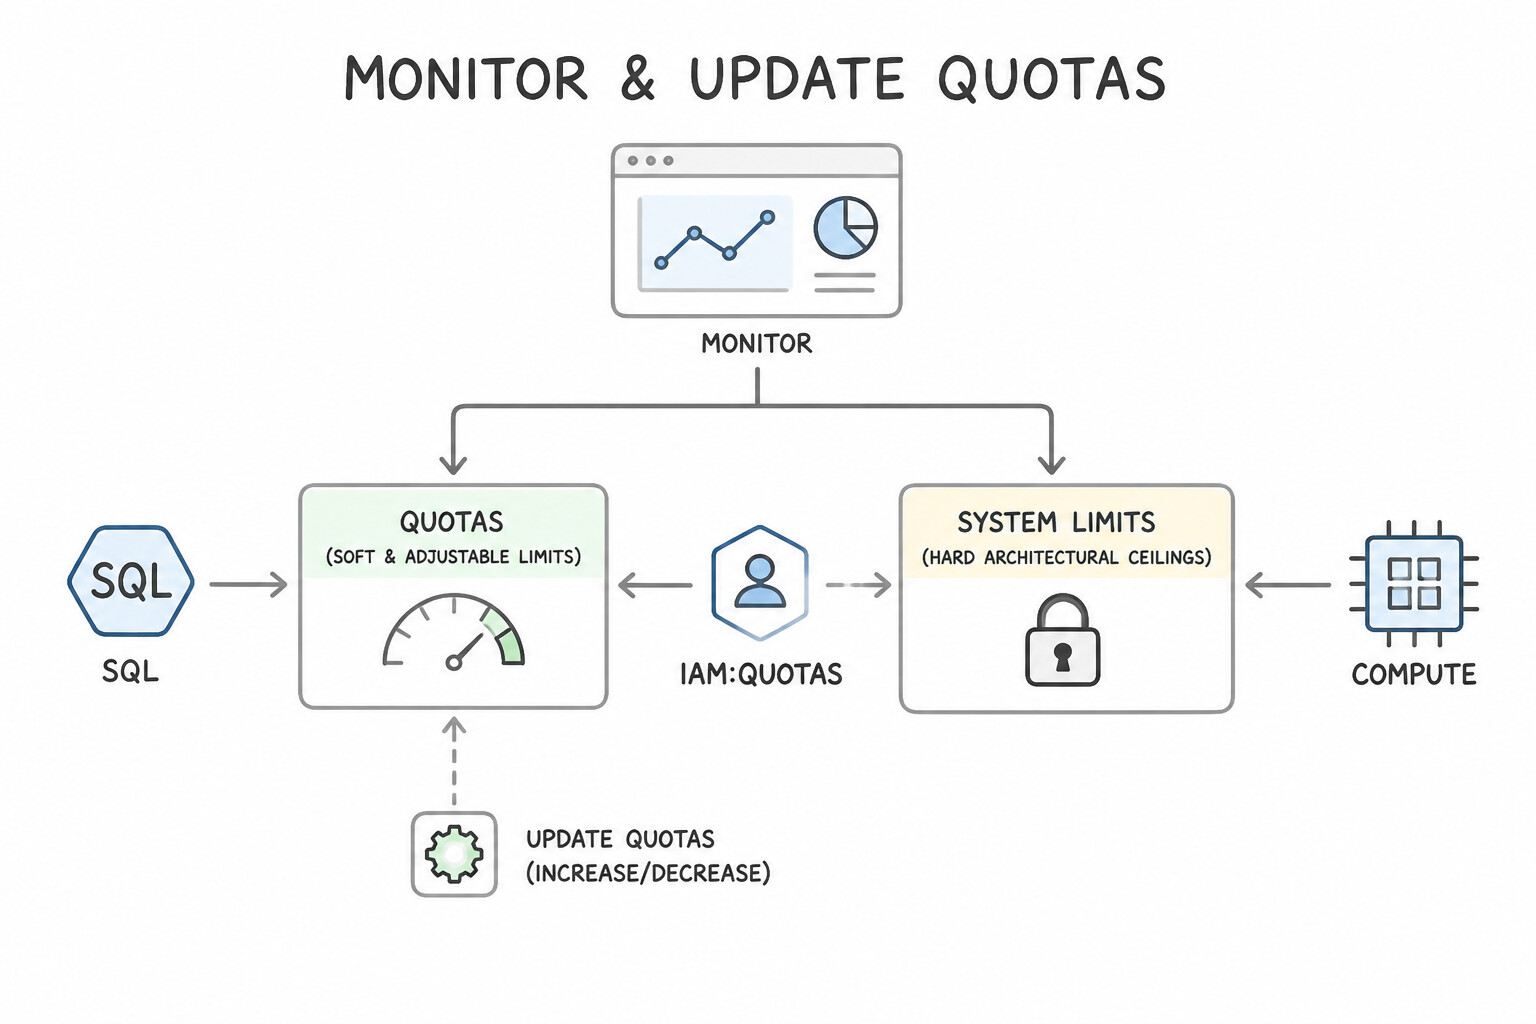
Google Cloud enforces two distinct categories of limits—and confusing them is a common configuration mistake:
- Quotas (Soft / Adjustable Limits) vs. System Limits (Hard Architectural Ceilings):
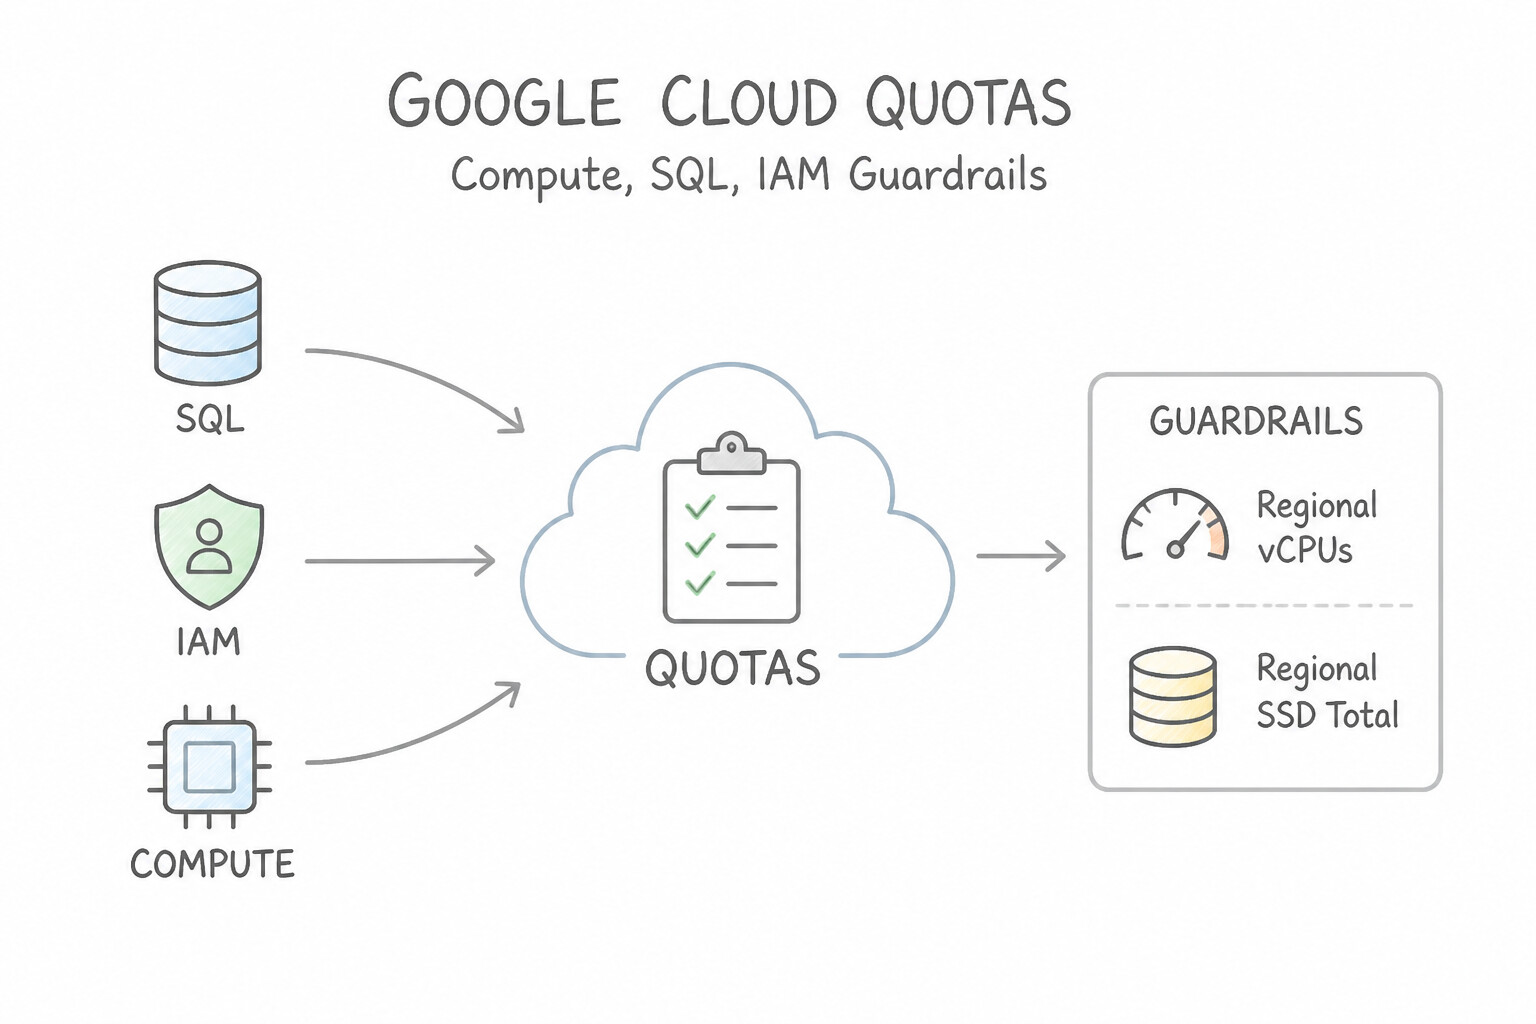
- Quotas (e.g., Regional vCPUs, Regional SSD Total GB, Concurrent VPC Peering / PSC connections, Spanner nodes per region, API requests per minute) protect against runaway billing or regional exhaustion and can be increased via the Cloud Quotas (
IAM & Admin → Quotas) console or Cloud Quotas API. - System Limits (e.g., max 64 TB / 128 TB storage on a single Cloud SQL instance, max 100 MB row size in Bigtable, max 10,000 mutations per Spanner commit) are fixed architectural boundaries that cannot be raised by a quota request—they require architectural changes (sharding, archiving, or moving to Spanner/Bigtable).
- Proactive Quota Alerting: Create a Cloud Monitoring Alerting Policy on
serviceruntime.googleapis.com/quota/allocation/usagecompared againstquota/limit(e.g., trigger an alert when any regional CPU or SSD quota exceeds $80\%$ utilization) so you can request quota increases before a DR failover or autoscaling event is blocked!
Key Implementation Patterns
- Identifying Resource Exhaustion Errors: Use Request a quota increase for CPUs in the us-central1 region from the IAM & Admin console. The error confirms a hard quota limit has been reached; you must request a quota increase via the Google Cloud console to proceed. (Avoid alternative: The scenario explicitly states billing is active, and the error code points to resource counts, not payment status.)
- Requesting Quota Increases for Migration: Use Navigate to IAM & Admin > Quotas in the Google Cloud Console and request a quota increase. You must manually request higher quotas via the IAM & Admin > Quotas page for large capacity requirements. (Avoid alternative: Committed Use Discounts affect billing rates, not technical resource quotas.)
- Proactive Quota Alerting with Cloud Monitoring: Use Create an alerting policy. Select the Consumer Quota resource and the serviceruntime.googleapis.com/quota/allocation/usage metric. Filter for the Cloud Spanner node quota. The
serviceruntimemetrics are specifically designed to monitor resource quotas and limits across Google Cloud services.
Key Takeaways (2.2c)
- 429 RESOURCE_EXHAUSTED indicates a quota limit has been reached.
- Quotas are often regional; a limit in
us-central1does not affectus-east1.- The primary fix for quota errors is to request an increase via the IAM & Admin console.
- Billing status and Quota limits are separate concepts; active billing does not disable default quotas.
Consideration 2.2d: Investigate database resource contention
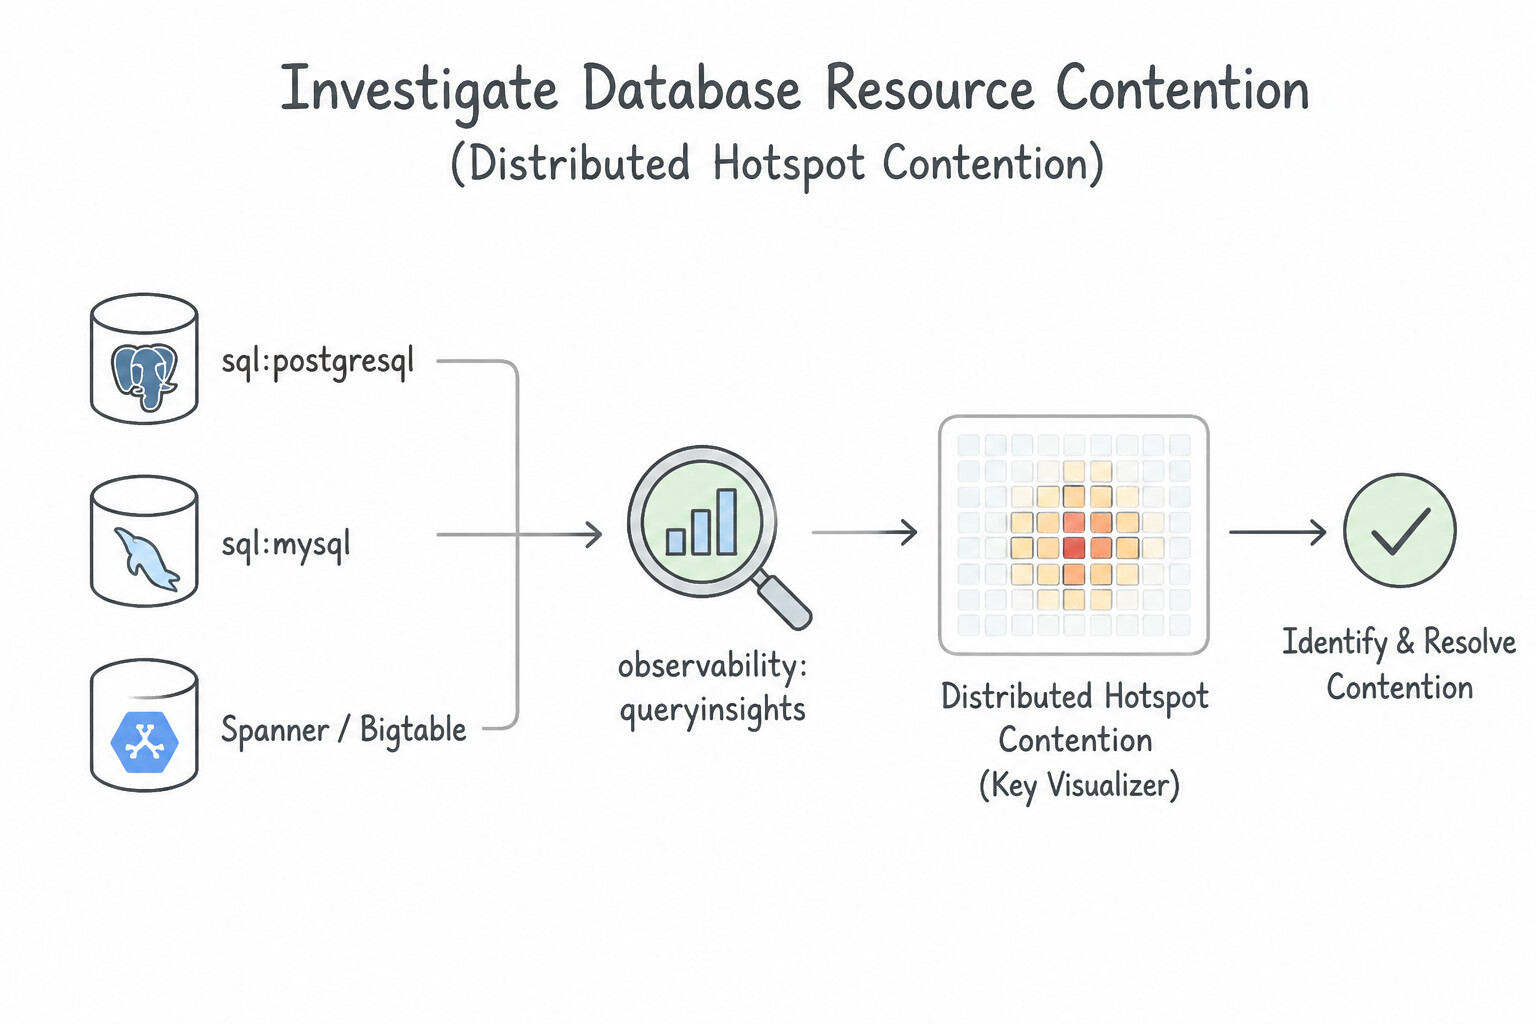
Resource contention occurs when concurrent workloads compete for the same internal database subsystem (locks, key ranges, CPU threads, or I/O):
- Distributed Hotspot Contention (
Spanner&BigtableKey Visualizer): - If average cluster CPU is low ($25\%$), yet write or read tail latency (
p99) spikes dramatically and times out, you have a Keyspace Hotspot—all traffic is hitting a single Cloud Spanner split or a single Cloud Bigtable tablet node! - Open Key Visualizer in the Google Cloud Console: a bright yellow/orange horizontal band at the top or bottom of the keyspace heatmap confirms a monotonic key hotspot (e.g.,
TIMESTAMPprefix or sequential ID). Note: adding more nodes will NOT fix a single-row or monotonic tail hotspot because a single lexicographical tail split/tablet still lives on 1 node! You must fix the key design (hash prefix, bit reversal, or composite key swap). - Read-Write Lock Contention (
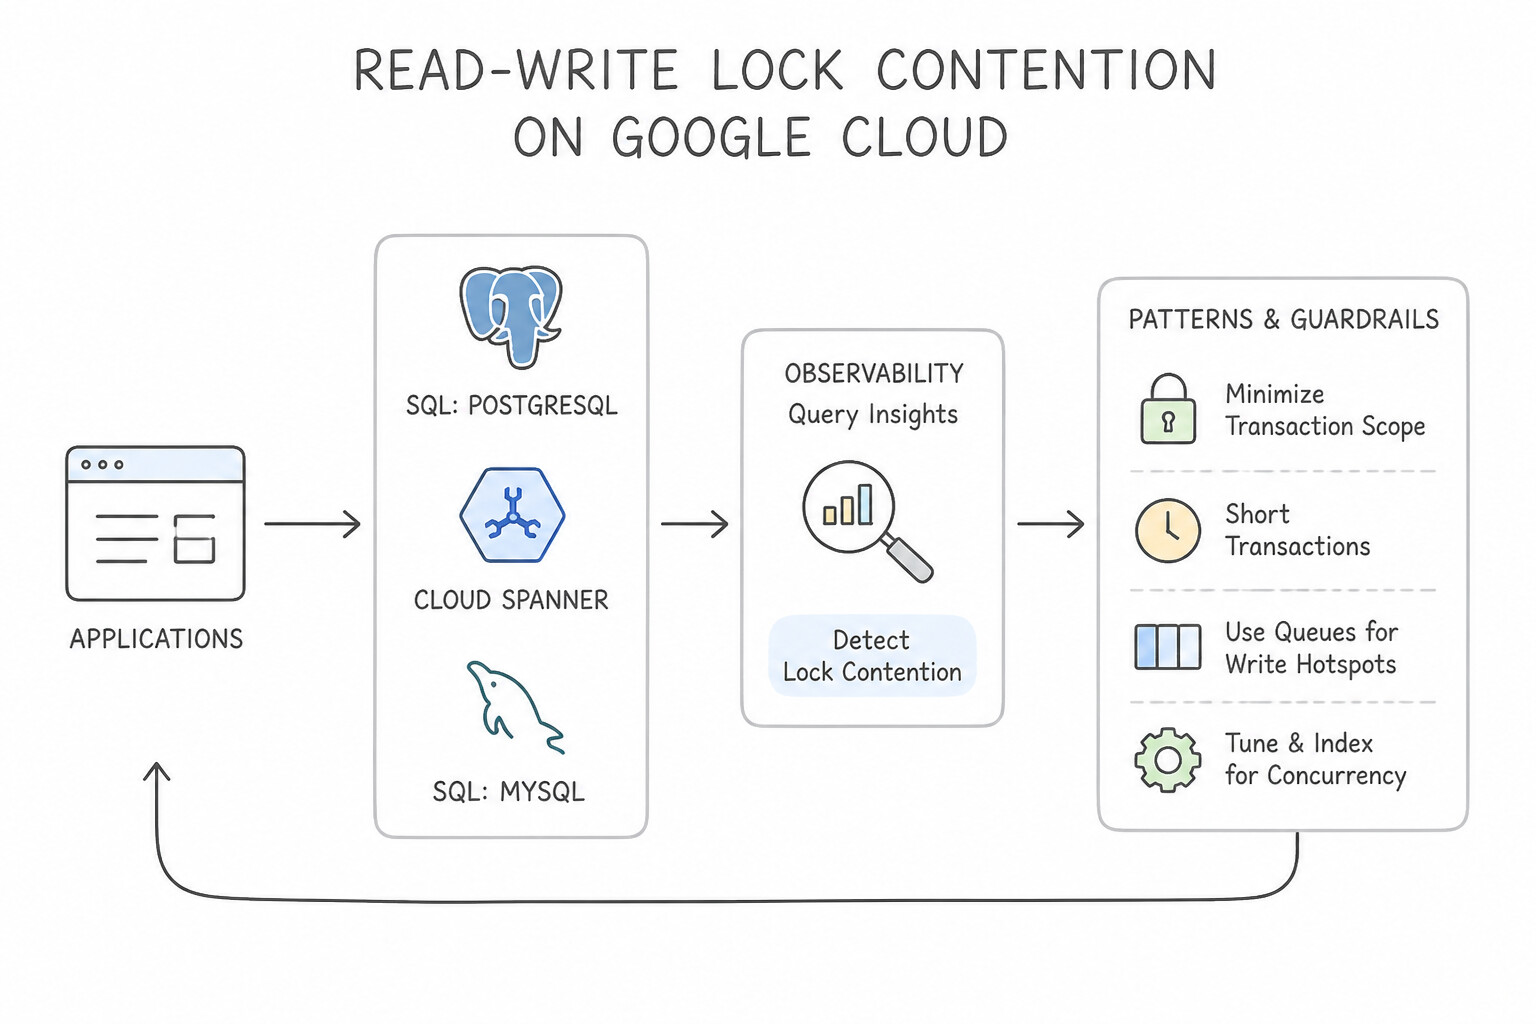
Spanner&PostgreSQL): - In Cloud Spanner, running long analytical queries inside a Read-Write Transaction acquires shared locks across millions of rows, blocking concurrent OLTP writes! Always execute analytical and point-in-time reads using Read-Only Transactions (or strong/bounded-staleness single reads), which leverage Spanner's Multi-Version Concurrency Control (MVCC) and TrueTime to read consistently with zero locks.
- In PostgreSQL, running
CREATE INDEXon a live production table acquires aSHARElock that blocks allINSERT,UPDATE, andDELETEoperations until indexing finishes. Always runCREATE INDEX CONCURRENTLYin production!
Key Implementation Patterns
- Cloud SQL PostgreSQL Lock Contention: Use Use Query Insights to examine the 'Database Load - Wait by Wait Event' graph for lock contention. Low CPU with high connections suggests threads are waiting, not working. Query Insights visualizes wait events to identify locks. (Avoid alternative: Connection pooling optimizes connection management but does not fix transaction logic causing lock contention.)
- Cloud SQL MySQL IOPS Throttling: Use Increase the storage capacity of the Cloud SQL instance. IOPS performance in Cloud SQL scales with disk size; increasing storage increases the IOPS limit. (Avoid alternative: The scenario identifies an IOPS bottleneck, not a CPU bottleneck; adding CPUs won't resolve disk throttling.)
Key Takeaways (2.2d)
- Low CPU with high latency or stacking connections usually indicates wait events (locks, I/O), not compute shortages.
- Query Insights in Cloud SQL provides a 'Wait by Wait Event' view to diagnose these bottlenecks.
- Scaling CPU (vertical scaling) does not fix lock contention issues.
- Cloud SQL IOPS performance scales linearly with provisioned storage capacity (disk size).
Consideration 2.2e: Set up alerts for errors and performance metrics
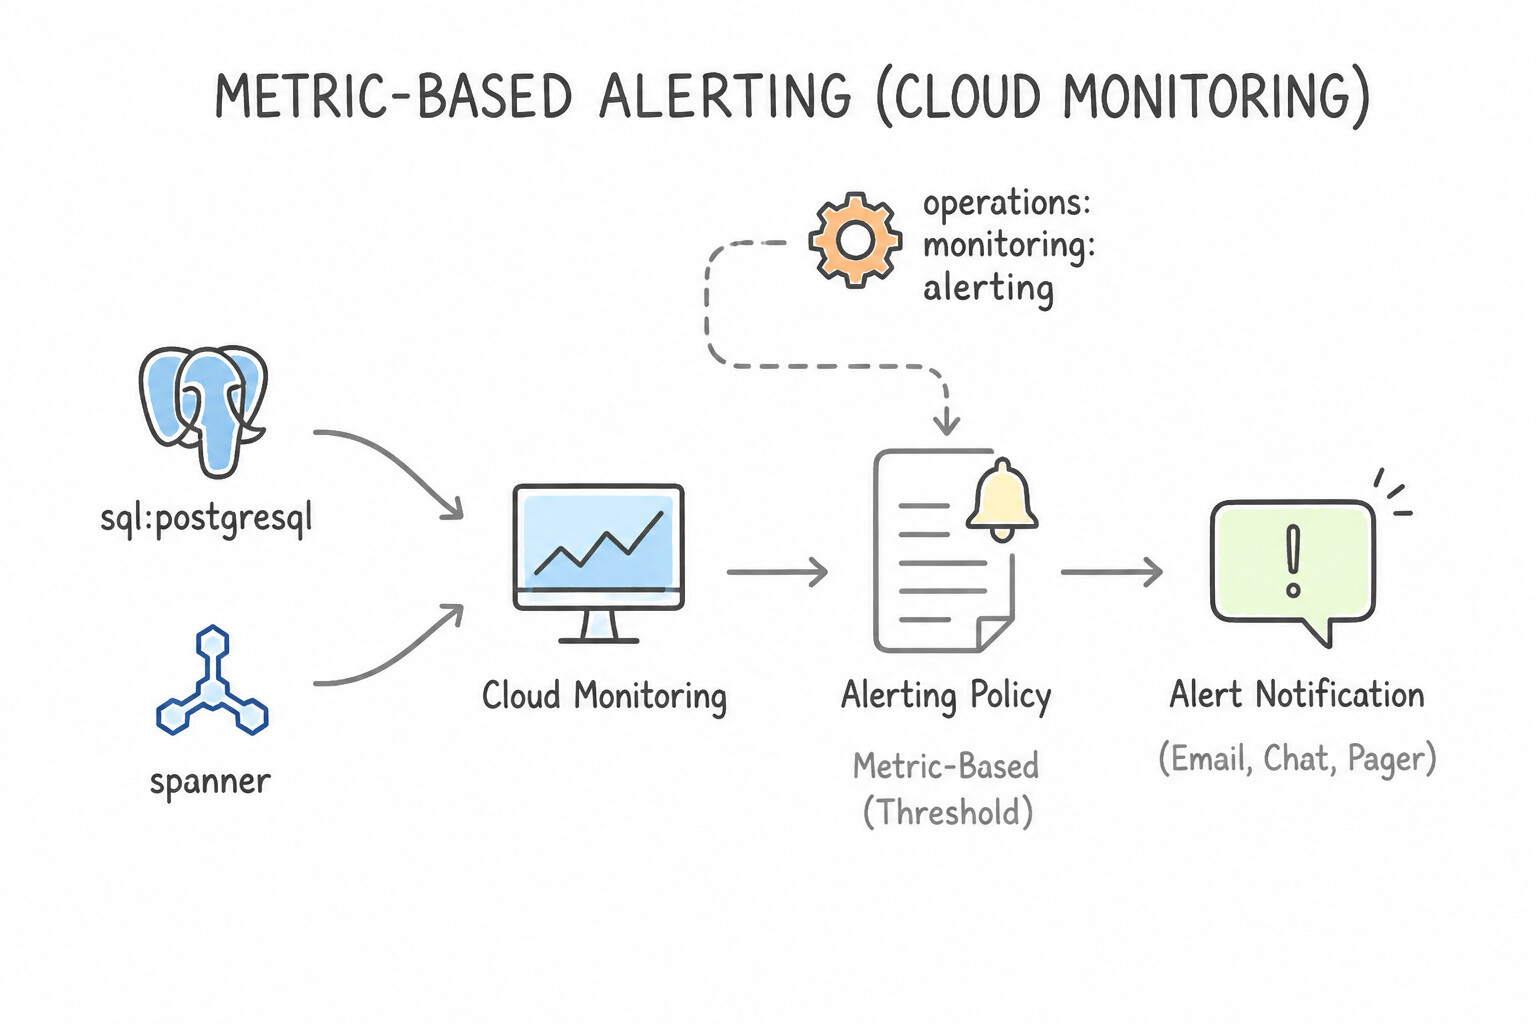
An effective database alerting architecture eliminates alert fatigue while catching actionable degradation early:
- Metric-Based Alerting Policies (Cloud Monitoring):
- Configure Sustained Duration Windows (e.g., CPU >85% for 5 or 10 consecutive minutes, rather than instantaneous 1-second spikes) and Multi-Condition Policies to avoid noisy false alarms.
- Essential golden database alerts: High CPU utilization, Memory >90%, Disk Utilization >85%, Replica Lag > target RPO threshold, Connection count >80% of
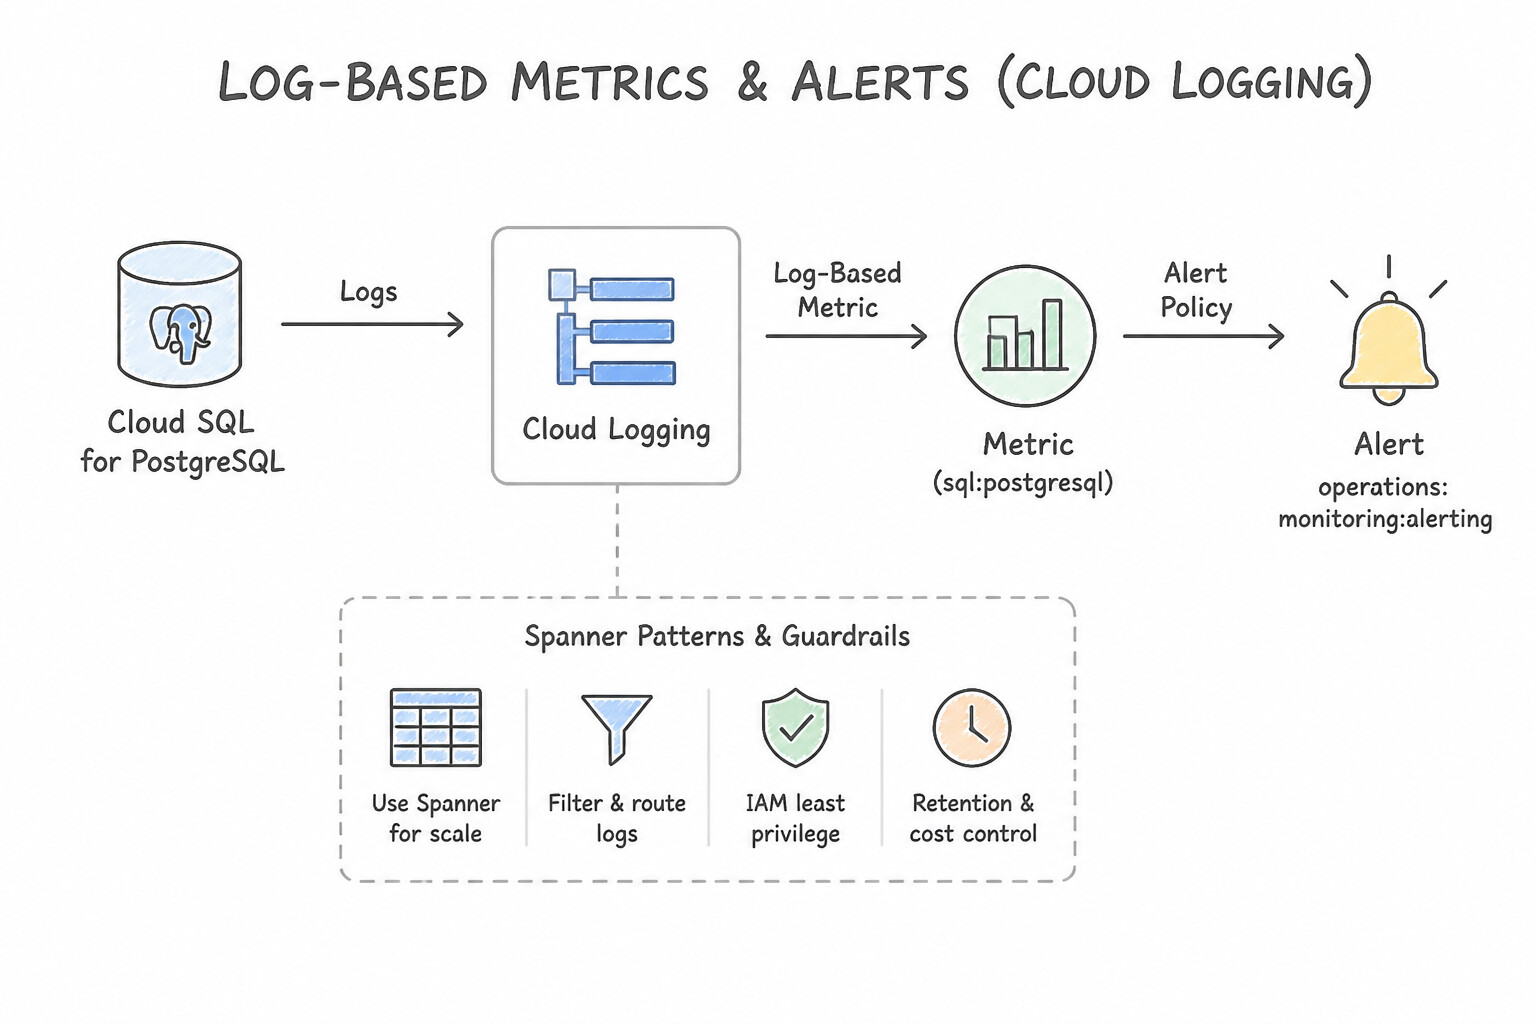
max_connections, and Spanner 99th-percentile latency. - Log-Based Metrics & Log-Based Alerts (Cloud Logging):
- Some critical database failures appear in error logs (
postgres.log/mysql.err) rather than time-series metrics—such asdeadlock detected,FATAL: remaining connection slots are reserved,ERROR: canceling statement due to lock timeout, orCMEK key disabled. - Create a Log-Based Metric (to count occurrences of deadlock/error regexes over time on dashboards) or a Log-Based Alert to notify on-call teams via PagerDuty, Slack, Webhook, Email, or Pub/Sub immediately when critical error patterns appear.
Key Implementation Patterns
- Cloud SQL Storage Capacity Alerting: Use Create a Cloud Monitoring alert policy for the database/disk/utilization metric with a threshold above 80%. Monitoring disk utilization percentage ensures you are alerted when the disk is nearly full, regardless of the total provisioned capacity.
- Cloud Spanner High Priority CPU Alerting: Use Create an alerting policy based on the high priority CPU utilization metric. High priority CPU utilization measures user-facing load and excludes background system tasks, making it the correct metric for scaling decisions based on user traffic.
- Log-Based Alerts for Specific Error Codes: Use Create a log-based metric in Cloud Logging that filters for the deadlock error string. Create an alert policy in Cloud Monitoring based on this metric. Use a log-based metric to count specific text patterns in logs, then alert on that count.
Key Takeaways (2.2e)
- Use
database/disk/utilizationfor capacity alerting to handle dynamic disk sizes effectively.- Auto-storage increase helps scale but requires monitoring to catch rapid growth or hard limit constraints.
- Proactive alerting prevents outages caused by 'disk full' errors.
- Cloud Spanner separates CPU metrics into Total and High Priority categories.
Quick Decision Cheat Sheet (Subsection 2.2)
If the Scenario Requires... | Choose This Google Cloud Pattern | Avoid This Common Mistake |
|---|---|---|
"Identify which sessions are blocking other queries in PostgreSQL and automatically prevent hung transactions" | Query pg_stat_activity + pg_locks (pg_blocking_pids) and set idle_in_transaction_session_timeout & lock_timeout | Restarting the entire Cloud SQL instance every time a lock occurs |
"Diagnose top lock-wait row keys and slow queries in Cloud Spanner" | Query SPANNER_SYS.LOCK_STATS_TOP_MINUTE and SPANNER_SYS.QUERY_STATS_TOP_MINUTE | Enabling pgAudit or searching Cloud Audit Admin Activity logs for lock stats |
"Visualize uneven keyspace access or row-key hotspots in Cloud Bigtable or Cloud Spanner" | Open Key Visualizer in the Google Cloud Console | Relying solely on average cluster CPU utilization |
"Alert on-call DBAs whenever PostgreSQL logs deadlock detected or out of memory" | Create a Log-Based Alert (or Log-Based Metric + Alerting Policy) on postgres.log in Cloud Logging | Polling pg_stat_statements (which only tracks completed SQL statements, not deadlocks or OOM crashes) |
"Prevent regional SSD or vCPU limits from blocking an upcoming database expansion" | Monitor serviceruntime.googleapis.com/quota/allocation/usage in Cloud Monitoring and request a quota increase via Cloud Quotas | Submitting a request to increase a hard System Limit (like Bigtable's 100 MB single-row limit) |
Further Reading (Subsection 2.2)
- Use Query Insights to improve query performance — This page explains how to enable and use Query Insights to detect performance problems, including identifying top queries by load and filtering by database or user.
- Managing Indexes in Cloud Firestore — Explains the difference between single-field and composite indexes and how to create them using console links.
- Introspection tools - Lock statistics — Documentation on how to use the LOCK_STATS table to investigate lock conflicts in Cloud Spanner.
- Key Visualizer overview — This page explains what Key Visualizer is, how it works, and how to interpret the heatmaps to find performance issues like hotspots.
- Schema design best practices — Review the section on primary keys to understand why monotonically increasing values cause hotspots.
- Work with quotas — This page explains how to view and manage quotas in the Google Cloud console, including how to request a higher quota limit.
Subsection 2.4: Optimize database cost and performance in Google Cloud
The Big Picture
Subsection 2.4 sits at the heart of day-2 database engineering: how to make databases simultaneously faster and cheaper. In production, unoptimized database fleets bleed money and miss latency SLAs for three recurring reasons:
- Confusing Vertical Scaling (
Scale Up) with Horizontal Scaling (Scale Out) (2.4a,2.4b,2.4c): Scaling a Cloud SQL instance from 16 to 64 vCPUs (Vertical Scaling) requires an instance restart (causing brief downtime) and hits a hard single-node ceiling. If 85% of your workload consists of read queries or reporting dashboards, Horizontal Read Scaling (Scale Out)—via Cloud SQL Read Replicas behind an internal load balancer / ProxySQL, AlloyDB elastic Read Pools, or Memorystore for Redis caching—absorbs the read surge with zero primary downtime. And if write throughput outgrows a single relational node entirely, you must move to Cloud Spanner (or Cloud Bigtable for NoSQL), where adding nodes or Spanner Managed Autoscaler scales both reads and writes linearly with zero downtime. - Replication Topology Bottlenecks (2.4c): When a primary Cloud SQL instance attempts to replicate directly to 10+ cross-region read replicas, the primary's network egress and CPU saturate shipping WAL/binlog streams to every replica. Introducing Cascading Read Replicas (where the primary replicates to 1 relay replica in a target region, and that replica fans out to downstream replicas in that region) offloads primary CPU and slashes cross-region network egress costs!
- Anti-Pattern Schemas & Unoptimized Queries (
2.4d,2.4e): No amount of autoscaling can rescue a Cloud Spanner table that uses an auto-incrementing integer primary key, a Firestore collection that indexes every single large string array field unnecessarily, or a relational query that omits a Covering Index (INCLUDE/STORING) and forces millions of random heap/table lookups on every request.
Consideration 2.4a: Assess scaling up and scaling out options
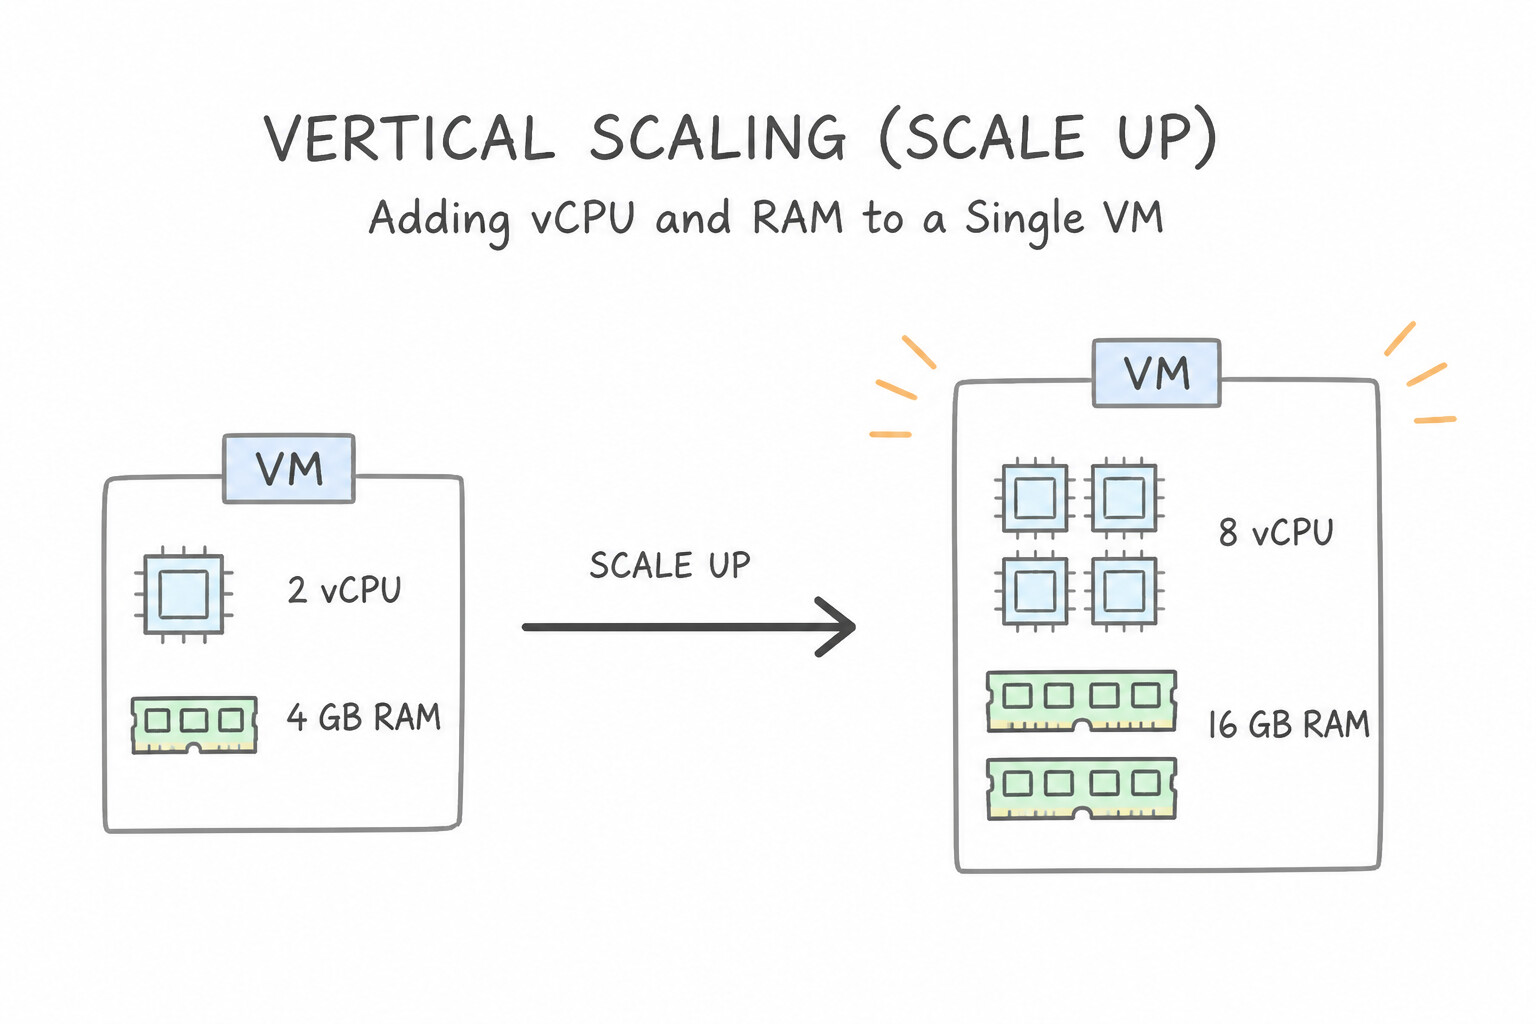
Every PDBE scaling question hinges on two constraints: Can the workload tolerate a brief restart? and Is the bottleneck on Writes or Reads?
- Vertical Scaling (
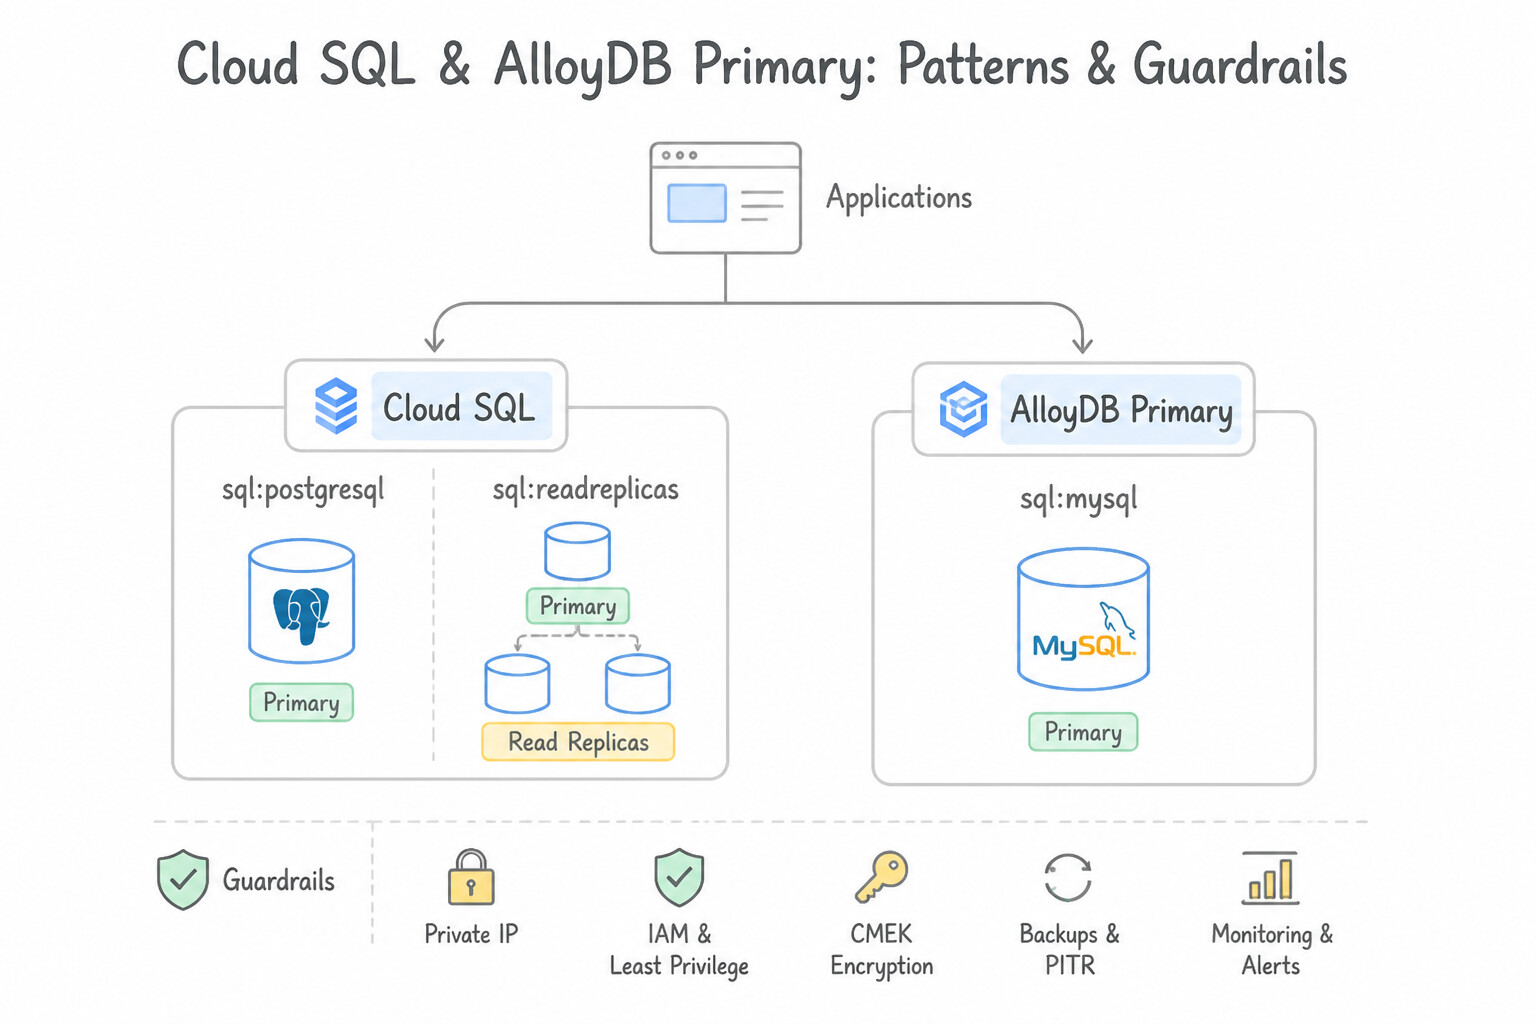
Scale Up— Adding vCPU / RAM to a Single Node): - Cloud SQL & AlloyDB Primary: Changing the machine type (
vCPU/RAM) on a Cloud SQL instance requires a restart (typically 1–3 minutes of downtime); in AlloyDB, vertical scaling of the primary switches over to the active standby for minimal disruption. - Vertical scaling increases single-node write capacity, buffer pool RAM, and network/disk IOPS caps, but is bounded by the maximum machine size (96–128 vCPUs).
- Horizontal Scaling (
Scale Out— Adding Replicas, Read Pool Nodes, or Shards/Splits): - Cloud SQL Read Replicas & AlloyDB Read Pools: Offload read-only queries with zero downtime to the primary. Note that in AlloyDB, a Read Pool provides a single unified load-balanced endpoint across up to 20 read nodes that can scale in/out elastically without updating application connection strings!
- Cloud Spanner & Cloud Bigtable: Scale both reads and writes horizontally with zero downtime simply by adding Nodes / Processing Units (Spanner) or Cluster Nodes (Bigtable).
Key Implementation Patterns
- Handling Read-Heavy Traffic in Cloud SQL: Use Create read replicas and configure the application to direct read traffic to them. Read replicas allow you to scale out read operations (SELECT queries) and offload traffic from the primary instance. (Avoid alternative: Vertical scaling is unnecessary because the primary CPU usage is normal, and it requires downtime.)
- Cloud SQL Throughput vs. Disk Size: Use Increase the storage capacity of the Cloud SQL instance. IOPS performance in Cloud SQL scales with disk size; increasing storage capacity increases available IOPS. (Avoid alternative: CPU upgrades do not resolve disk IOPS bottlenecks when CPU usage is already low.)
- Cloud Spanner CPU Utilization Management: Use Increase the compute capacity by provisioning more nodes or processing units. Spanner scales horizontally; adding nodes or processing units reduces CPU utilization by distributing load. (Avoid alternative: Spanner handles sharding automatically; manual application-layer sharding is unnecessary and complex.)
Key Takeaways (2.4a)
- Scale Up (Vertical) when the primary instance is resource-constrained (high CPU/RAM) or needs to handle larger write loads.
- Scale Out (Horizontal) using Read Replicas when the workload is read-heavy and you need to offload SELECT queries.
- High Availability (HA) is for redundancy and failover, not for performance scaling or load balancing read traffic.
- Cloud SQL IOPS performance scales linearly with provisioned disk size.
Consideration 2.4b: Scale database instances based on current and upcoming workload
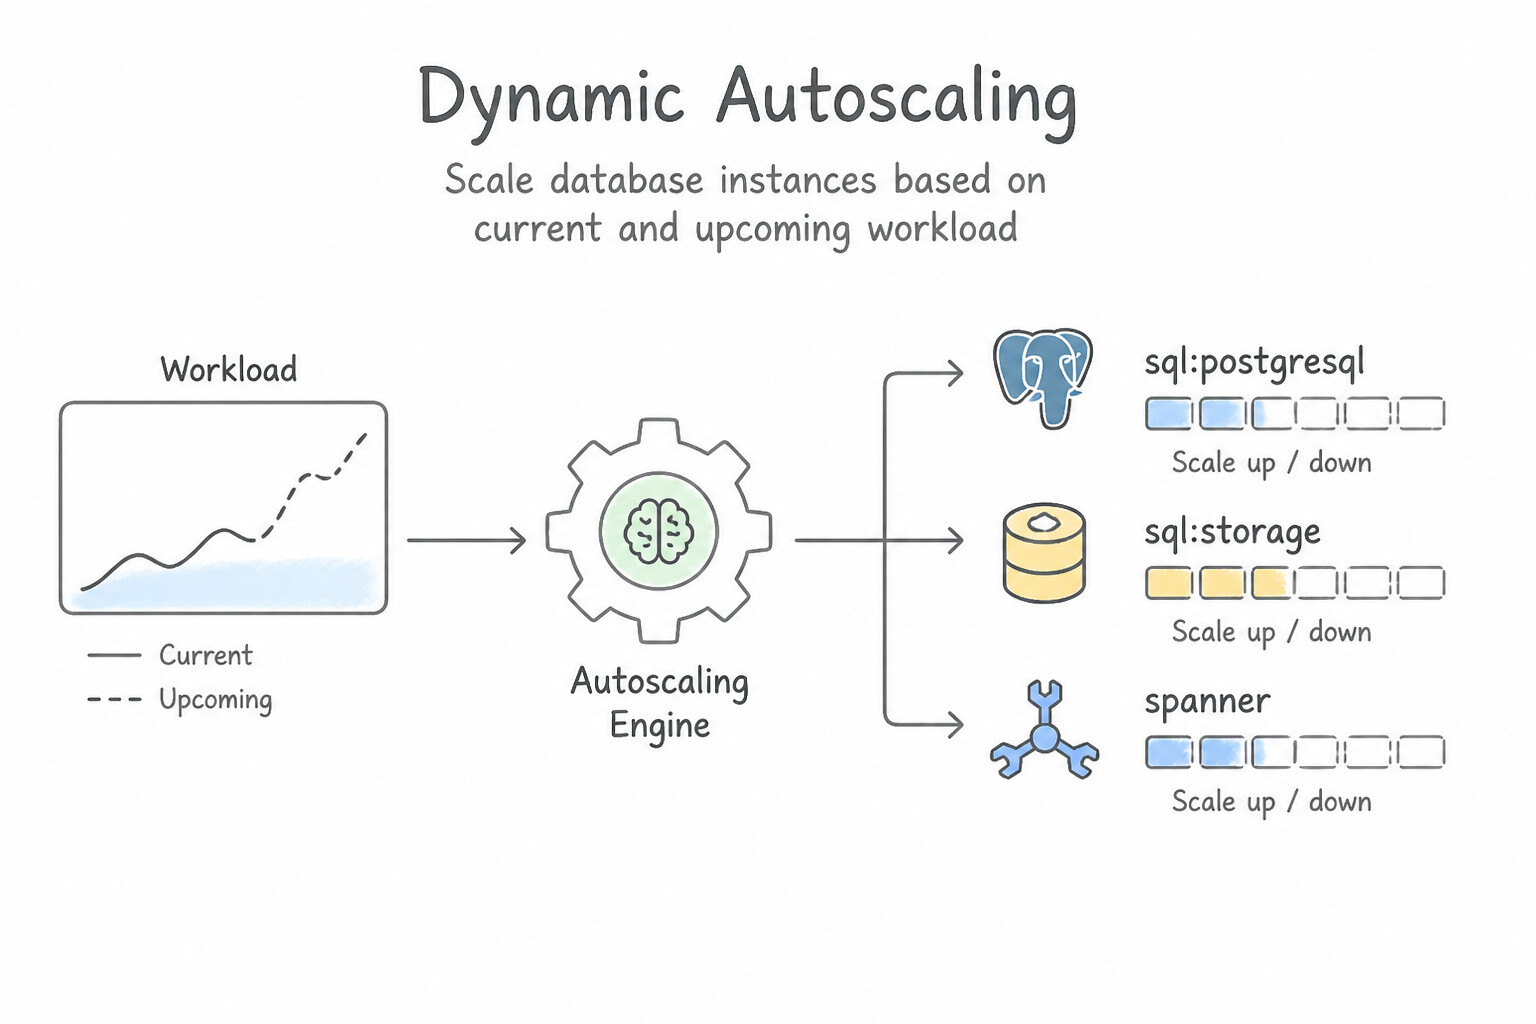
Match the scaling automation to whether the traffic surge is predictable (scheduled) or unpredictable (dynamic):
- Dynamic Autoscaling:
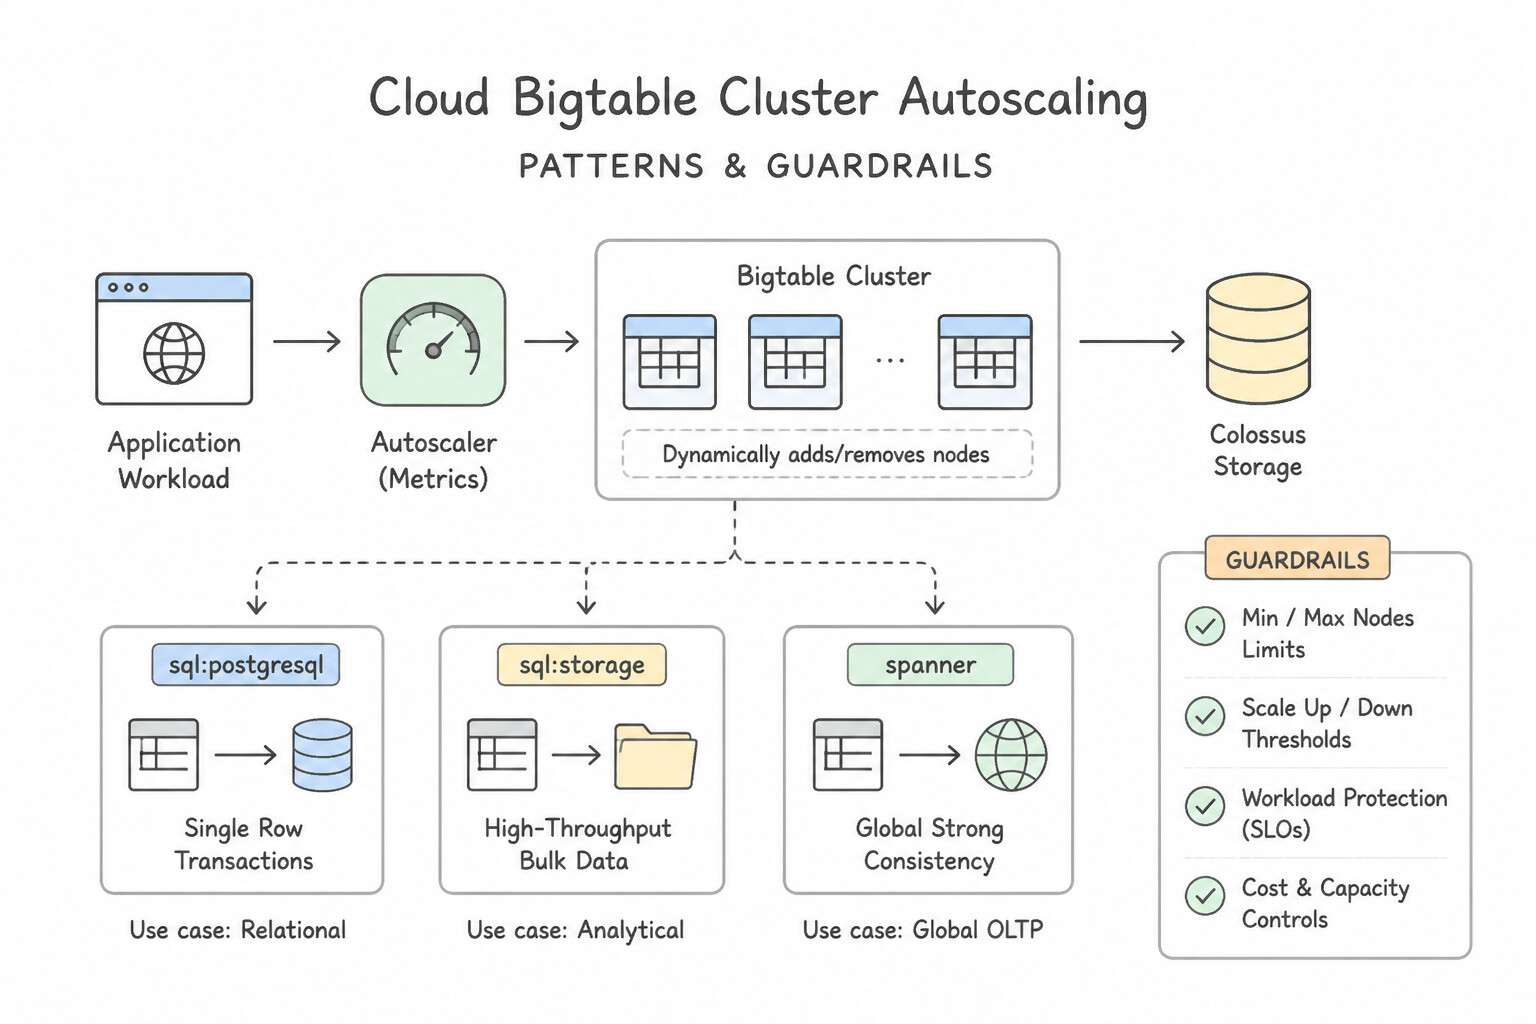
- Cloud Bigtable Cluster Autoscaling: Native built-in autoscaler that dynamically adds/removes nodes between
min_nodesandmax_nodesbased on CPU utilization target (e.g., $65\%) and **Storage utilization target** (\le 70\%$ on SSD). - Cloud Spanner Managed Autoscaler: Built-in autoscaling (configured by
min_processing_units/max_processing_units,high_priority_cpu_target, andstorage_target) that scales Spanner capacity up and down automatically (including Asymmetric Autoscaling where individual read-only regions scale independently!). - Pre-Warming for Predictable Flash Events (Black Friday / Ticket Drops):
- In Cloud Spanner and Cloud Bigtable, data splits/tablets take several minutes to hours to rebalance across newly added nodes! If a 10x traffic spike hits in 30 seconds, reactive autoscaling may not rebalance splits fast enough. Always pre-scale (scale out nodes 1–2 hours before a known flash sale) so splits are already balanced when the spike arrives!
- For Cloud SQL, schedule vertical scaling during a pre-event maintenance window or pre-provision Read Replicas + Memorystore for Redis before the marketing campaign launches.
Key Implementation Patterns
- Cloud SQL Storage Auto-scaling: Use Enable automatic storage increase in the Cloud SQL instance settings. Automatic storage increase is a built-in feature that adds disk capacity on demand without downtime. (Avoid alternative: Custom scripts are less reliable and require more maintenance than the native automatic storage increase feature.)
- Cloud Spanner Granular Scaling: Use Update the instance compute capacity to 300 Processing Units (PUs). Spanner allows granular scaling in batches of 100 PUs for instances smaller than 1 node. (Avoid alternative: Upgrading to 1 node (1,000 PUs) is too expensive and exceeds the stated requirements.)
Key Takeaways (2.4b)
- Enable 'Automatic storage increase' on Cloud SQL instances to prevent downtime caused by full disks.
- Automatic storage increase adds capacity online without restarting the instance.
- Provisioned storage capacity cannot be decreased automatically; increases are permanent until you migrate to a new instance.
- Cloud Spanner compute capacity is measured in nodes or Processing Units (PUs).
Consideration 2.4c: Define replication strategies
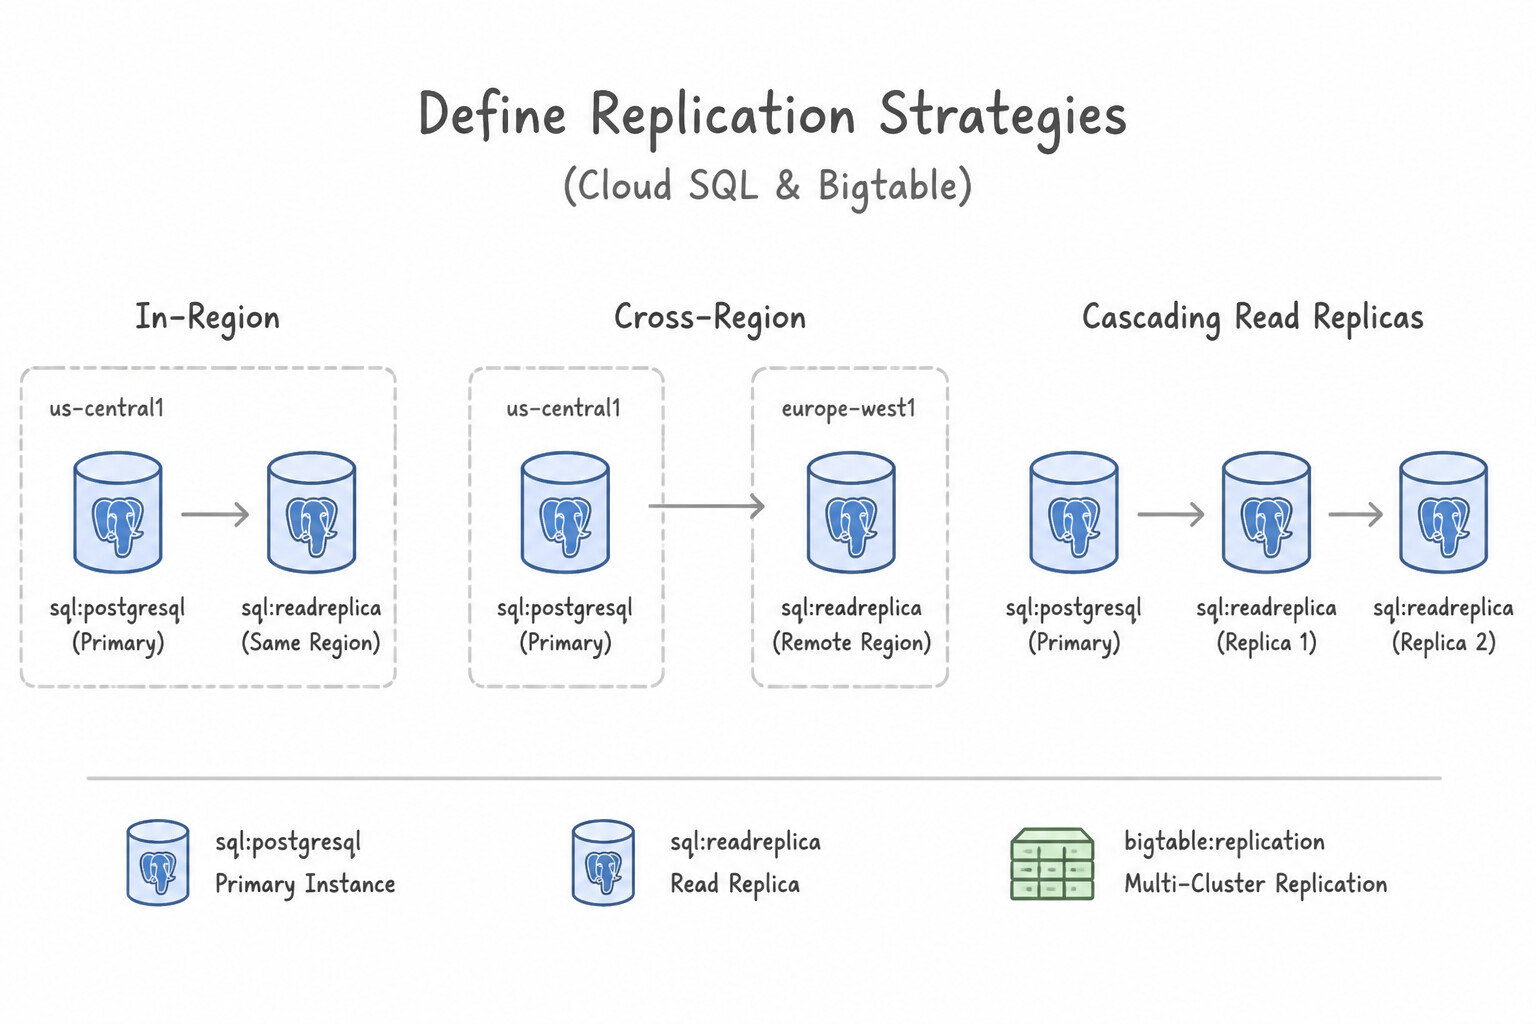
Replication serves three distinct goals—High Availability, Read Offloading / Geo-Locality, and Analytics Isolation—and each requires a specific topology:
- In-Region vs. Cross-Region vs. Cascading Read Replicas (Cloud SQL):
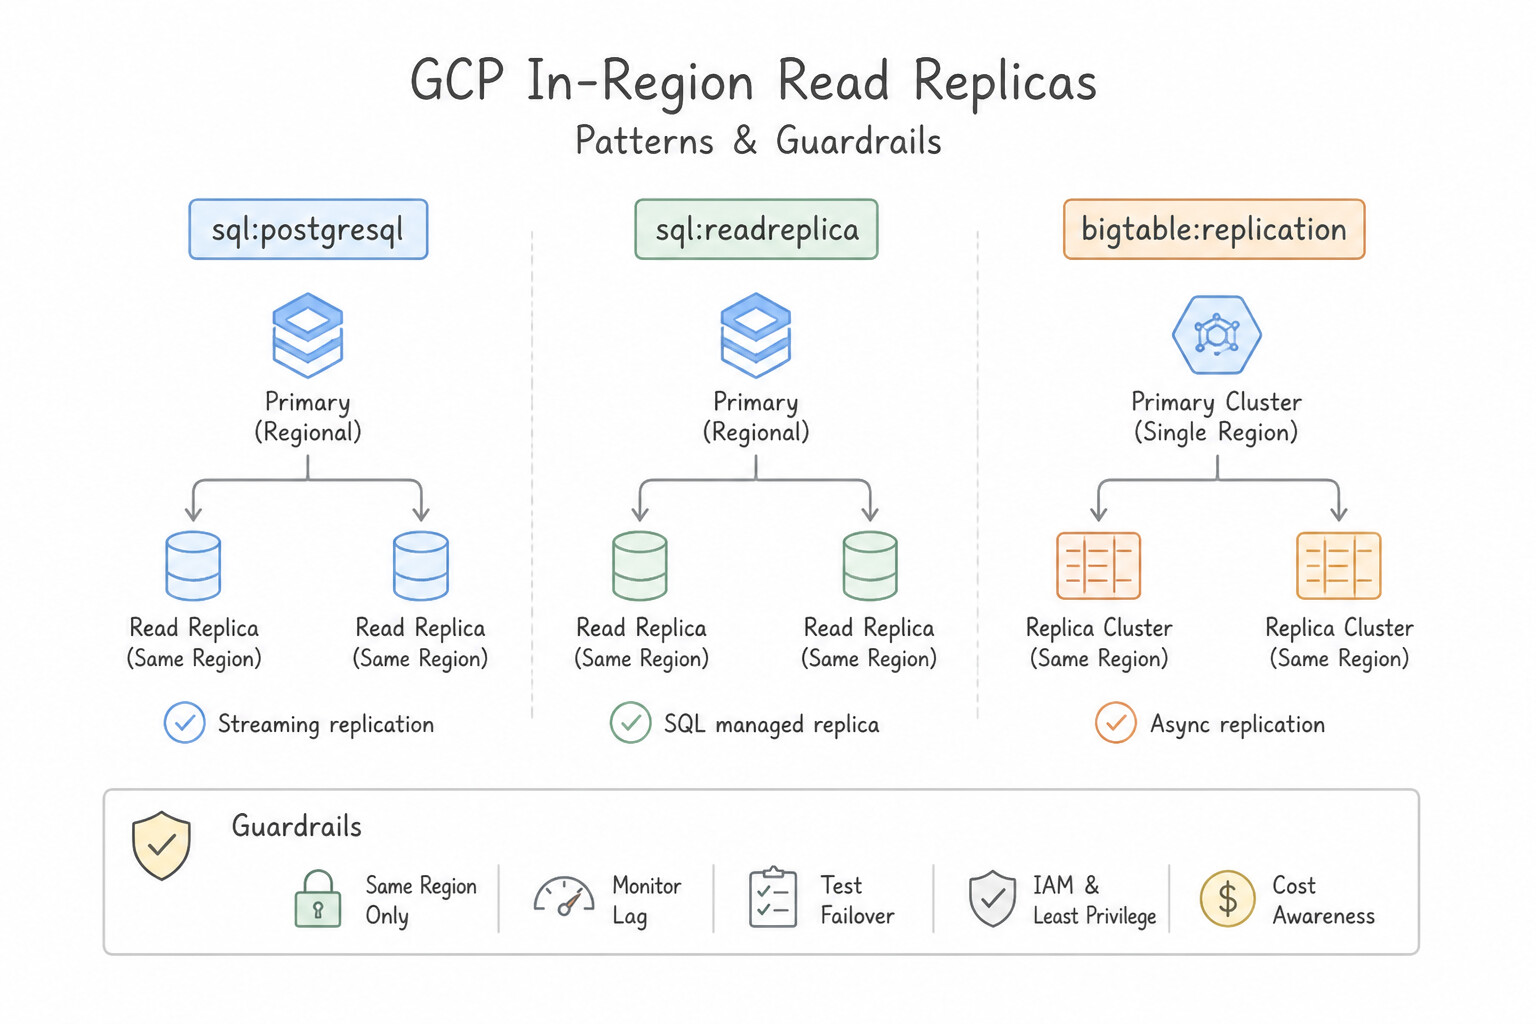
- In-Region Read Replicas: Offload heavy reporting/read traffic within the same region without paying cross-region network egress fees.
- Cross-Region Read Replicas: Place read data close to users in distant continents (low read latency) AND serve as the Regional Disaster Recovery (
DR) promotion target. - Cascading Read Replicas (Cloud SQL for MySQL & PostgreSQL): Allows a Read Replica to replicate to up to 4 nested levels of downstream Read Replicas. If your primary is in
us-central1and you need 5 read replicas ineurope-west1, replicate fromus-central1→ 1 relay replica ineurope-west1→ 4 leaf replicas ineurope-west1. This reduces cross-continental network egress charges by 80% and removes replication overhead from the primary! - Spanner Replica Roles (
Read-Write,Read-Only,Witness): - Read-Write Replicas: Hold a full copy of data, serve reads/writes, and vote in Paxos commit quorums.
- Read-Only Replicas: Hold a full copy of data to serve low-latency local reads in distant regions, but do NOT vote in Paxos write quorums—so adding Read-Only replicas in Asia/Europe for a US-based Spanner instance speeds up global reads without slowing down write commit latency!
- Witness Replicas: Do NOT store data and do NOT serve reads; they only vote in Paxos quorums to break ties at minimal cost.
Key Implementation Patterns
- Cloud SQL Read Offloading: Use Create a Cloud SQL read replica and configure the reporting application to connect to it. Read replicas isolate read-heavy workloads from the primary instance, protecting the performance of transactional operations. (Avoid alternative: Vertical scaling adds resources but does not isolate the reporting workload from the transactional workload.)
- Bigtable Workload Isolation: Use Add a new cluster to the Bigtable instance. Create a custom App Profile for the batch job that uses single-cluster routing to the new cluster. Replication with single-cluster routing physically separates the compute resources used for ingestion (writes) from those used for analysis (reads).
- Spanner Global Availability vs. Cost: Use Provision a multi-region instance configuration. Only multi-region configurations provide the required 99.999% availability SLA. (Avoid alternative: Regional instances only offer 99.99% availability, which fails to meet the requirement.)
Key Takeaways (2.4c)
- Use Read Replicas to offload read-heavy workloads from the primary instance.
- The Primary instance should be dedicated to write operations and critical transactional reads.
- High Availability (HA) standby instances are for failover redundancy, not for scaling reads.
- Vertical scaling (increasing size) does not isolate workloads; it only adds capacity.
Consideration 2.4d: Continuously assess and optimize the cost of running a database solution
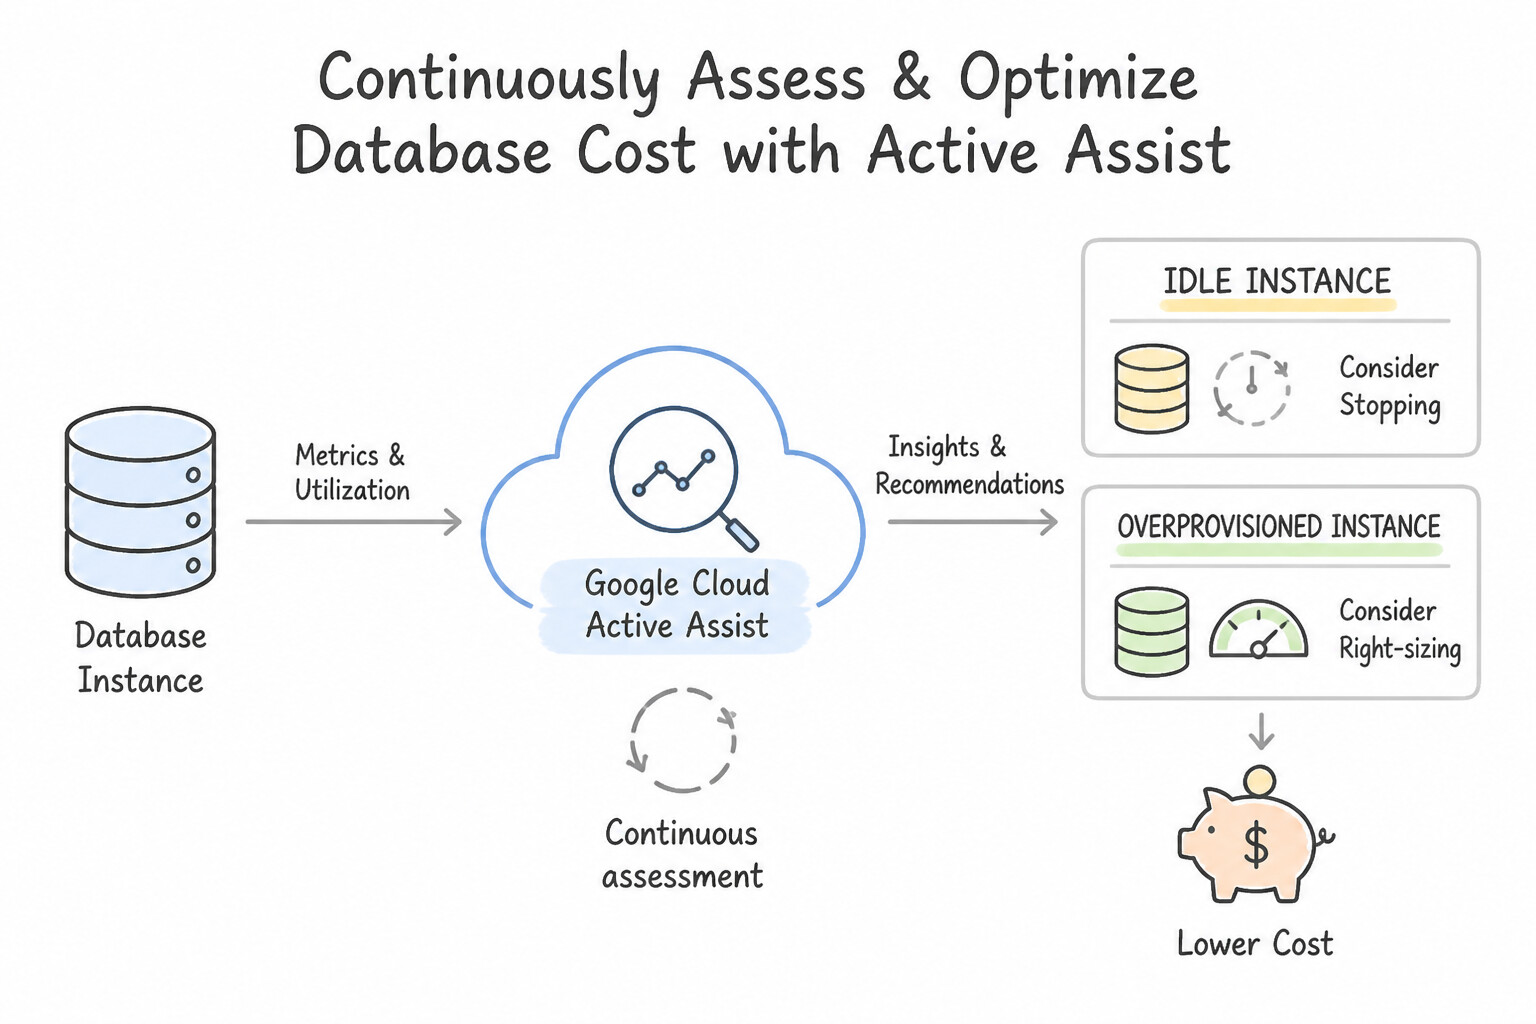
Google Cloud provides automated intelligence and pricing levers to eliminate database waste:
- Google Cloud Active Assist (
Idle&OverprovisionedInstance Recommenders): - Continuously analyzes 30 days of CPU, memory, and connection telemetry in Cloud Monitoring to flag Idle Cloud SQL instances (zero connections/queries → stop, snapshot, or delete) and Overprovisioned Cloud SQL / Spanner instances (consistently low CPU/RAM → right-size machine tier).
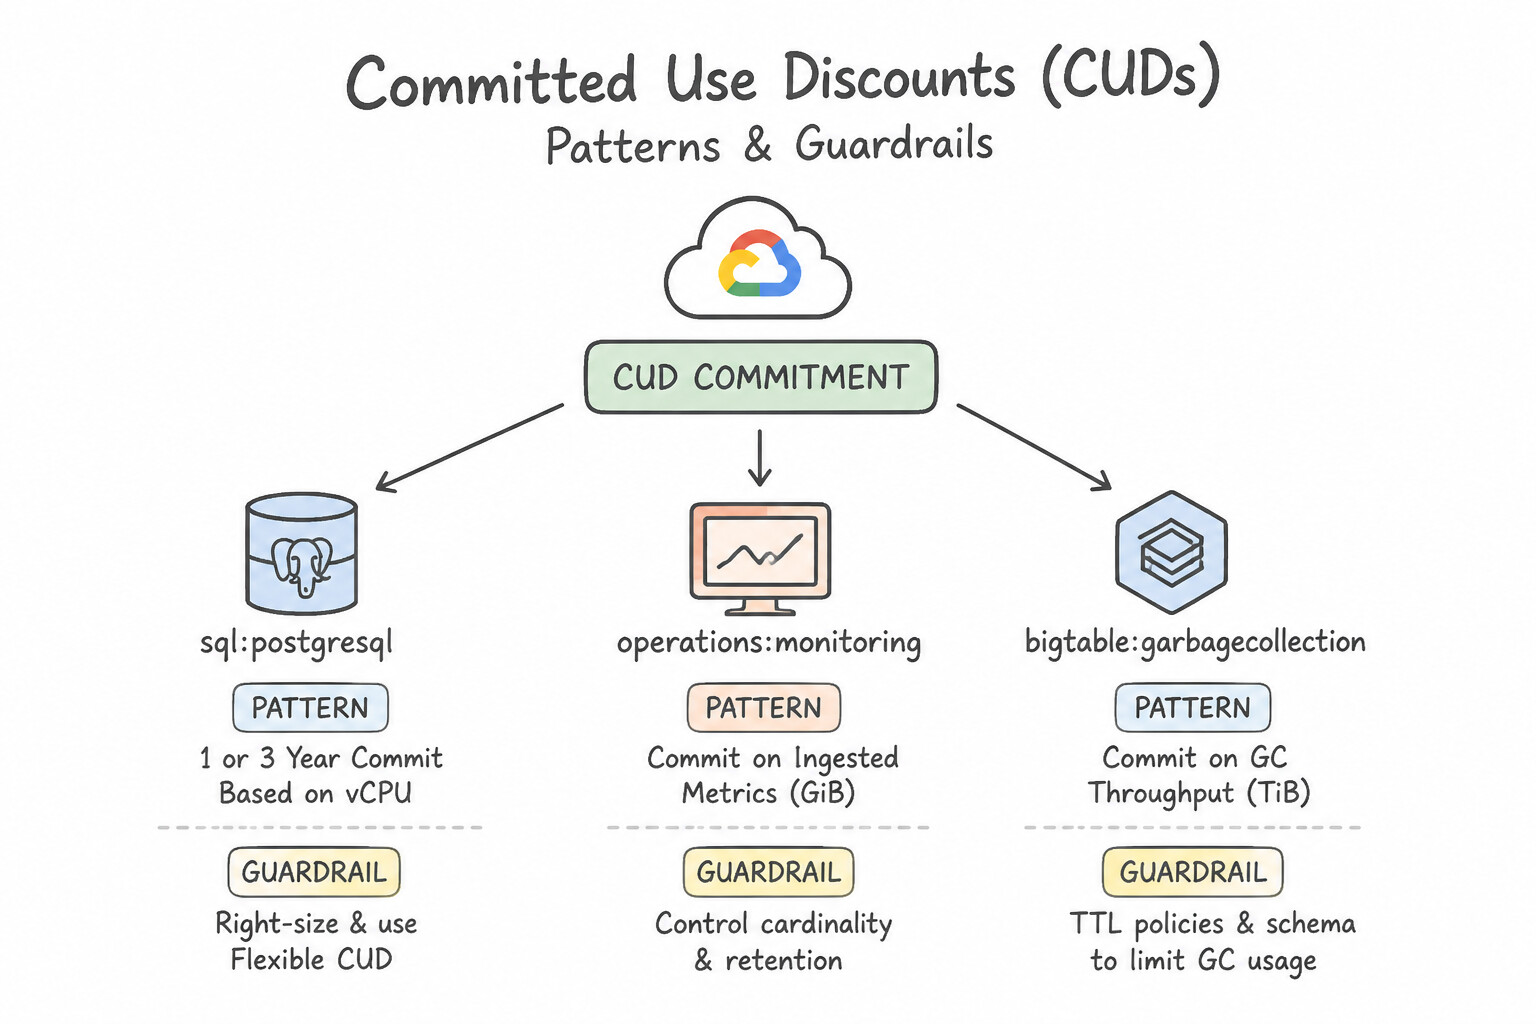
- Committed Use Discounts (
CUDs): - Purchase 1-year ($25\%\text{--}30\%+discount)** or **3-year (@@ESCAPEDDOLLAR@@45%--52%+ discount) commitments for predictable baseline vCPU/RAM in Cloud SQL, AlloyDB, and Cloud Spanner, leaving only the variable peak headroom on on-demand pricing.
- Storage, Backup & Network Cost Hygiene:
- Drop unused secondary indexes (verified via
pg_stat_user_indexes.idx_scan = 0orSPANNER_SYS)—every unused index consumes expensive SSD storage, buffer pool RAM, and write IOPS on everyINSERT/UPDATE! - In Firestore, exempt large text/JSON fields and unqueried nested maps from automatic single-field indexing to slash index storage costs by up to 80%.
Key Implementation Patterns
- Rightsizing Cloud SQL Instances: Use Edit the instance configuration to reduce the vCPUs and memory. Scaling down the machine type to match actual usage is the most direct way to reduce costs. (Avoid alternative: Do not commit to a configuration that is larger than necessary; rightsize first.)
- Cloud Bigtable Storage Optimization: Use Configure a garbage collection policy to delete cells older than one year. Garbage collection automatically removes data exceeding the retention period, capping storage growth. (Avoid alternative: HDD lowers the rate per GB but does not stop the unlimited accumulation of old data.)
Key Takeaways (2.4d)
- Cloud SQL allows you to scale compute resources (vCPUs and memory) up or down by editing the instance configuration.
- Always review monitoring metrics (CPU and Memory utilization) to identify over-provisioned resources.
- Rightsizing should be performed before purchasing committed use discounts to avoid locking in waste.
- Bigtable separates compute and storage billing; optimize them independently.
Consideration 2.4e: Optimize queries for cost and performance
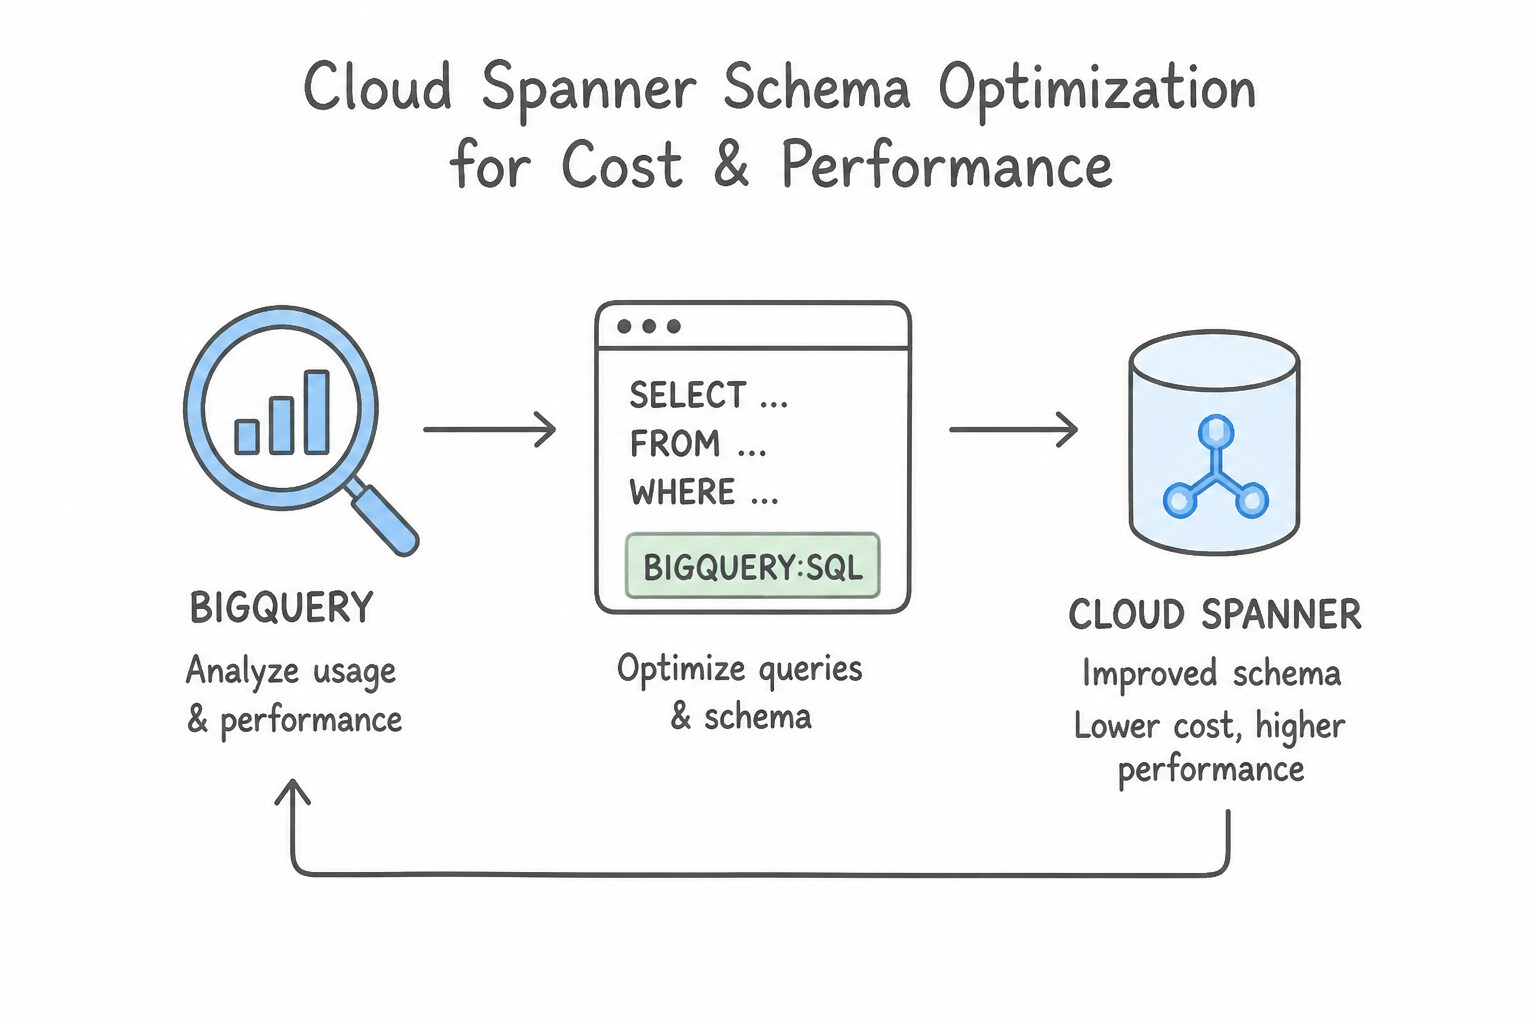
High-impact schema and query optimizations that appear repeatedly in production:
- Cloud Spanner Schema Optimization:
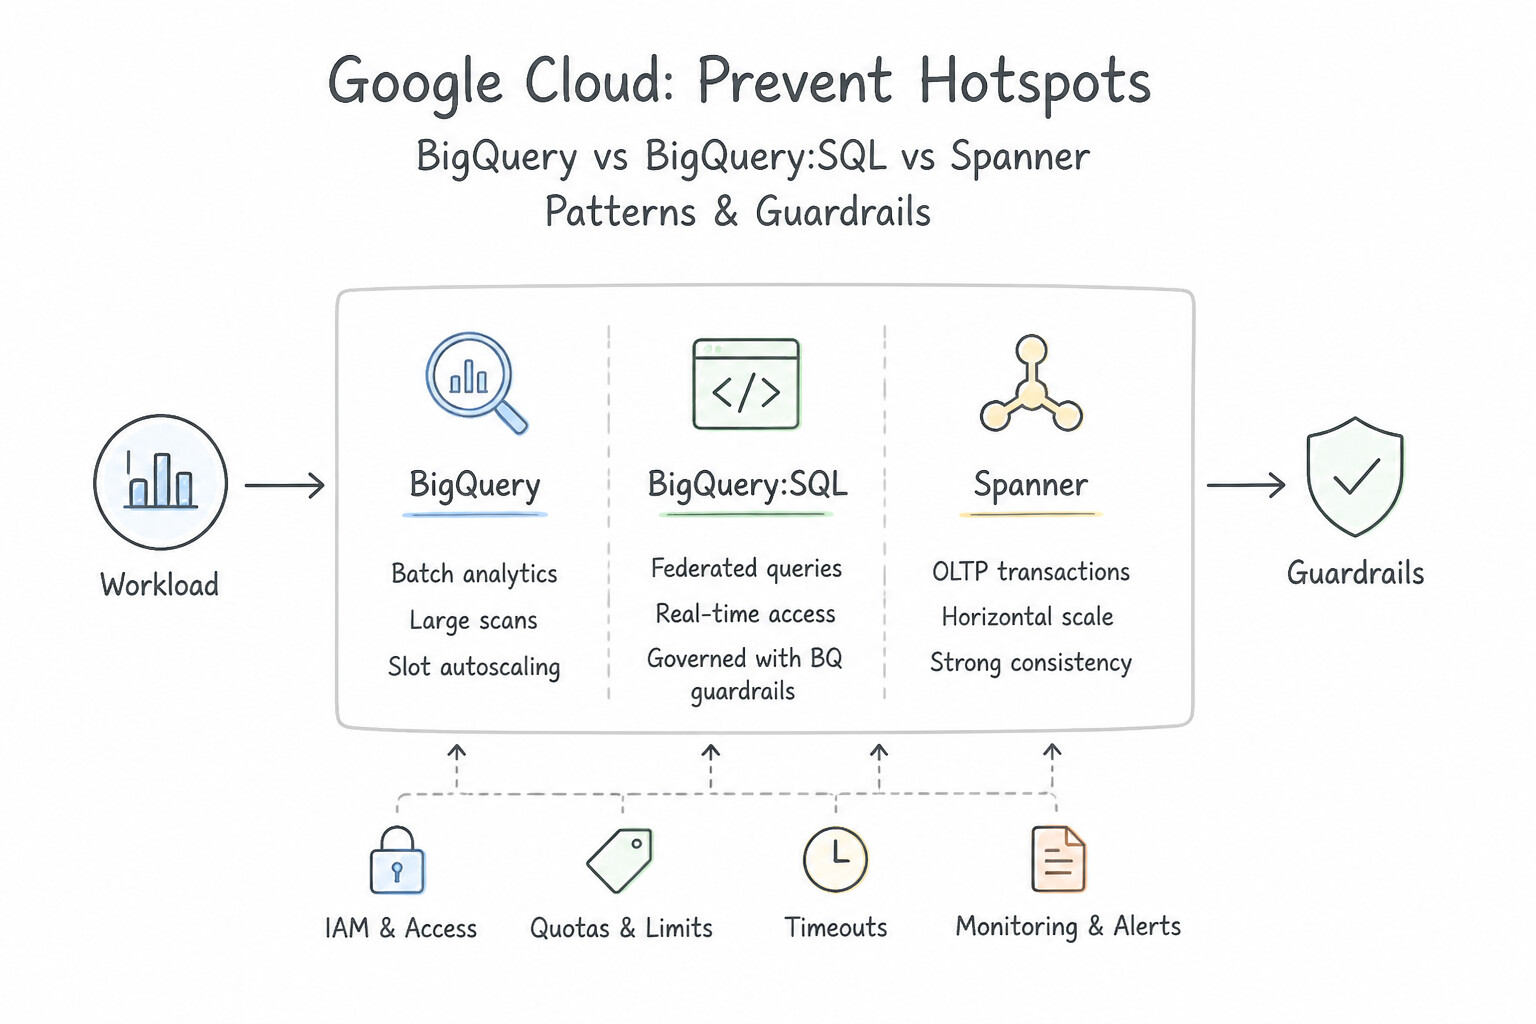
- Prevent Hotspots: Never use monotonic keys (
INT64sequential IDs or leadingTIMESTAMP). Use UUIDv4, Bit-Reversed Sequences (BIT_REVERSE_POSITIVE), or Composite Keys with a high-cardinality prefix (shard_id/user_id). - Table Interleaving (
INTERLEAVE IN PARENT parent_table ON DELETE CASCADE): Physically co-locates child rows (e.g.,OrderItems) inside the exact same storage split right next to their parent row (Orders). This allows parent-childJOINs and writes to execute within a single local storage split with zero cross-node network hops! - Covering Secondary Indexes (
STORING (col1, col2)): By default, a Spanner secondary index only stores the indexed columns plus the base table's Primary Key. If a query selectsstatus(indexed) andorder_total(not indexed), Spanner must perform a costly back-join to the base table. AddingSTORING (order_total)to the index definition lets Spanner satisfy the entire query from a single index-only scan! - PostgreSQL / AlloyDB Query Optimization:
- Use Covering Indexes (
CREATE INDEX ... ON tbl(a, b) INCLUDE (c)) to enable Index-Only Scans, Partial Indexes (WHERE is_active = true) to keep indexes tiny, and GIN Indexes forJSONB/ full-text searches. - Offload repetitive point-lookup queries (
SELECT profile FROM users WHERE id = ?) to Memorystore for Redis using the Cache-Aside (Lazy Loading) pattern with a boundedTTL.
Key Implementation Patterns
- BigQuery Columnar Scan Cost: Use Update the query to explicitly select only the transaction_id and timestamp columns. BigQuery charges based on data read; selecting only specific columns minimizes the data scanned and reduces cost. (Avoid alternative: LIMIT reduces the output size but does not reduce the amount of data scanned or the cost in BigQuery.)
- Cloud Spanner Secondary Index with Storing: Use Create a secondary index on CustomerID that includes the STORING clause for OrderDate and TotalAmount. The STORING clause creates a covering index, allowing the query to retrieve all data from the index without joining back to the base table.
Key Takeaways (2.4e)
- BigQuery uses columnar storage, optimized for reading specific fields across large datasets.
- Cost is determined by the amount of data (bytes) scanned, not the number of rows returned.
- Avoid
SELECT *in production queries; always explicitly list the required columns.- The
LIMITclause generally does not reduce the cost of a query in BigQuery.
Quick Decision Cheat Sheet (Subsection 2.4)
If the Scenario Requires... | Choose This Google Cloud Pattern | Avoid This Common Mistake |
|---|---|---|
"Scale PostgreSQL read capacity elastically behind a single connection endpoint without app config changes" | AlloyDB Read Pools (or Cloud SQL Read Replicas behind an internal load balancer / ProxySQL) | Vertically scaling the primary instance repeatedly during business hours (causes restart downtime) |
"Reduce cross-region replication bandwidth cost when deploying multiple Cloud SQL replicas in a remote region" | Cascading Read Replicas | Creating 8 separate cross-region streams directly from the primary |
"Physically co-locate parent and child rows in the same storage split in Cloud Spanner" | Table Interleaving ( INTERLEAVE IN PARENT) | Standard Foreign Keys (which do not co-locate data splits) |
"Avoid base-table back-join lookups when querying a secondary index" | Use STORING (...) in Cloud Spanner or INCLUDE (...) in PostgreSQL (Covering Index) | Creating separate single-column indexes on every column |
"Automatically identify idle or oversized Cloud SQL instances across 100 projects" | Use Google Cloud Active Assist (Idle & Overprovisioned DB Recommenders) + Committed Use Discounts (CUDs) for baseline | Manually exporting billing CSVs once a year |
Further Reading (Subsection 2.4)
- Cloud SQL for PostgreSQL: Replication — Explains how read replicas work in Cloud SQL, including their use case for scaling read capacity.
- About replication in Cloud SQL — Provides specific details on creating and managing read replicas to improve performance for read-heavy workloads.
- Performance Optimization tips for MySQL — Documentation explaining how storage capacity affects IOPS and throughput performance.
- CPU utilization metrics — Explains how to interpret CPU utilization metrics and the recommended thresholds (65% for regional instances).
- Compute capacity — Details how nodes and processing units define the compute resources available to an instance.
- Cloud SQL Storage Settings — Refer to the section on 'Automatic storage increase' to understand how the threshold is calculated and how to enable it.
Subsection 2.5: Automate common database tasks
The Big Picture
Running one database by clicking buttons in the Google Cloud Console is manageable; running 80 databases across dev, staging, and production via manual bash scripts guarantees configuration drift, missed index maintenance, botched major-version upgrades, and silent SLO breaches. Subsection 2.5 tests how a senior Database Engineer automates day-2 operational toil across four pillars (2.5a through 2.5d):
- Automating Routine Engine Maintenance (2.5a): Relational engines require regular internal housekeeping. In PostgreSQL (Cloud SQL & AlloyDB), every
UPDATEandDELETEleaves behind dead tuples (MVCC). If Autovacuum is disabled or under-tuned on high-churn tables, the table suffers severe table/index bloat, query planner statistics (pg_statistic) grow stale, and the database eventually hits the catastrophic Transaction ID (XID) Wraparound Shutdown! Automating index rebuilds (REINDEX CONCURRENTLY), statistics refreshes (ANALYZE), and partition creation (pg_cron/pg_partman) keeps latency flat over years of operation. - Event-Driven & Serverless Export Automation (2.5b): Scheduled archival exports should never rely on a developer's laptop or a single fragile cron VM. Using Cloud Scheduler → Pub/Sub / Cloud Workflows → Cloud Run Functions / Cloud SQL Admin API (
instances.exportwith--offload) builds a serverless, auditable, retry-safe export pipeline. - Zero/Minimal-Downtime Database Version Upgrades (2.5c) & SLA/SLO Governance (2.5d): While minor version patches are applied automatically during maintenance windows, Major Version Upgrades (e.g., PostgreSQL 14 → 16, or MySQL 5.7 → 8.0) can break deprecated SQL syntax, extensions, or data types and require downtime if executed in place (
--database-version). And tracking availability/latency via Error Budgets and Burn Rate Alerts ensures engineering teams prioritize reliability before contractual SLAs are violated.
Consideration 2.5a: Perform database maintenance (e.g., rebuilding indexes, data exports)
Know the exact non-blocking maintenance commands and extensions for production databases:
- PostgreSQL
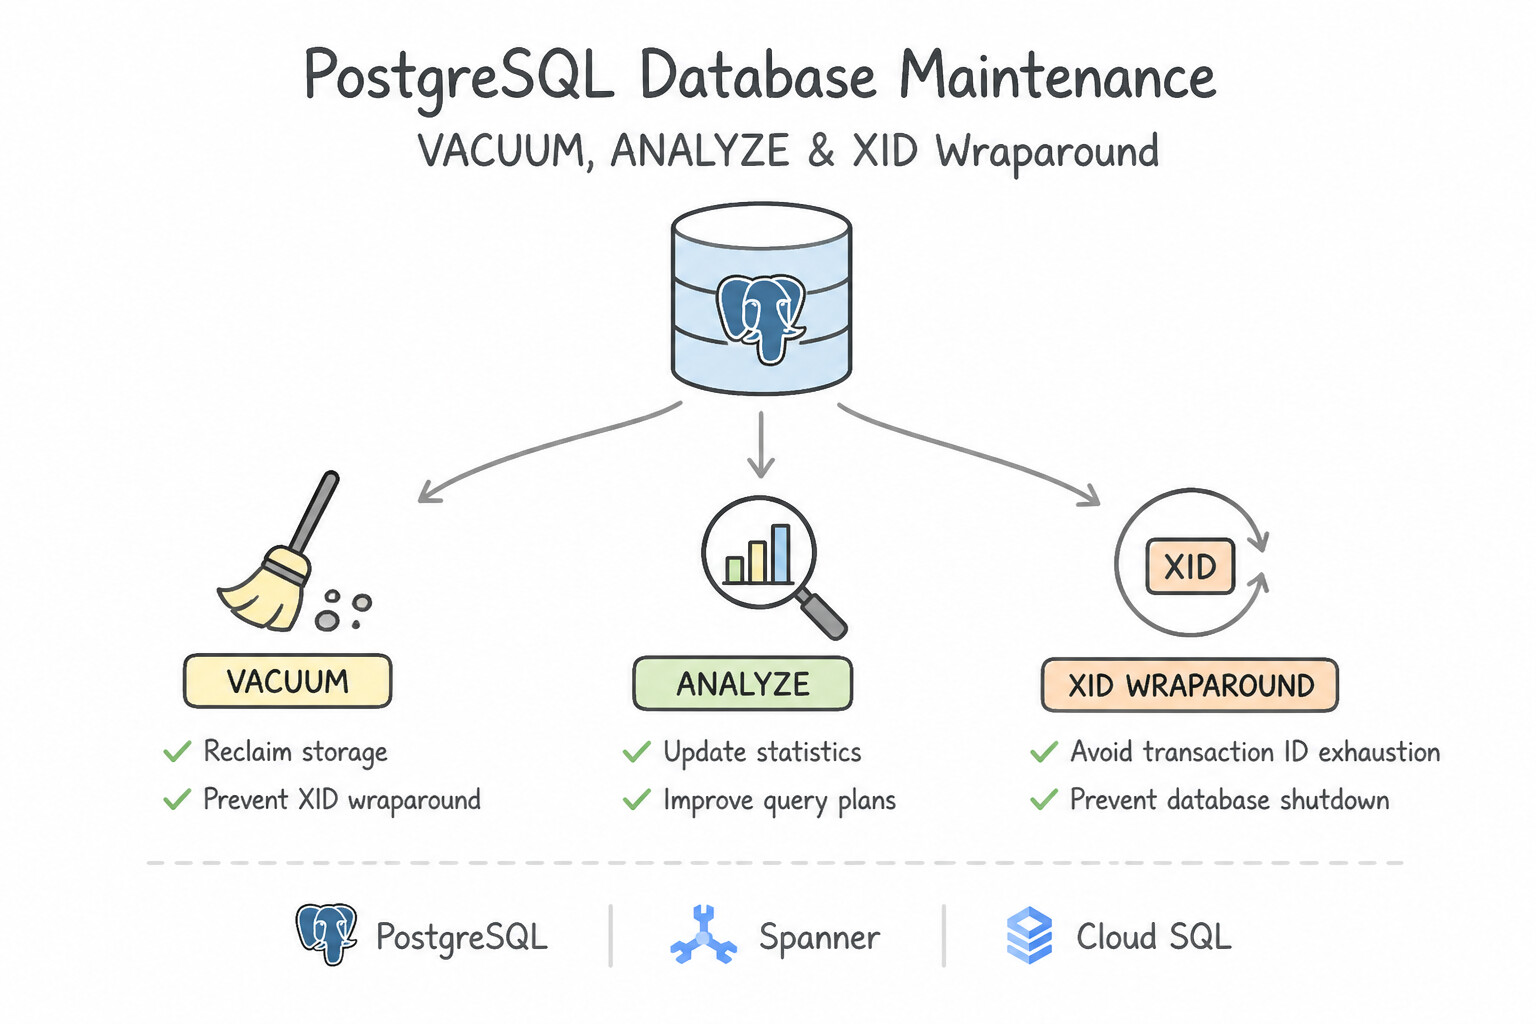
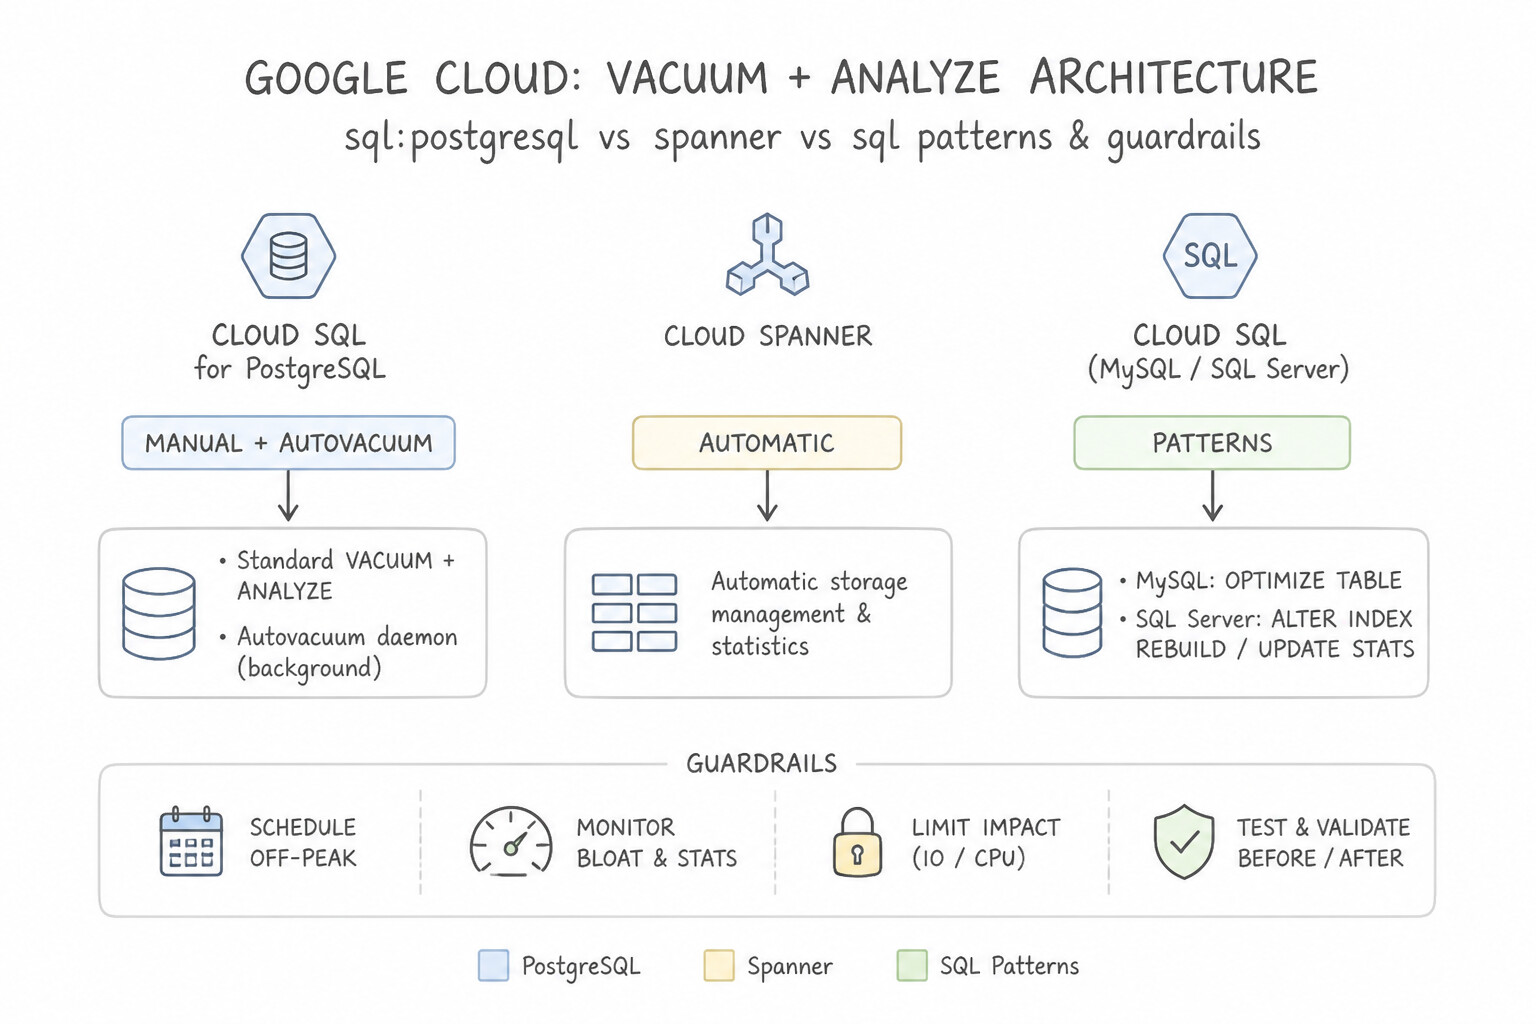
VACUUM,ANALYZE, and Transaction ID (XID) Wraparound: - Standard
VACUUM+ANALYZE(andautovacuum): Runs online without blocking reads or writes; marks dead tuple space reusable inside the table and updates optimizer histogram statistics for the query planner. - Why
VACUUM FULLIs an common pitfalls for Live Production:VACUUM FULLrewrites the entire table to a new disk file to return space to the OS, acquiring anACCESS EXCLUSIVElock that completely blocks all reads and writes (and requires 2x free disk space)! Instead ofVACUUM FULL, tune per-tableautovacuum_vacuum_scale_factor, usepg_squeeze, or drop old partitions viapg_partman. - Index Maintenance (
REINDEX CONCURRENTLY): When B-tree indexes become bloated after heavy deletes, runREINDEX INDEX CONCURRENTLY index_name(orOPTIMIZE TABLEin MySQL InnoDB, which maps to an onlineALTER TABLE ... FORCE) so index compaction never locks out live transactions. - Automating In-Database SQL Jobs (
pg_cron): - Enable the
pg_cronextension in Cloud SQL for PostgreSQL / AlloyDB (cloudsql.enable_pg_cron = on) to schedule recurring SQL maintenance (ANALYZE, partition management withpg_partman, refreshingMATERIALIZED VIEW CONCURRENTLY) directly inside the database engine.
Key Implementation Patterns
- Automating Vacuum Operations in Cloud SQL for PostgreSQL: Use Enable the pg_cron extension and use the cron.schedule function to run the command. The pg_cron extension runs scheduled jobs natively inside the Cloud SQL instance, avoiding external dependencies. (Avoid alternative: A virtual machine is an external compute resource requiring maintenance, which contradicts the scenario's requirements.)
- Automating Data Expiry in Cloud Spanner: Use Update the table schema to add a Row Deletion Policy that targets rows older than 90 days. Spanner's native Row Deletion Policy (TTL) automatically removes old data with a simple schema change. (Avoid alternative: Custom scripts on VMs require extra maintenance and infrastructure management.)
- Serverless Scheduling of Cloud SQL Exports: Use Configure a Cloud Scheduler job to send an HTTP POST request to the Cloud SQL Admin API
instances.exportmethod. Using Cloud Scheduler to trigger the Cloud SQL Admin API directly is a serverless, zero-code solution. (Avoid alternative: A VM is not serverless and requires unnecessary maintenance for a simple scheduled task.)
Key Takeaways (2.5a)
- PostgreSQL requires regular vacuuming to remove dead tuples and maintain performance.
- Cloud SQL supports specific PostgreSQL extensions that add native functionality.
- pg_cron is the standard extension for scheduling jobs inside the database without external infrastructure.
- Avoid using external compute (VMs, Cloud Functions) for simple database maintenance tasks when a native option exists.
Consideration 2.5b: Schedule database exports
When production architecture focuses on for a serverless, automated, low-overhead way to run recurring database exports:
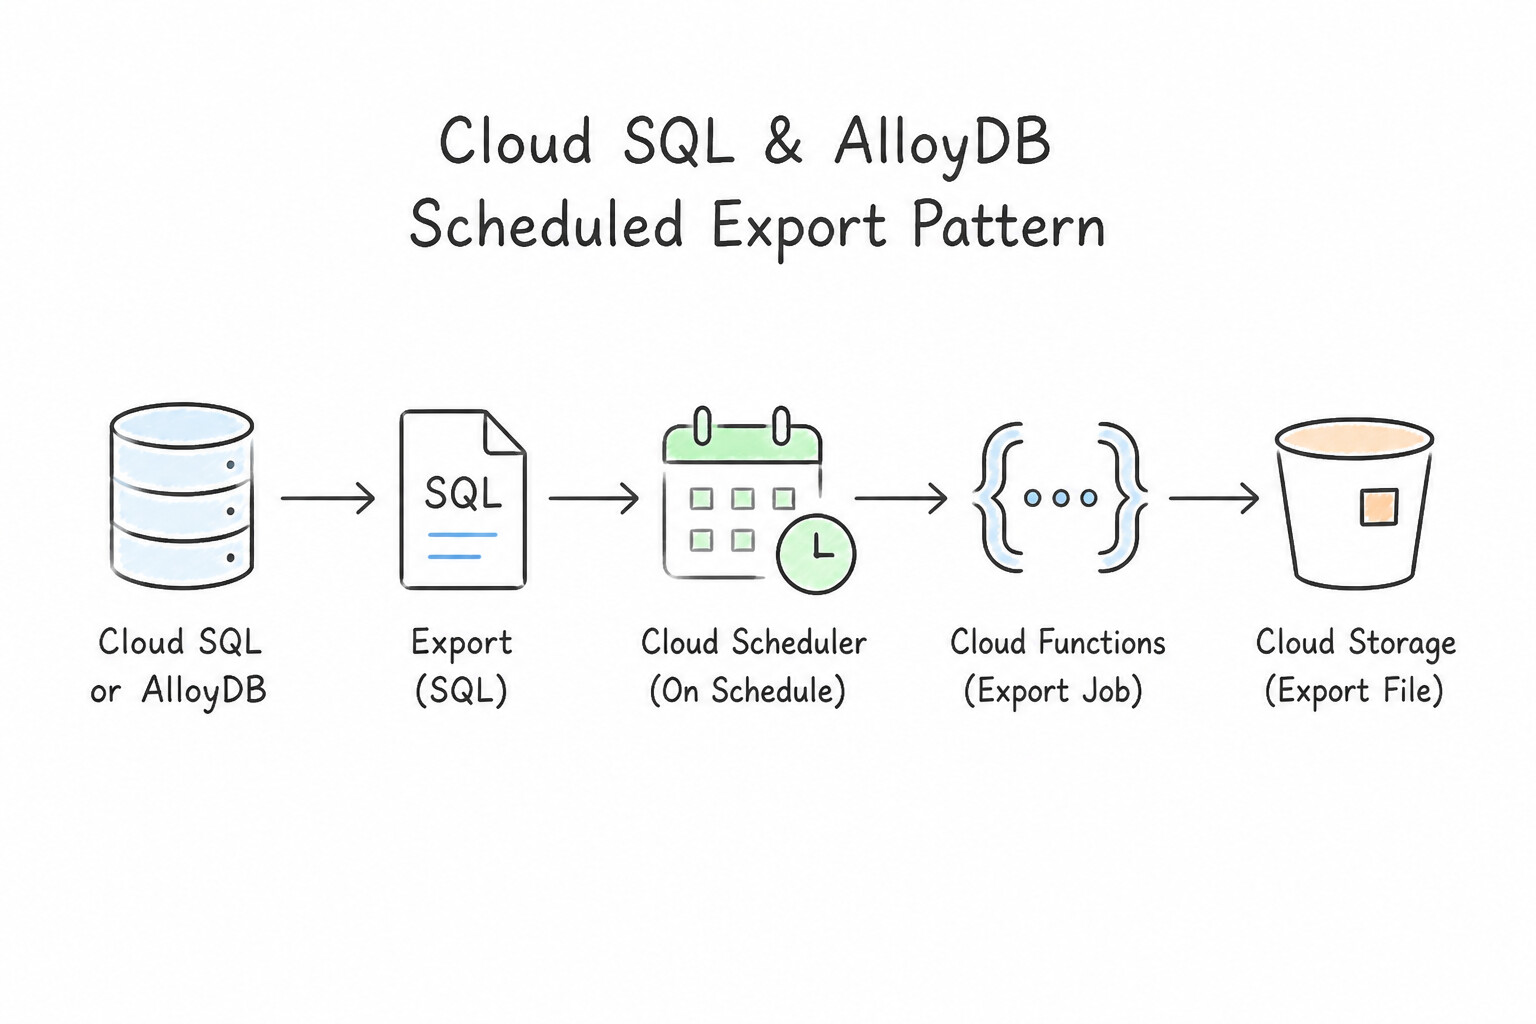
- The Canonical Cloud SQL / AlloyDB Scheduled Export Pattern:
- Cloud Scheduler fires on a cron schedule (e.g.,
0 2 * * *at 2:00 AM daily or weekly). - Publishes a message to Pub/Sub (or invokes Cloud Workflows / a Cloud Run Function) running with a dedicated least-privilege Service Account (
roles/cloudsql.editoror a custom role withcloudsql.instances.export). - Invokes the Cloud SQL Admin API (
instances.export) withoffload: true(Serverless Export) or targets a dedicated Read Replica so primary OLTP traffic experiences zero CPU or I/O impact. - Writes the timestamped
.sql.gzor.csv.gzfile to a Cloud Storage bucket where the Cloud SQL Service Agent hasroles/storage.objectCreator/objectAdmin. - Why
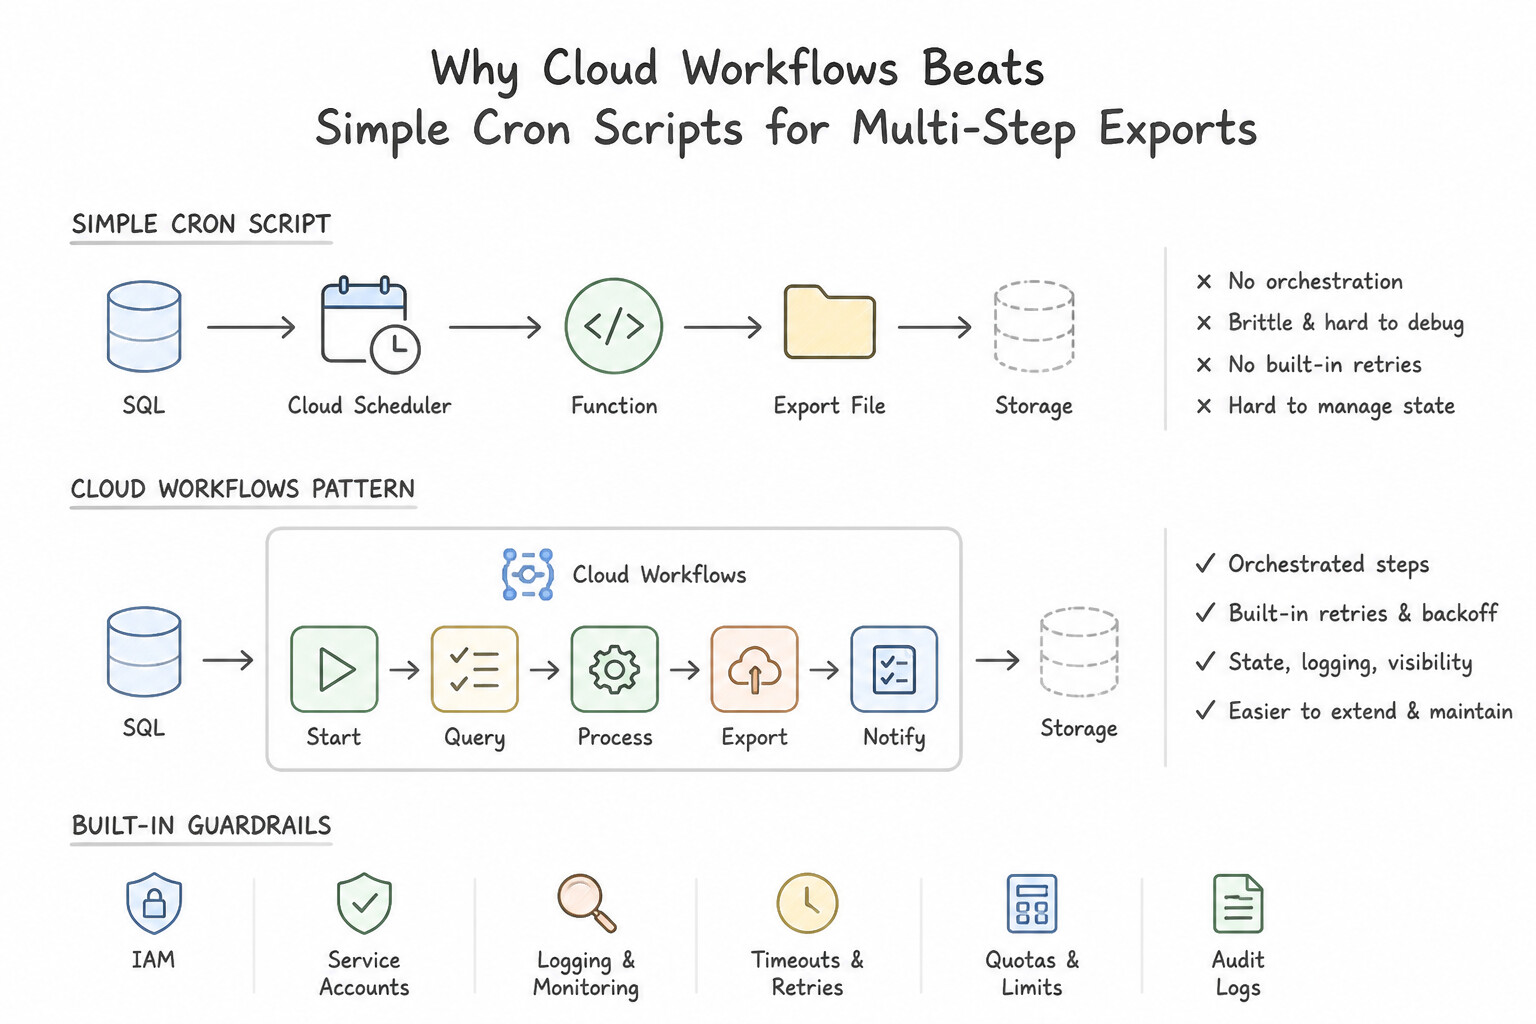
Cloud WorkflowsBeats Simple Cron Scripts for Multi-Step Exports: If the automation must export multiple tables sequentially, poll operation status until completion (gcloud sql operations wait), and then trigger a BigQuery Load Job, Cloud Workflows handles stateful polling, retries, and conditional branching natively without paying for idle compute.
Key Implementation Patterns
- Orchestrating Cloud SQL Exports with Cloud Scheduler: Use Create a Cloud Function that calls the Cloud SQL Admin API to initiate an export. Configure a Cloud Scheduler job to trigger the function nightly. Cloud Scheduler triggering a Cloud Function is the standard serverless pattern for automated tasks.
- Firestore Managed Export Authentication: Use Modify the Cloud Scheduler job to use OIDC authentication and specify a service account with the Cloud Datastore Import Export Admin role. Cloud Scheduler uses OIDC tokens with a Service Account to securely authenticate against Google APIs.
Key Takeaways (2.5b)
- Cloud Scheduler is the managed service for cron-based scheduling.
- Cloud Functions provides the glue code to perform actions triggered by events or schedules.
- Cloud SQL Backups are for restoration; Exports are for extracting data to Cloud Storage.
- Serverless architectures prefer managed services over managing VMs for operational tasks.
Consideration 2.5c: Manage upgrades for Google Cloud-managed databases
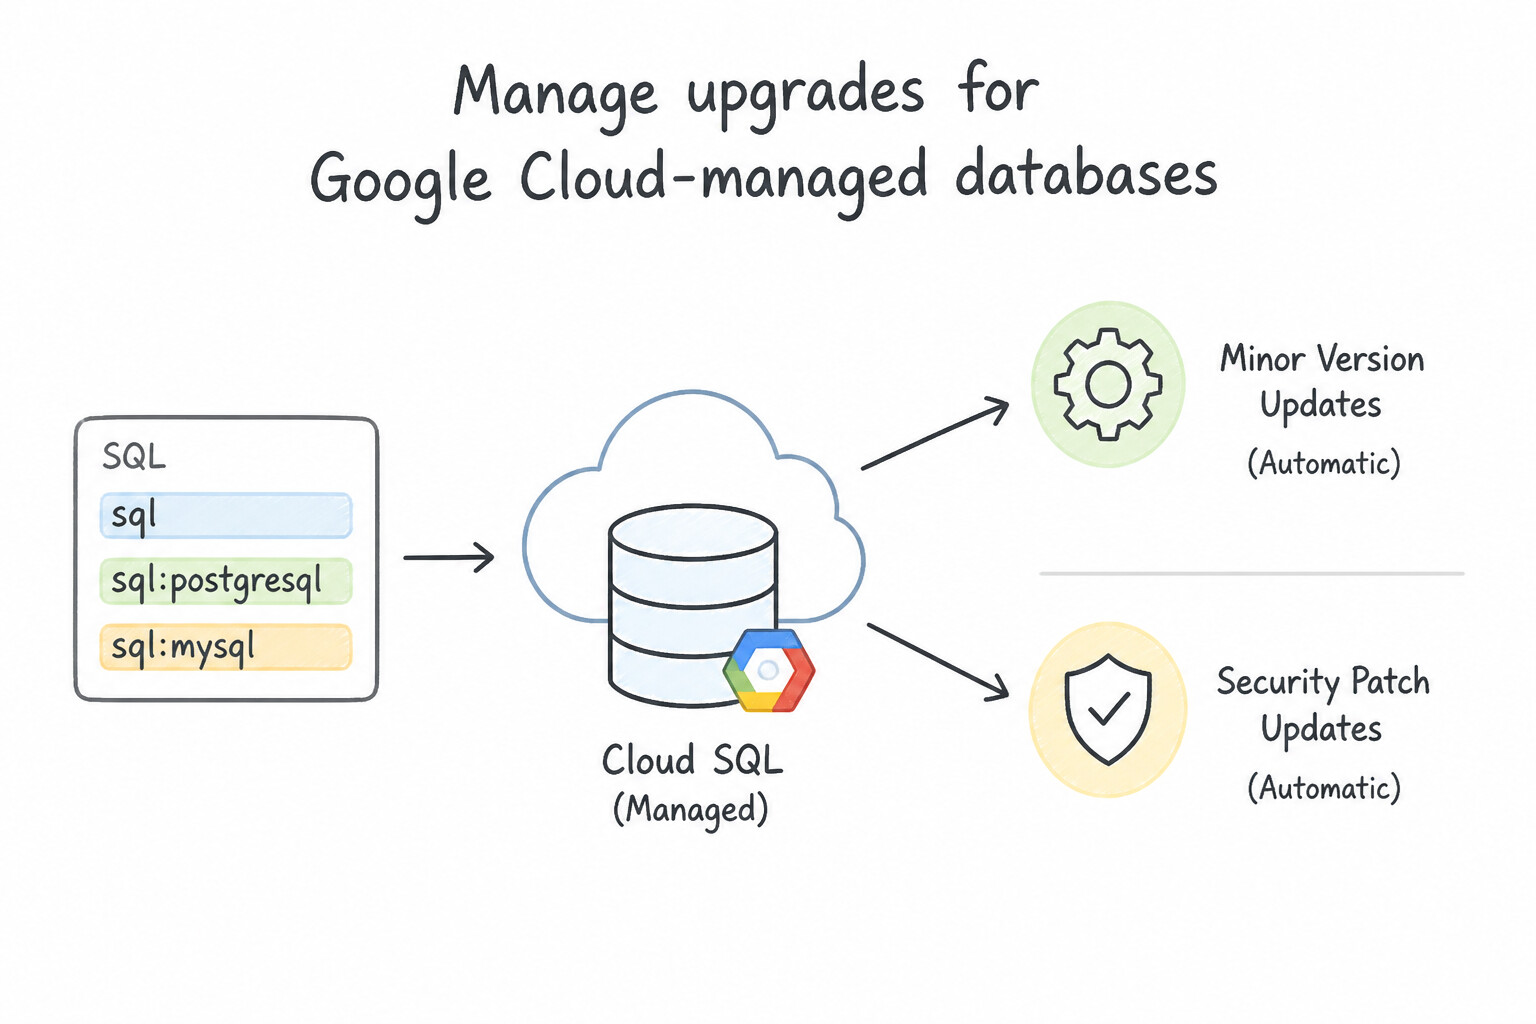
Distinguish clearly between Minor Version Updates, In-Place Major Version Upgrades, and Near-Zero-Downtime Major Version Upgrades:
- Minor Version & Security Patch Updates:
- Managed automatically by Google Cloud during your configured Maintenance Window (use
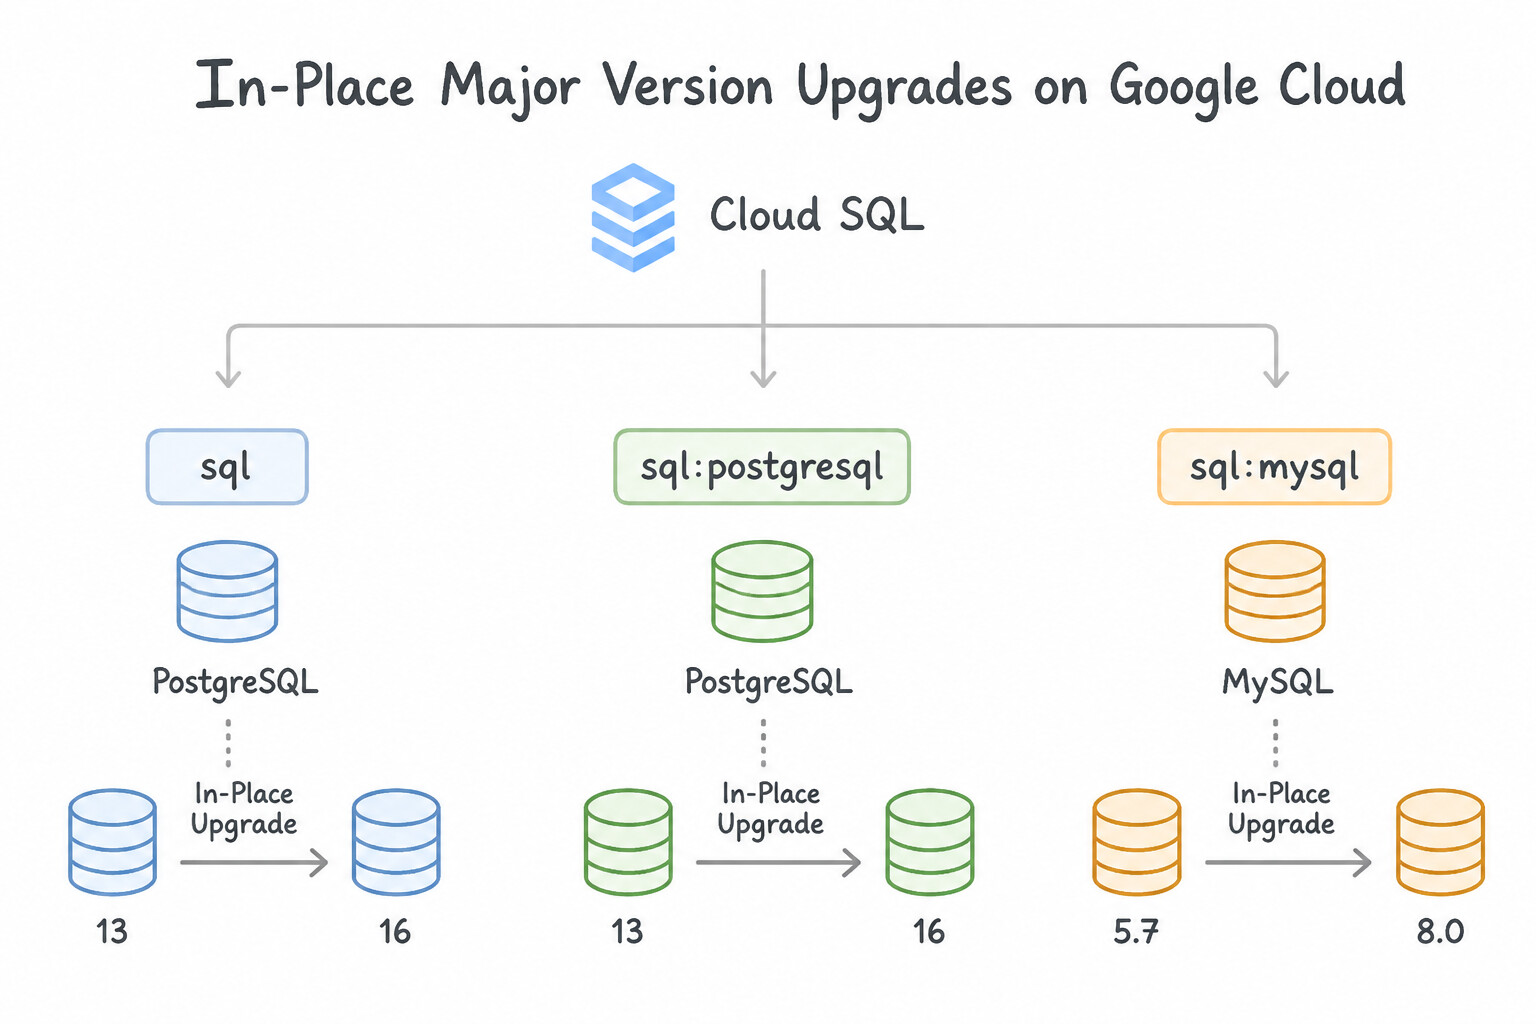
Earlieron non-prod andLateron prod to validate patches a week in advance). - In-Place Major Version Upgrades (e.g., Postgres 13 → 16, MySQL 5.7 → 8.0):
- Always Test on a Clone First: Before upgrading production, create a Cloud SQL Clone of the production instance, run the in-place major upgrade on the clone, verify extension compatibility (
postgis,pgvector) and application regression tests, and runANALYZEafter upgrade! - Downtime: In-place major upgrades require several minutes to hours of instance downtime depending on schema count and cannot be downgraded in place (relying on the automatic pre-upgrade backup if rollback is needed).
- Near-Zero-Downtime Major Version Upgrades (
DMS/ Blue-Green Migration): - Whenever the production scenarios states "upgrade from MySQL 5.7 to 8.0 (or PostgreSQL 12 to 16) with near-zero downtime (<1–2 minutes)", do NOT use an in-place upgrade! Instead, use Database Migration Service (DMS) (or logical replication) to continuously replicate from the old-version source instance to a newly provisioned new-version target instance, validate data, and perform a fast cutover!
Key Implementation Patterns
- In-Place Major Version Upgrade Strategy: Use Perform an in-place major version upgrade using the Google Cloud console. In-place upgrades allow you to upgrade the major version of the database while keeping the existing IP address, name, and settings. (Avoid alternative: Promoting a replica changes the primary instance, potentially requiring connection changes, and adds complexity compared to an in-place upgrade.)
- Rollback Strategy for Major Upgrades: Use Identify the backup ID generated automatically before the upgrade and restore it. Cloud SQL automatically creates a backup before a major upgrade; restoring this backup is the standard rollback method. (Avoid alternative: You cannot downgrade the major version of an existing Cloud SQL instance in-place.)
- Upgrade Risk Mitigation with Cloning: Use Create a clone of the production instance and perform the upgrade on the clone. Cloning creates an isolated copy of the database, allowing you to test upgrades safely without affecting production. (Avoid alternative: Upgrading production directly risks downtime if incompatibilities exist.)
Key Takeaways (2.5c)
- Cloud SQL supports in-place major version upgrades for PostgreSQL.
- In-place upgrades preserve the instance IP address, name, and configuration settings.
- Migration strategies (like Export/Import or DMS) create new instances and typically result in IP address changes.
- In-place upgrades generally offer the lowest operational overhead for version updates.
Consideration 2.5d: Monitor database SLA/SLOs
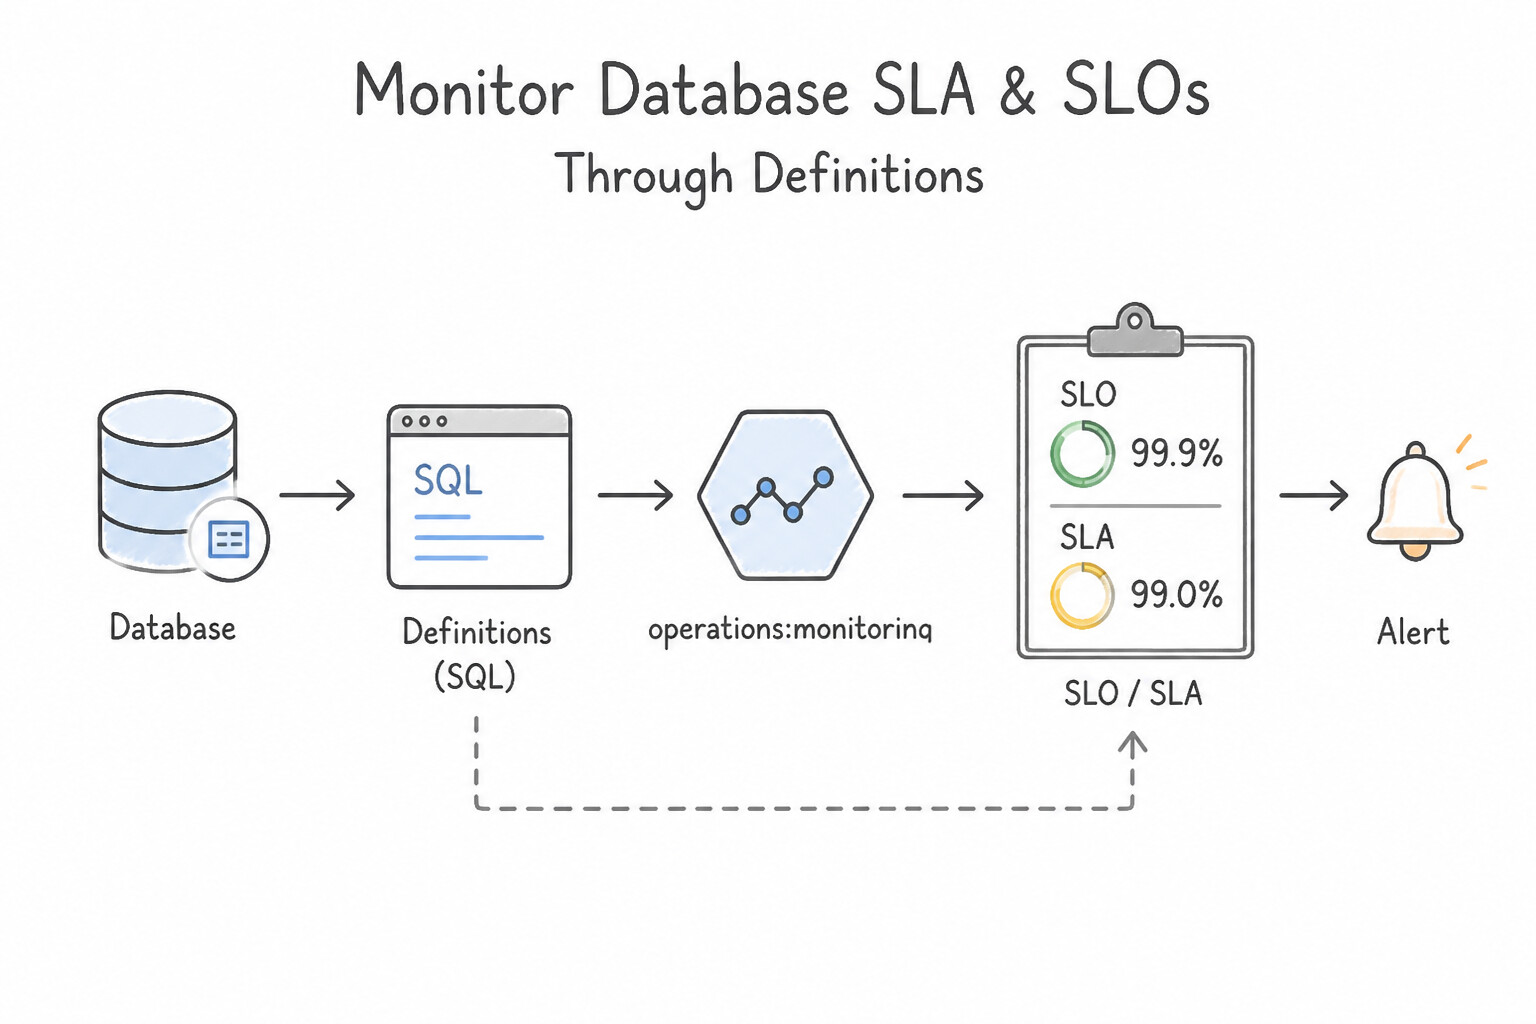
Understand the rigorous SRE distinction between SLI, SLO, SLA, and Error Budgets:
- Definitions:
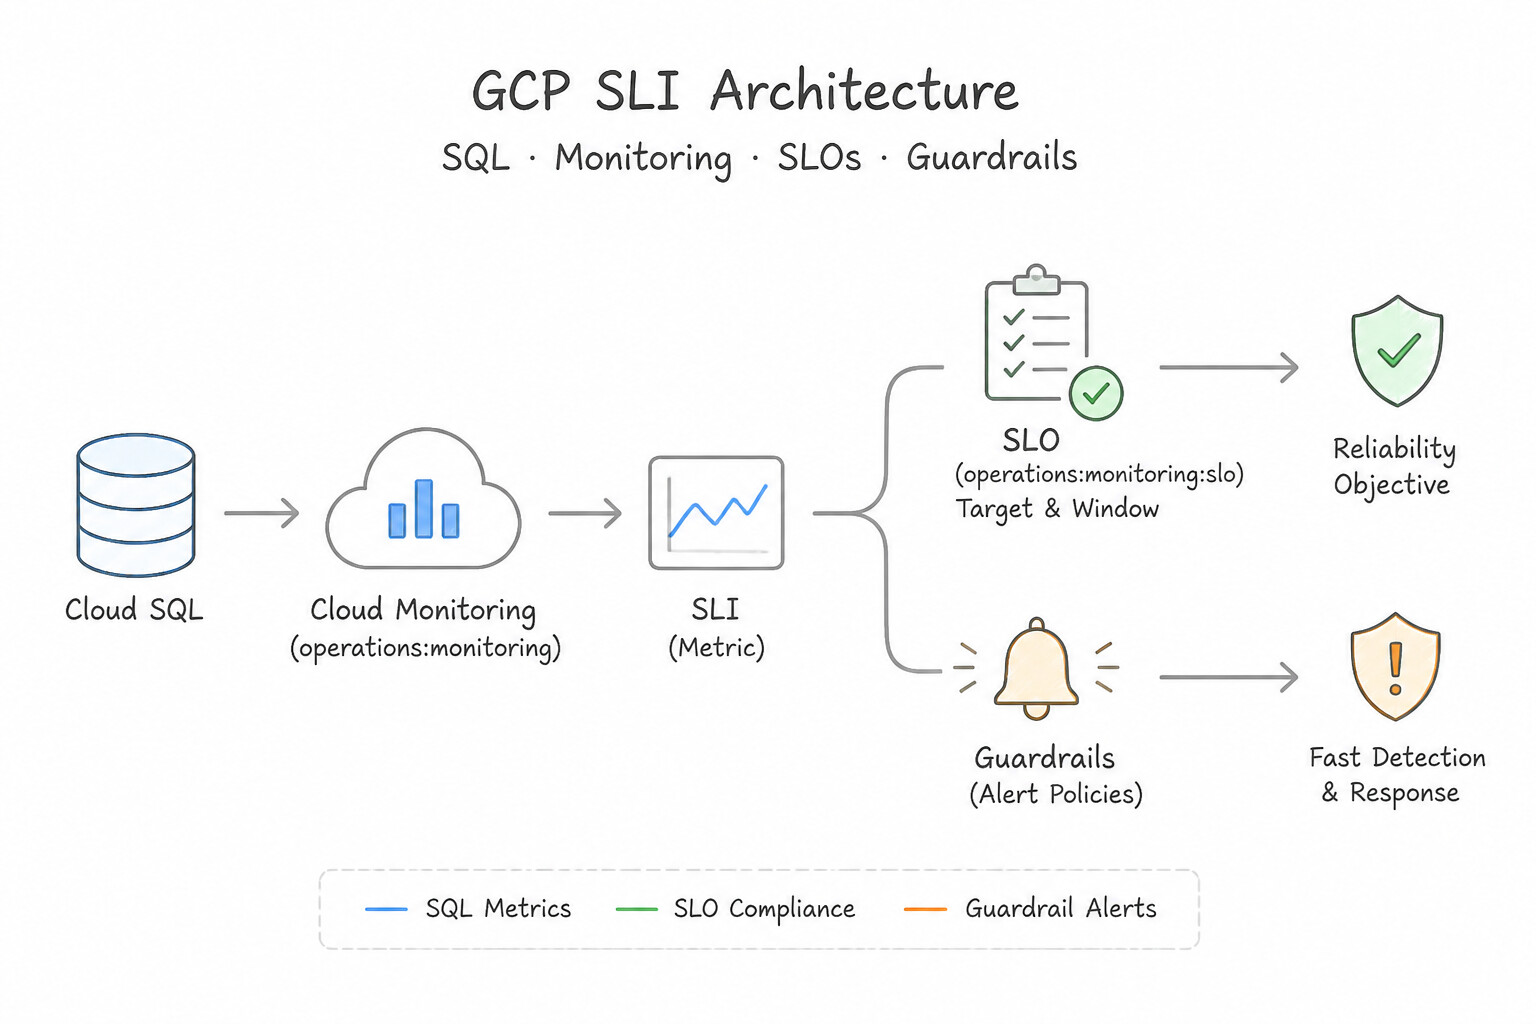
- SLI (Service Level Indicator): The quantitative telemetry metric measuring user-visible behavior—specifically Availability SLI (ratio of successful database queries to total queries) and Latency SLI (proportion of queries completing faster than threshold, e.g.,
$p99< 20\text{ ms}$). - SLO (Service Level Objective): The internal reliability target set stricter than the external SLA (e.g., if the external customer SLA is $99.9\%uptime, set the internal database **SLO** to **@@ESCAPEDDOLLAR@@99.95%** so on-call engineers are alerted before the legal SLA is breached!).
- Error Budget: $100\% - \text{SLO}(e.g., a @@ESCAPEDDOLLAR@@99.95% monthly SLO gives an Error Budget of ~21.6 minutes of allowable downtime/error per month).
- Error Budget Burn-Rate Alerting:
- Configure Cloud Monitoring SLO Tracking and Burn-Rate Alerts: trigger a Fast-Burn Pager Alert if the database is consuming its monthly error budget at >10x normal speed (indicating an active outage), and a Slow-Burn Ticket Alert if elevated tail latency or minor errors threaten to exhaust the budget before the end of the 30-day window. When the Error Budget is exhausted, freeze risky schema/feature releases and prioritize reliability fixes!
Key Implementation Patterns
- Defining SLOs as Code (IaC): Use Define a google_monitoring_slo resource in Terraform that targets the Cloud SQL service. Terraform allows you to define and automate SLO creation as code, ensuring consistency across all databases. (Avoid alternative: Manual configuration is not scalable and violates the requirement for automation.)
- Alerting on Error Budget Burn Rate: Use Create an SLO-based alert policy that monitors the burn rate over a short lookback window. Burn rate alerts specifically measure the speed at which the error budget is consumed. (Avoid alternative: Static error counts do not account for traffic volume or the defined error budget.)
Key Takeaways (2.5d)
- SLOs should be treated as code (Monitoring as Code) to ensure consistency at scale.
- Manual configuration in the console is not suitable for large environments.
- Terraform provides specific resources like
google_monitoring_sloto automate reliability tracking.- SLOs define the reliability target (e.g., 99.9%).
Quick Decision Cheat Sheet (Subsection 2.5)
If the Scenario Requires... | Choose This Google Cloud Pattern | Avoid This Common Mistake |
|---|---|---|
"Reclaim dead tuple space and update planner stats in PostgreSQL without blocking traffic" | Standard VACUUM + ANALYZE (and tune Autovacuum) | VACUUM FULL (blocks all reads and writes with an ACCESS EXCLUSIVE lock) |
"Rebuild a bloated PostgreSQL index online without locking writes" | REINDEX INDEX CONCURRENTLY | Standard REINDEX or DROP INDEX + CREATE INDEX |
"Schedule recurring in-database SQL maintenance or partition creation in PostgreSQL / AlloyDB" | Enable pg_cron (and pg_partman for partitions) | Deploying an external Kubernetes cluster just to run a 1-line SQL statement |
"Major version upgrade (e.g., MySQL 5.7 → 8.0 or Postgres 13 → 16) with near-zero downtime" | Blue-green continuous replication via Database Migration Service (DMS) | In-place major version upgrade (causes extended downtime) |
"Validate a major version upgrade safely before touching production" | Create a Cloud SQL Clone of production, run the upgrade on the clone, and run application tests | Upgrading production directly during a maintenance window without testing extensions |
Further Reading (Subsection 2.5)
- Cloud SQL PostgreSQL Extensions — Provides a list of supported extensions for Cloud SQL for PostgreSQL, including pg_cron.
- Configure PostgreSQL extensions — Specific documentation on how to enable and use pg_cron within Cloud SQL to schedule maintenance tasks.
- About Time to Live (TTL) — Provides an overview of TTL in Cloud Spanner, explaining how Row Deletion Policies allow you to automatically delete expired data.
- Exporting data from Cloud SQL — Describes how to export data from Cloud SQL to Cloud Storage using the Console, gcloud, or API.
- Scheduling Cloud SQL exports using Cloud Functions and Cloud Scheduler | Google Cloud Blog — A tutorial explicitly demonstrating how to use Cloud Scheduler to call the Cloud SQL Admin API for automated backups or exports.
- Scheduling Cloud SQL exports using Cloud Scheduler — Documentation describing how to export data from Cloud SQL. While the specific tutorial might use different compute options, the concept of using the API for exports is key.
Book TOC · Previous · Chapter 4 of 6 · Next
AwesomeGCP.com Learning
The approach taken is a question-led learning approach: you explore realistic project scenarios where you need to make decisions or take actions to achieve business goals within specific constraints. Instead of passive learning, you are challenged to think and work through the options to master the Professional Cloud Database Engineer (PDBE) certification!