Book TOC · Previous · Chapter 6 of 7 · Next
Chapter 6: Production Observability, OpenTelemetry Distributed Tracing & AI-Assisted Troubleshooting
Chapter Focus: Structured JSON logging (
tracecorrelation), OpenTelemetry instrumentation, Cloud Trace latency waterfalls, Cloud Profiler flame graphs, Error Reporting, and Gemini Cloud Assist.
Subsection 4.3: Troubleshooting and observability
The Big Picture
When a monolith fails, a single stack trace in one file tells you what broke. When a request flows across an API Gateway, three Cloud Run microservices, a Pub/Sub topic, and Cloud Spanner, and p99 latency suddenly jumps from 120ms to 4.5 seconds for 3% of users, traditional plaintext logging leaves you completely blind. Subsection 4.3 tests whether you can engineer a complete observability pipeline across five pillars:
- The Unstructured Plaintext Log Trap (
4.3a,4.3c): Printing multiline plaintext strings (console.log("Error for user " + uid)) tostdout. Cloud Logging treats each newline as a separateDEFAULT-severity log entry, breaking stack traces into 20 disconnected lines and preventing field-based filtering (jsonPayload.user_id="123") and automatic Error Reporting exception grouping. - Broken Distributed Trace Context Across Hops (
4.3a,4.3d): Instrumenting microservices with OpenTelemetry or Cloud Trace, but forgetting to propagate thetraceparent(W3C Trace Context) orX-Cloud-Trace-ContextHTTP header on outboundfetch/grpcrequests—and forgetting to inject thelogging.googleapis.com/tracefield into structured JSON logs. Without header propagation, a single user checkout splinters into 5 unlinked single-service traces, and clicking a slow span in Cloud Trace shows zero associated logs! - Confusing Latency Tracing (
Cloud Trace) with Code-Level CPU/Heap Hotspots (Cloud Profiler) (4.3b): Using Cloud Trace to figure out which line of Go/Java code is burning 90% CPU or leaking memory (Cloud Trace shows RPC/span duration across services, whereas Cloud Profiler uses low-overhead continuous statistical sampling to render flame graphs of exact functions, CPU time, and heap allocations). - Ignoring AI-Assisted Root-Cause Synthesis (4.3e): Spending 45 minutes manually correlating log fields, metric spikes, and deployment revisions during an incident instead of using Gemini Cloud Assist in Google Cloud Observability to summarize log anomalies, explain cryptic GKE/Cloud Run error codes, and generate Log Analytics (SQL) / PromQL queries.
Consideration 4.3a: Instrumenting code to facilitate troubleshooting using metrics, logs, and traces in Google Cloud Observability
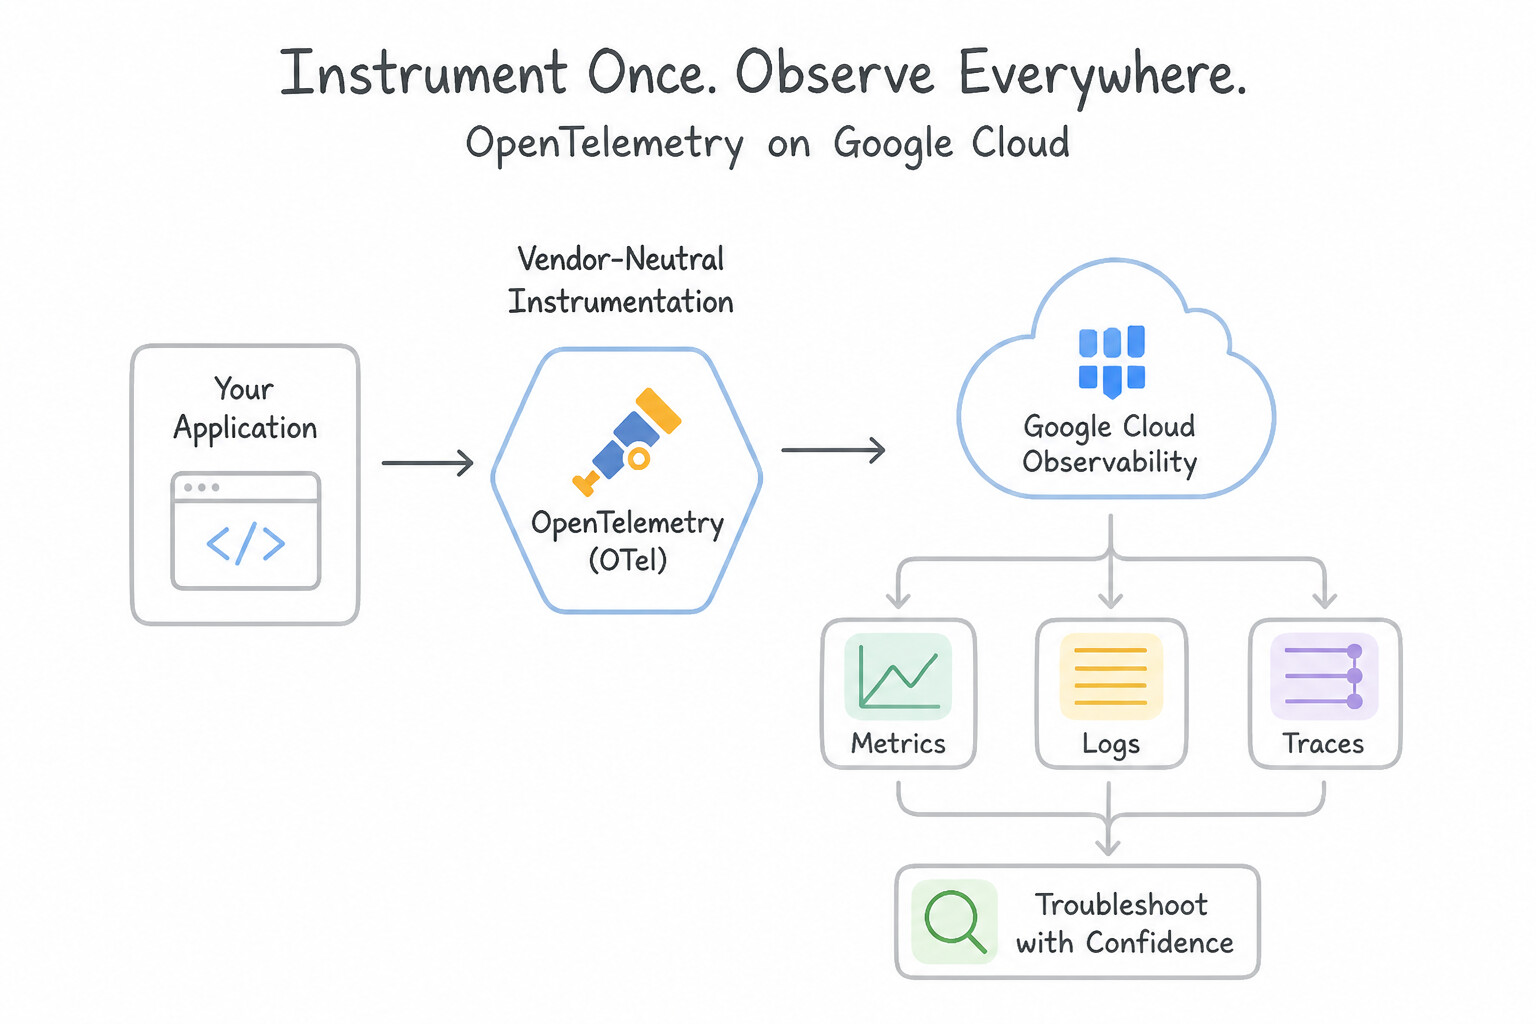
- Vendor-Neutral Instrumentation with OpenTelemetry (
OTel): Google Cloud natively supports OpenTelemetry as the standard SDK for capturing distributed traces, custom application metrics, and logs across Python, Go, Java, Node.js, and .NET, exporting telemetry directly to Cloud Trace, Cloud Monitoring, and Cloud Logging (or via the Google Cloud Ops Agent / OpenTelemetry Collector on GKE and Compute Engine). - Structured JSON Logging Special Fields (Memorize These!):
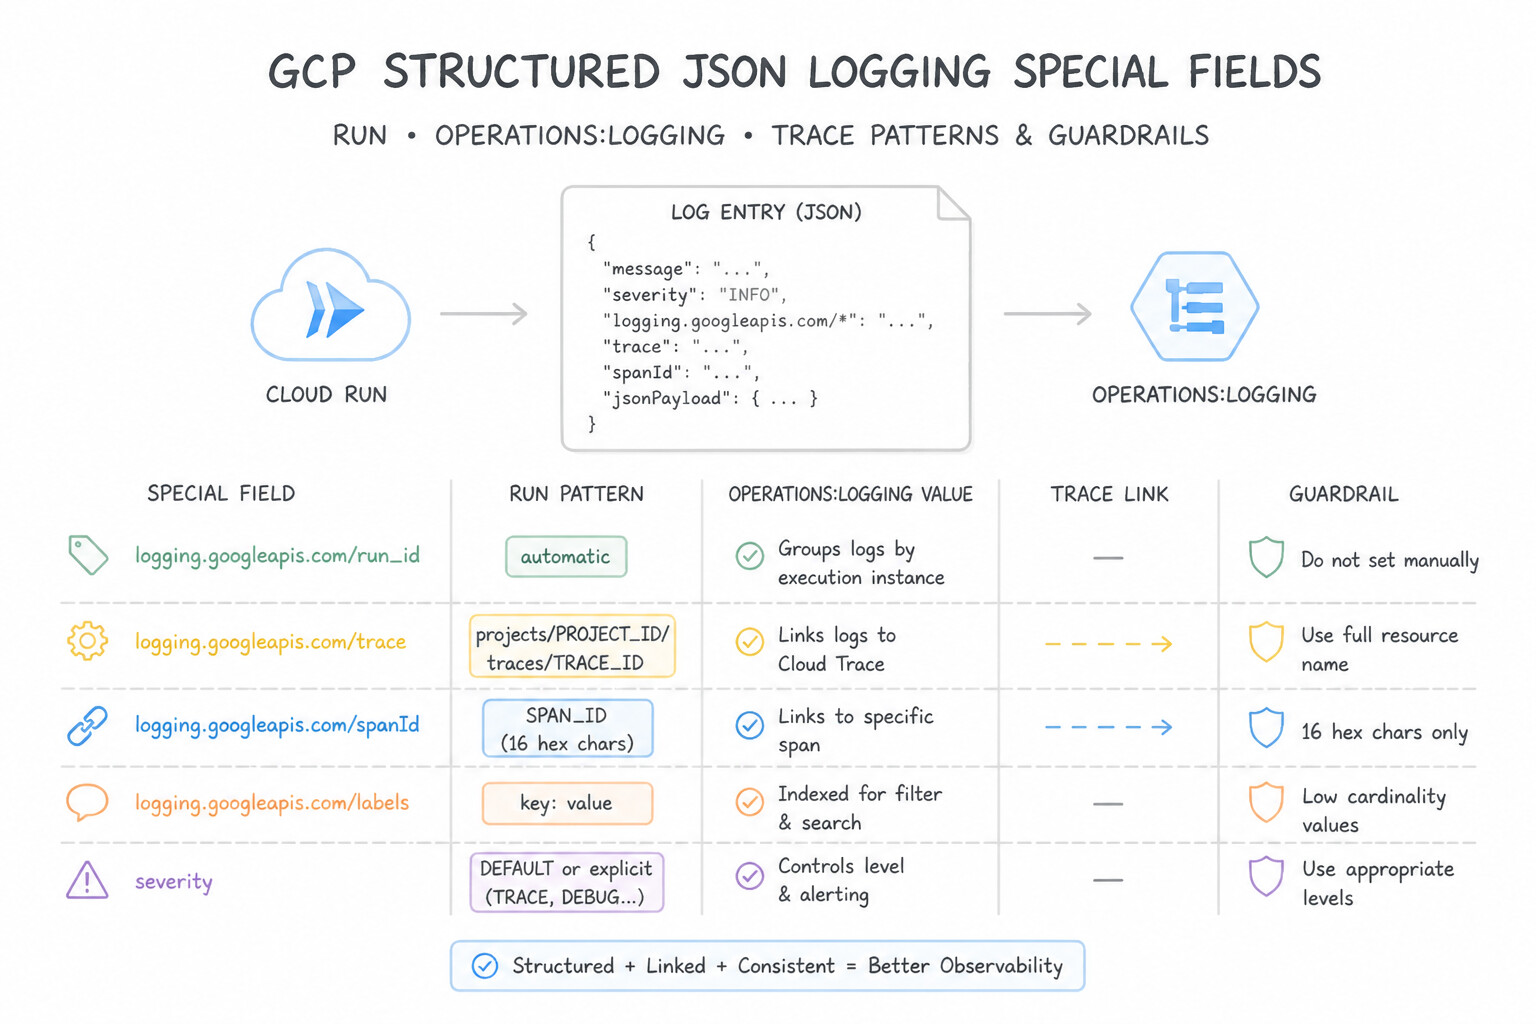
- When your application writes a single-line JSON object to
stdoutorstderr, the built-in logging agent on Cloud Run, GKE, and Cloud Functions automatically parses it intojsonPayload(instead oftextPayload) and maps special keys to top-levelLogEntrymetadata: severity: (DEBUG,INFO,NOTICE,WARNING,ERROR,CRITICAL,ALERT,EMERGENCY) — enables severity filtering and Error Reporting detection.message: The primary human-readable log summary shown in Logs Explorer.logging.googleapis.com/trace: Formatted asprojects/PROJECT_ID/traces/TRACE_ID— links the log entry directly inside the Cloud Trace waterfall view!logging.googleapis.com/spanId: Hex span ID linking the log to the exact child span.httpRequest: Structured object (requestMethod,requestUrl,status,latency) enabling automatic HTTP latency sorting.
Key Implementation Patterns
- Correlating Logs and Traces: Use Modify the application logging code to output JSON. Include the current trace ID in the "logging.googleapis.com/trace" field. Output logs as JSON and include the trace ID in the specific
logging.googleapis.com/tracefield to enable automatic correlation. - Custom Metrics Instrumentation: Use Use the Cloud Monitoring client library to create a custom metric. Instrument your code to write data to this metric. Custom metrics allow you to instrument application code to track specific business data like sales counts. (Avoid alternative: The Ops Agent collects infrastructure metrics (CPU, Memory), not application-specific business metrics.)
- Structured Logging for Querying: Use Update the application code to output log entries as serialized JSON objects. Structured logging (JSON) allows Cloud Logging to parse fields automatically, enabling precise and efficient filtering. (Avoid alternative: Saved searches do not change the underlying data structure, leaving the filtering inefficient.)
Key Takeaways (4.3a)
- Cloud Run captures stdout/stderr automatically, but JSON format (Structured Logging) unlocks advanced features.
- To correlate logs with traces, you must inject the
logging.googleapis.com/tracefield into your JSON logs.- The trace field value must include the project ID:
projects/[PROJECT_ID]/traces/[TRACE_ID].- Plain text logs cannot be automatically correlated with traces by the Cloud Console UI.
Consideration 4.3b: Identifying and resolving issues using Google Cloud Observability
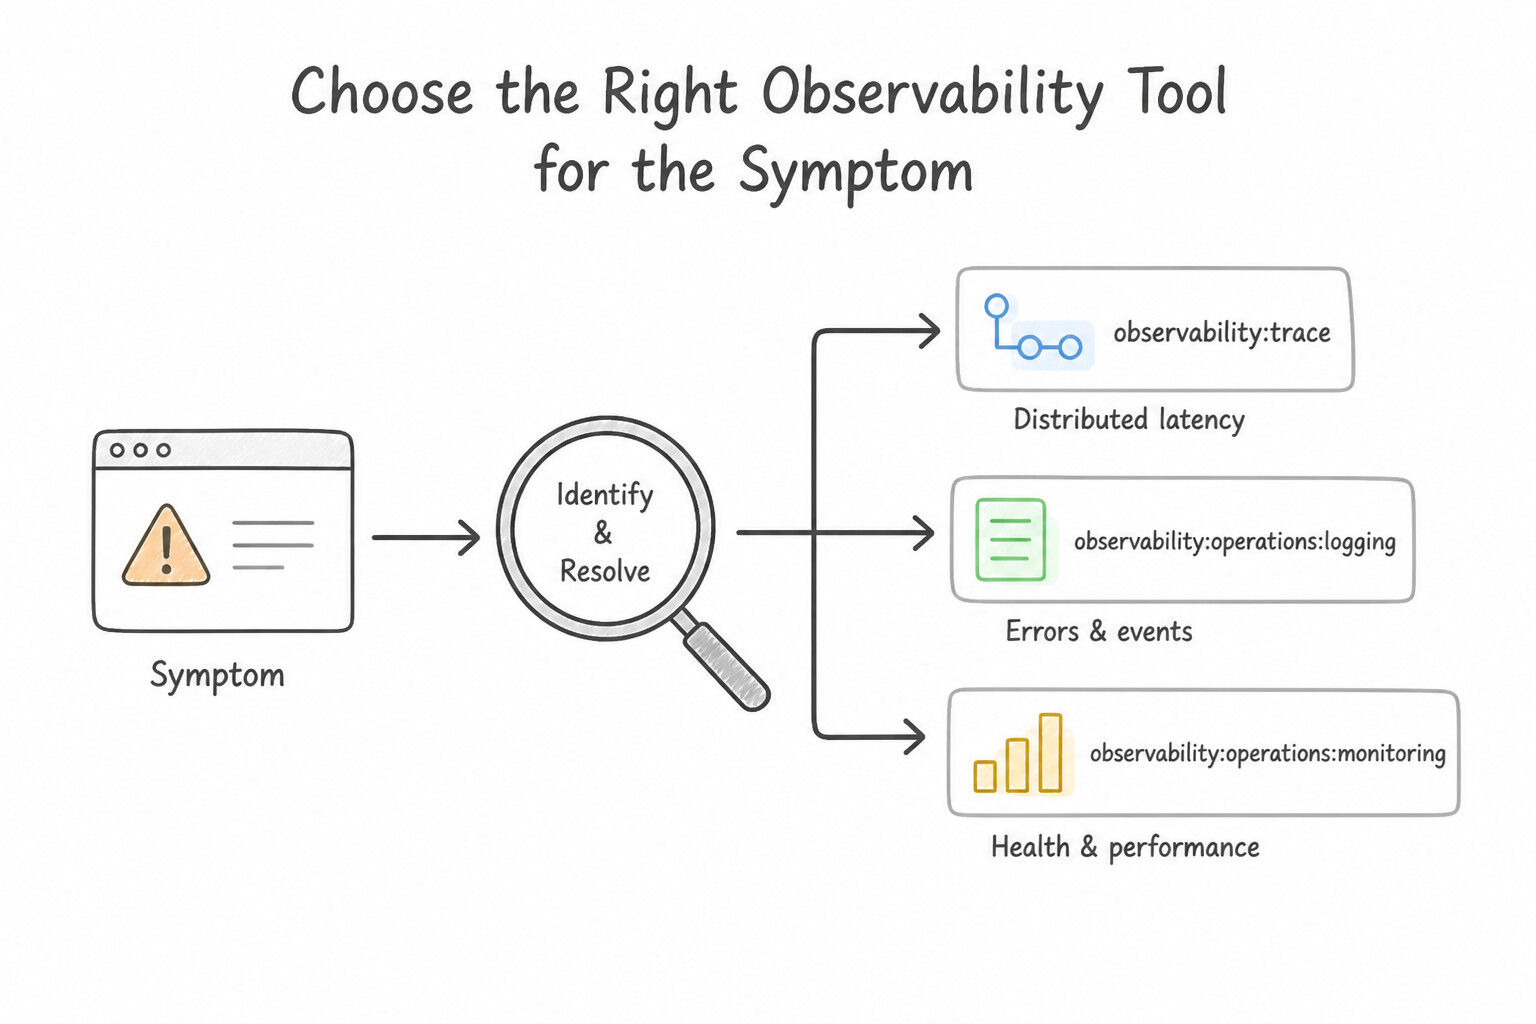
- Choosing the Right Observability Tool for the Symptom:
- "Which microservice or database query in an end-to-end checkout request is causing high latency?" → Cloud Trace (waterfall latency graph across services).
- "Why is my Go/Java/Python container on GKE consuming 95% CPU or leaking heap memory in production?" → Cloud Profiler (continuous low-overhead statistical profiling rendering flame graphs where bar width = percentage of total CPU time or memory allocated by that function call path).
- "Is our public web frontend reachable from Europe, Asia, and North America right now?" → Cloud Monitoring Global Uptime Checks paired with an Alerting Policy.
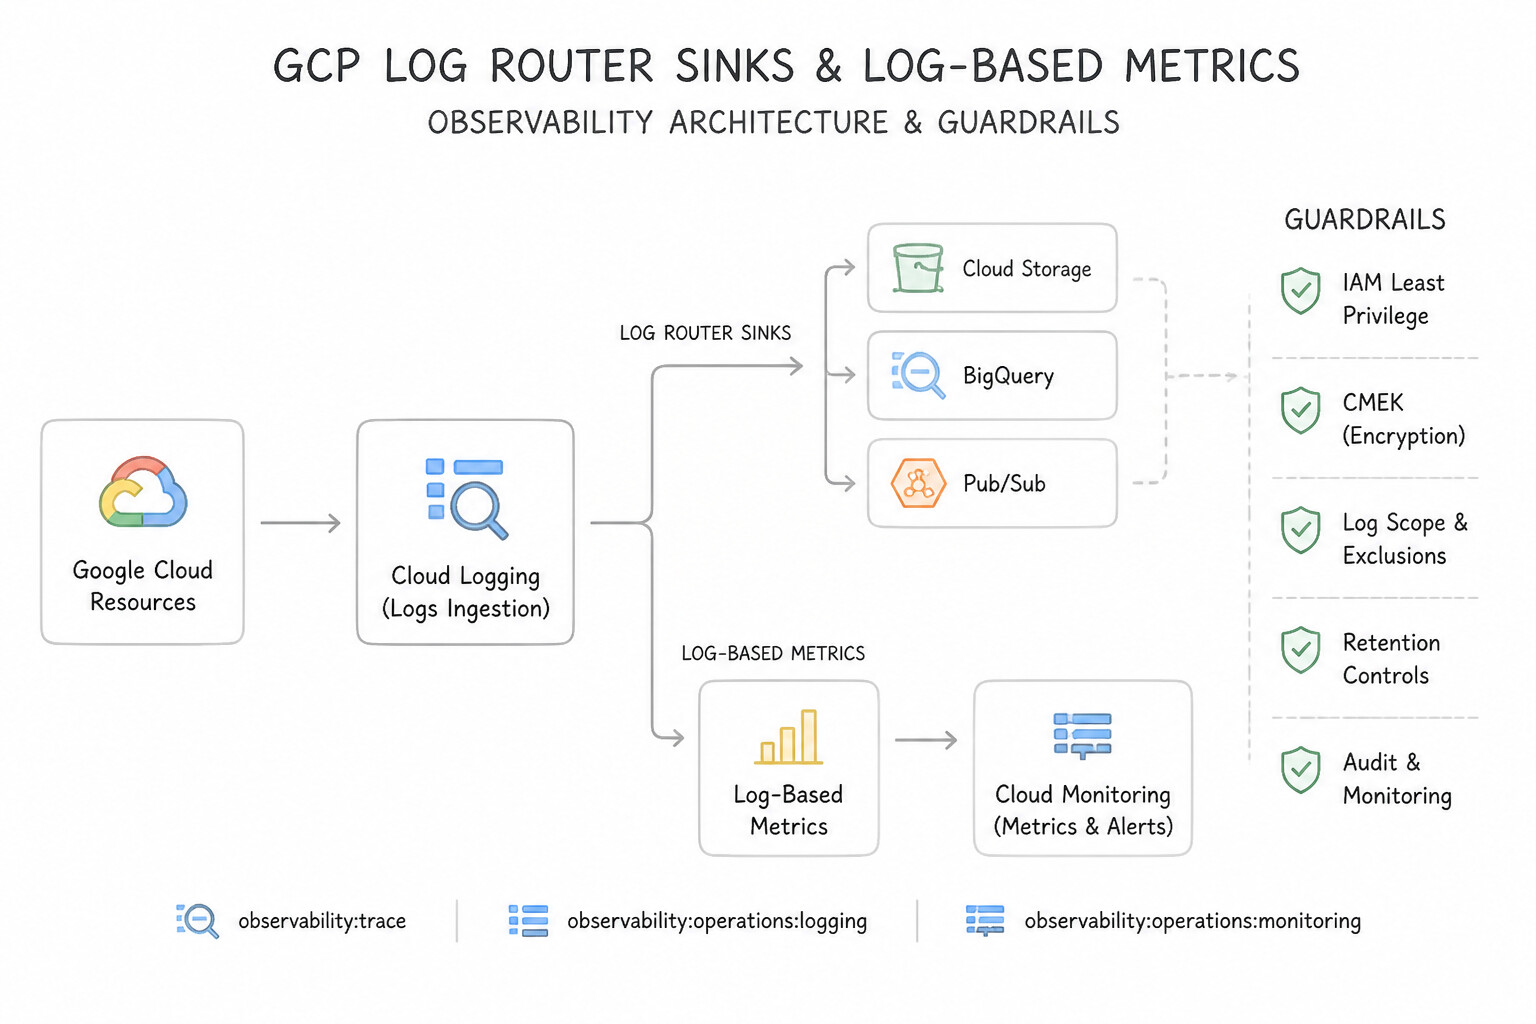
- Log Router Sinks & Log-Based Metrics:
- Log-Based Metrics: Turn matching log entries (e.g.,
jsonPayload.payment_status="DECLINED") into a counter or distribution metric in Cloud Monitoring for dashboards and alerting. - Log Router Sinks: Route logs matching an inclusion filter to:
- Cloud Storage (
Archive/Coldlinebucket with Locked Retention Policy): Lowest-cost long-term compliance archiving (e.g., 7-year HIPAA/PCI audit logs). - BigQuery: Rich SQL analytics and cross-table joins across millions of log events.
- Cloud Pub/Sub: Real-time streaming to external SIEM tools (Splunk/Datadog) or automated security remediation functions.
Key Implementation Patterns
- Identifying Latency in Microservices: Use Use Cloud Trace to analyze the request latency and visualize the call chain across the microservices. Cloud Trace provides distributed tracing and waterfall views to pinpoint latency bottlenecks in microservices architectures. (Avoid alternative: Cloud Logging is used for analyzing text-based logs and errors, not for visualizing latency distribution across microservices.)
- Debugging High CPU Costs: Use Install the Cloud Profiler agent in your application to collect CPU usage data. Cloud Profiler provides low-overhead, continuous profiling suitable for production to identify resource-intensive functions. (Avoid alternative: Logging every function call creates high performance overhead and produces data that is difficult to analyze for CPU profiling.)
Key Takeaways (4.3b)
- Use Cloud Logging for analyzing specific error messages and event logs.
- Use Cloud Monitoring for tracking system health and resource metrics like CPU and memory.
- Use Cloud Trace for analyzing latency and visualizing request paths in distributed microservices.
- Use Cloud Profiler for optimizing code-level resource consumption (CPU/Memory) within a service.
Consideration 4.3c: Managing application issues using Error Reporting
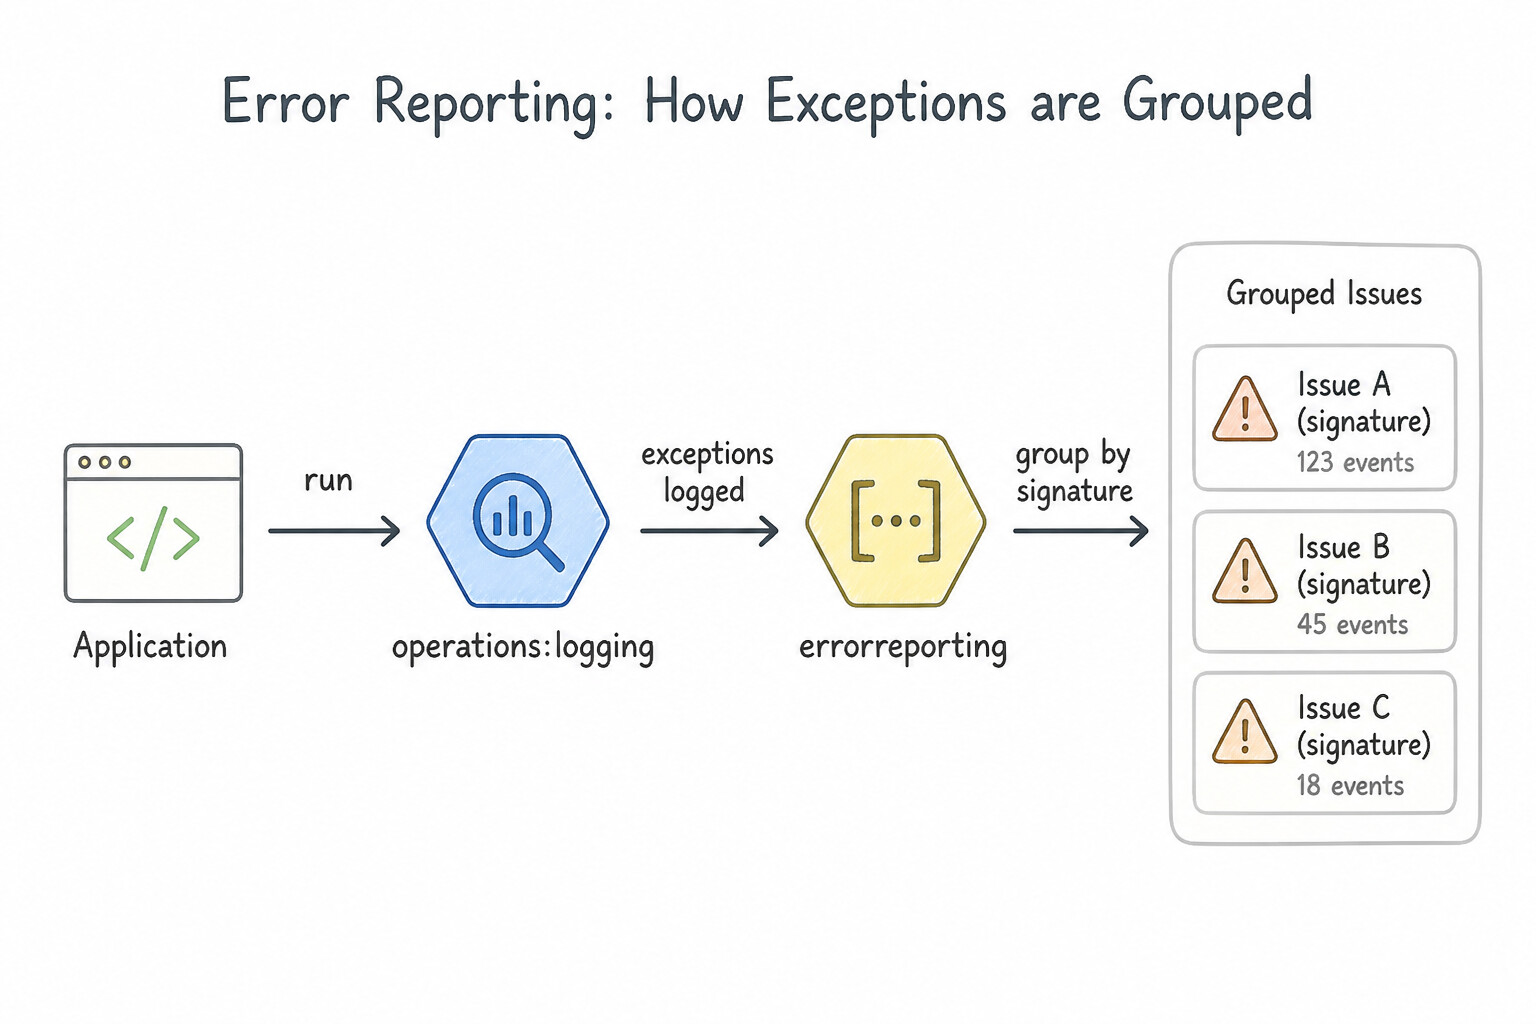
- How Error Reporting Groups Exceptions: Error Reporting continuously scans log streams, parses stack traces by language framework, groups billions of identical crashes into deduplicated Error Issues, tracks first-seen/last-seen versions and occurrence counts, links directly to source code repositories, and sends alerts when a brand-new exception appears after a deployment.
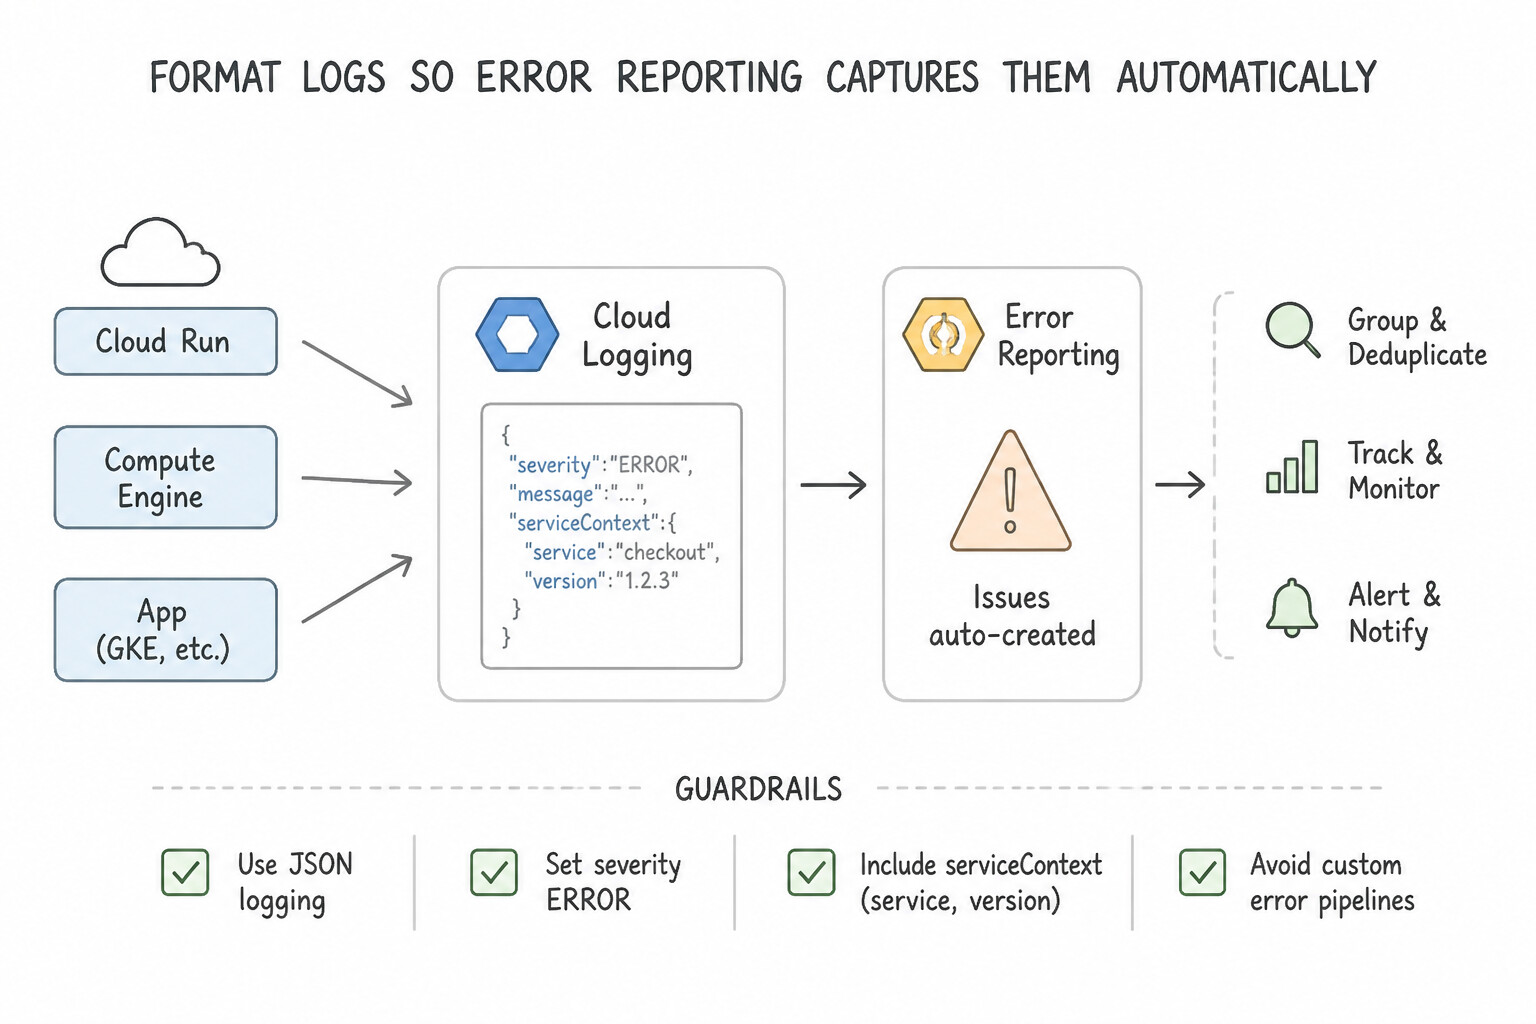
- Formatting Logs So Error Reporting Captures Them Automatically:
- If a Node.js or Python app on GKE prints a multiline stack trace as plain text without formatting, GKE's container log driver splits every line into a separate log entry, and Error Reporting fails to recognize it!
- To guarantee automatic ingestion into Error Reporting from
stdout/stderr: emit a single-line structured JSON log withseverity: "ERROR"(or higher) AND include the full formatted stack trace instack_trace(ormessage/exception), or set"@type": "type.googleapis.com/google.devtools.clouderrorreporting.v1beta1.ReportedErrorEvent"along withserviceContext: {"service": "...", "version": "..."}.
Key Implementation Patterns
- Formatting Logs for Error Reporting on Cloud Run: Use Change the log output to a JSON object with the stack trace in the
messagefield. Structured JSON logging with amessagefield allows Error Reporting to parse stack traces automatically. (Avoid alternative: Cloud Run is a managed service that does not support installing agents manually.) - Configuring Error Notifications: Use Select 'Turn on notifications' in the Error Reporting list page. Error Reporting native notifications alert only on new error groups, not every occurrence. (Avoid alternative: Log-based alerts trigger on query matches (every error) rather than grouping them.)
- Manual Error Reporting via Client Libraries: Use Use the Error Reporting client library to call report_exception within the except block. The client library allows manual reporting of handled exceptions without crashing the app. (Avoid alternative: Standard output is treated as INFO level logging, which Error Reporting ignores.)
Key Takeaways (4.3c)
- Cloud Run captures stdout and stderr automatically.
- Plain text logs may not be correctly parsed by Error Reporting.
- Structured Logging (JSON) is preferred over plain text for programmatic analysis.
- To trigger Error Reporting via logs, the JSON object must contain the stack trace in the
messagefield.
Consideration 4.3d: Using trace IDs to correlate trace spans across services
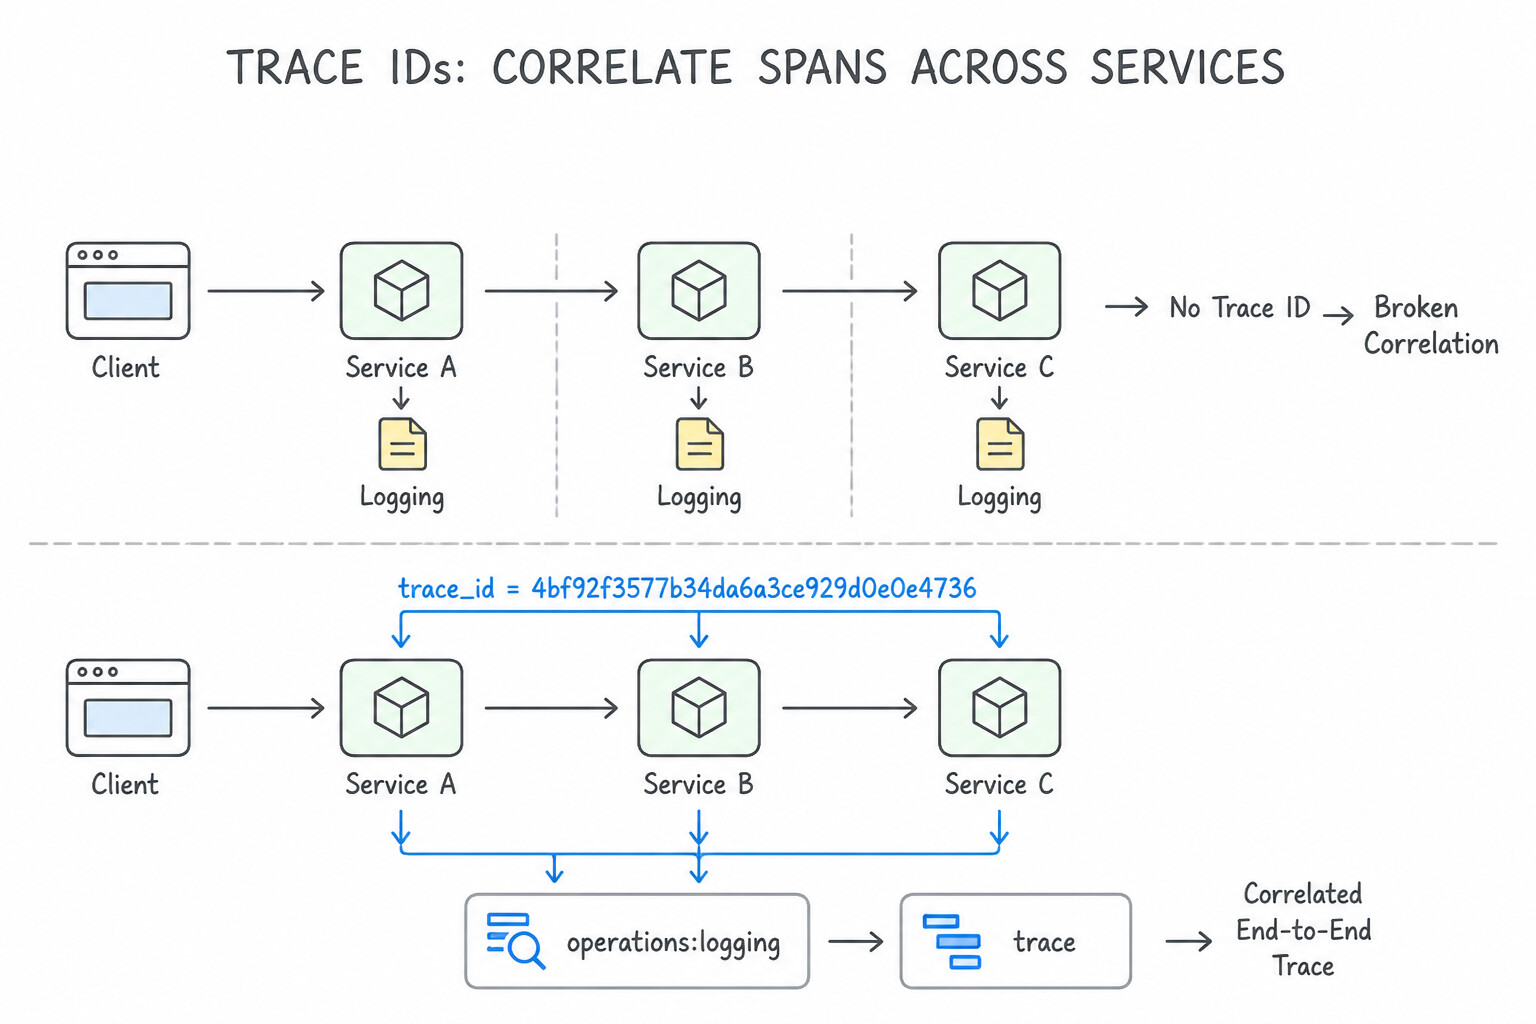
- Why Distributed Traces Break Across Microservice Hops: Cloud Load Balancing and Cloud Run automatically generate a root trace header on incoming requests, but they do not magically copy that header into your application's outbound
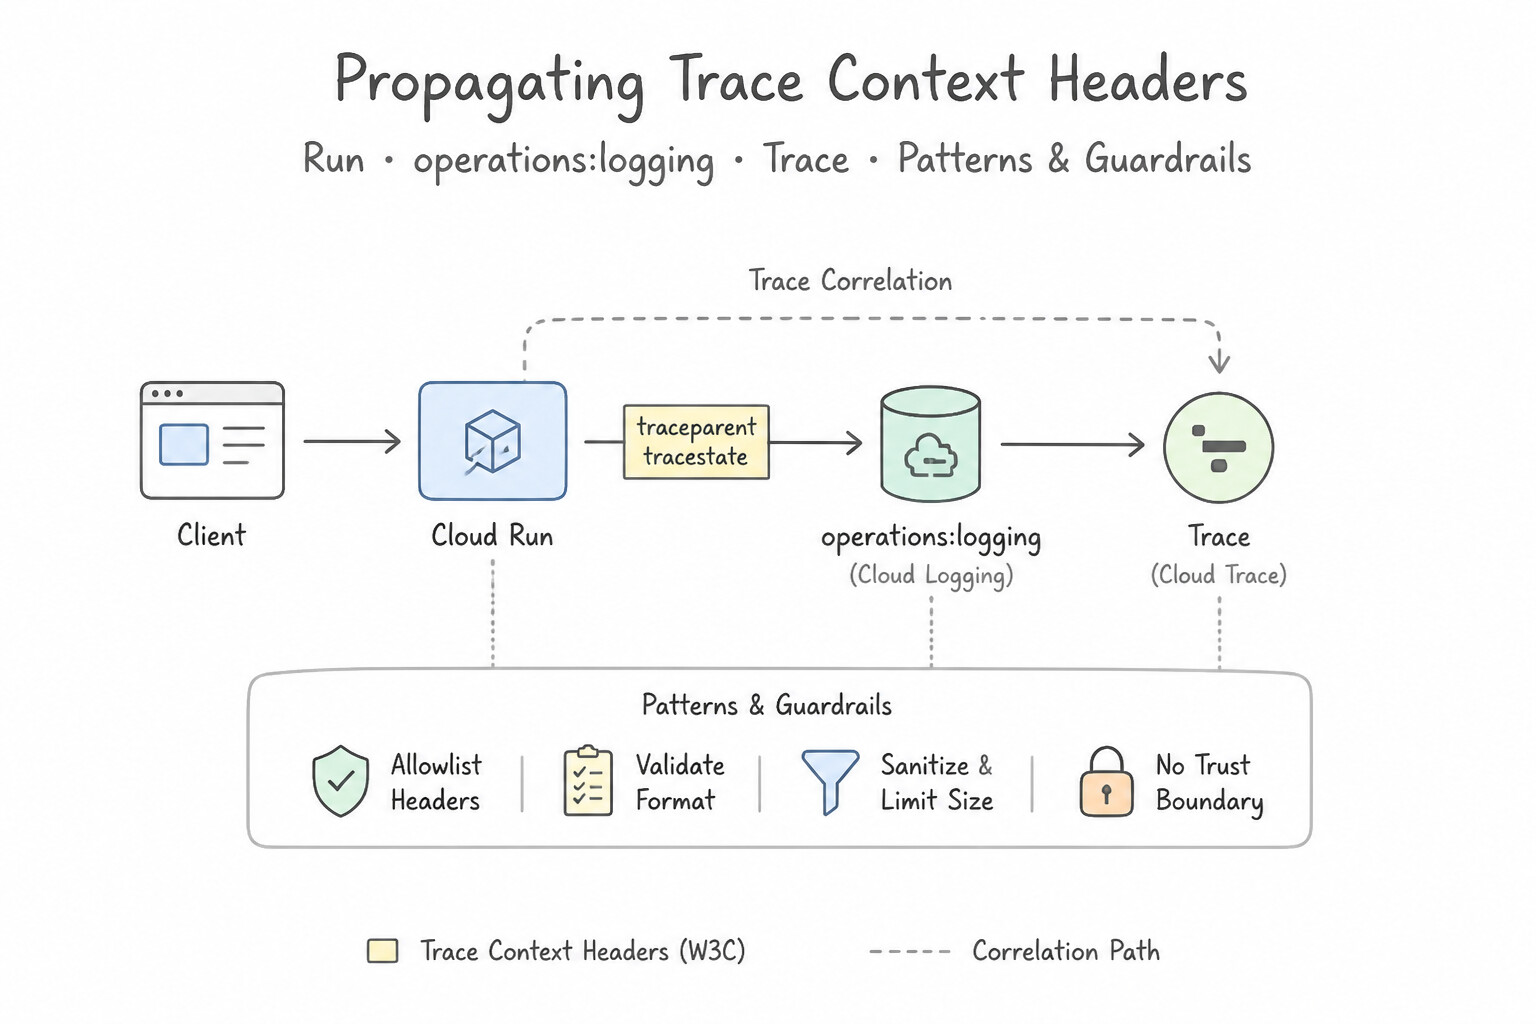
http.get()orfetch()calls! - Propagating Trace Context Headers:
- Your application code (or OpenTelemetry HTTP/gRPC auto-instrumentation interceptor) must extract the incoming trace header—either the W3C standard
traceparent(00-<trace-id>-<span-id>-<flags>) or Google'sX-Cloud-Trace-Context(TRACE_ID/SPAN_ID;o=TRACE_TRUE)—and inject it into the HTTP headers of every outbound request to downstream services. - For asynchronous Pub/Sub hops, pass the
traceparentcontext inside Pub/Sub message attributes so the subscriber can link its processing span back to the publisher's parent trace! - Adding Custom Child Spans for Internal Bottlenecks: By default, auto-instrumentation only creates spans for incoming/outgoing HTTP/gRPC requests. If a single microservice takes 3 seconds internally (e.g., running an image resize, regex parse, or local cache serialization) and shows up as one giant opaque block in Cloud Trace, use the OpenTelemetry / Cloud Trace SDK (
tracer.start_as_current_span("resize_image")) to wrap internal functions in custom child spans.
Key Implementation Patterns
- Correlating Logs and Traces in Structured Logging: Use Add a
logging.googleapis.com/tracefield to the JSON log object with the valueprojects/[PROJECT_ID]/traces/[TRACE_ID]. Structured logs must include thelogging.googleapis.com/tracefield with the full trace resource path to correlate with Cloud Trace. - Standardizing Header Formats (W3C vs. B3): Use Configure the OpenTelemetry services to use a composite propagator that supports both W3C Trace Context and B3 headers. Configuring propagators to accept both header formats ensures the new system can understand trace context sent by the legacy system.
- Propagating Context via Pub/Sub Attributes: Use Modify Service A to inject the trace context into the Pub/Sub message attributes. Modify Service B to extract this context and use it to start the span. You must manually propagate the trace context via message attributes to link traces across Pub/Sub boundaries.
Key Takeaways (4.3d)
- Cloud Run automatically captures stdout as logs; JSON format allows for structured logging.
- Correlation between Cloud Logging and Cloud Trace is not automatic for application logs; it requires explicit linking.
- Use the special JSON field
logging.googleapis.com/traceto provide the link.- The trace field value must use the full resource name format:
projects/[PROJECT_ID]/traces/[TRACE_ID].
Consideration 4.3e: Using Gemini Cloud Assist
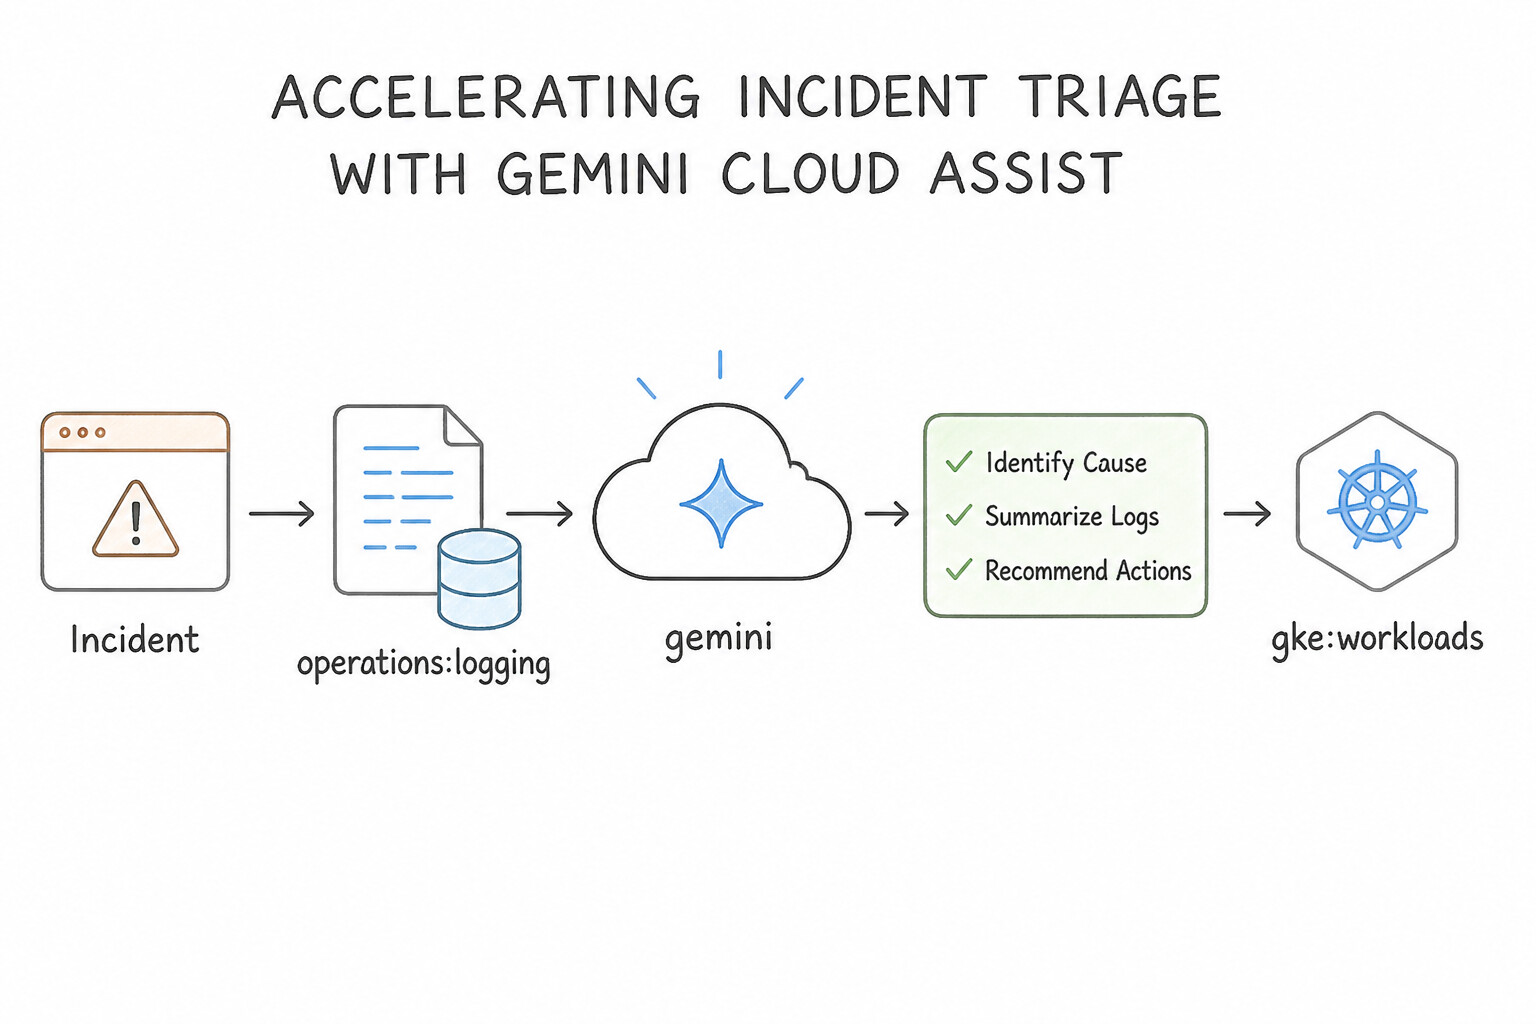
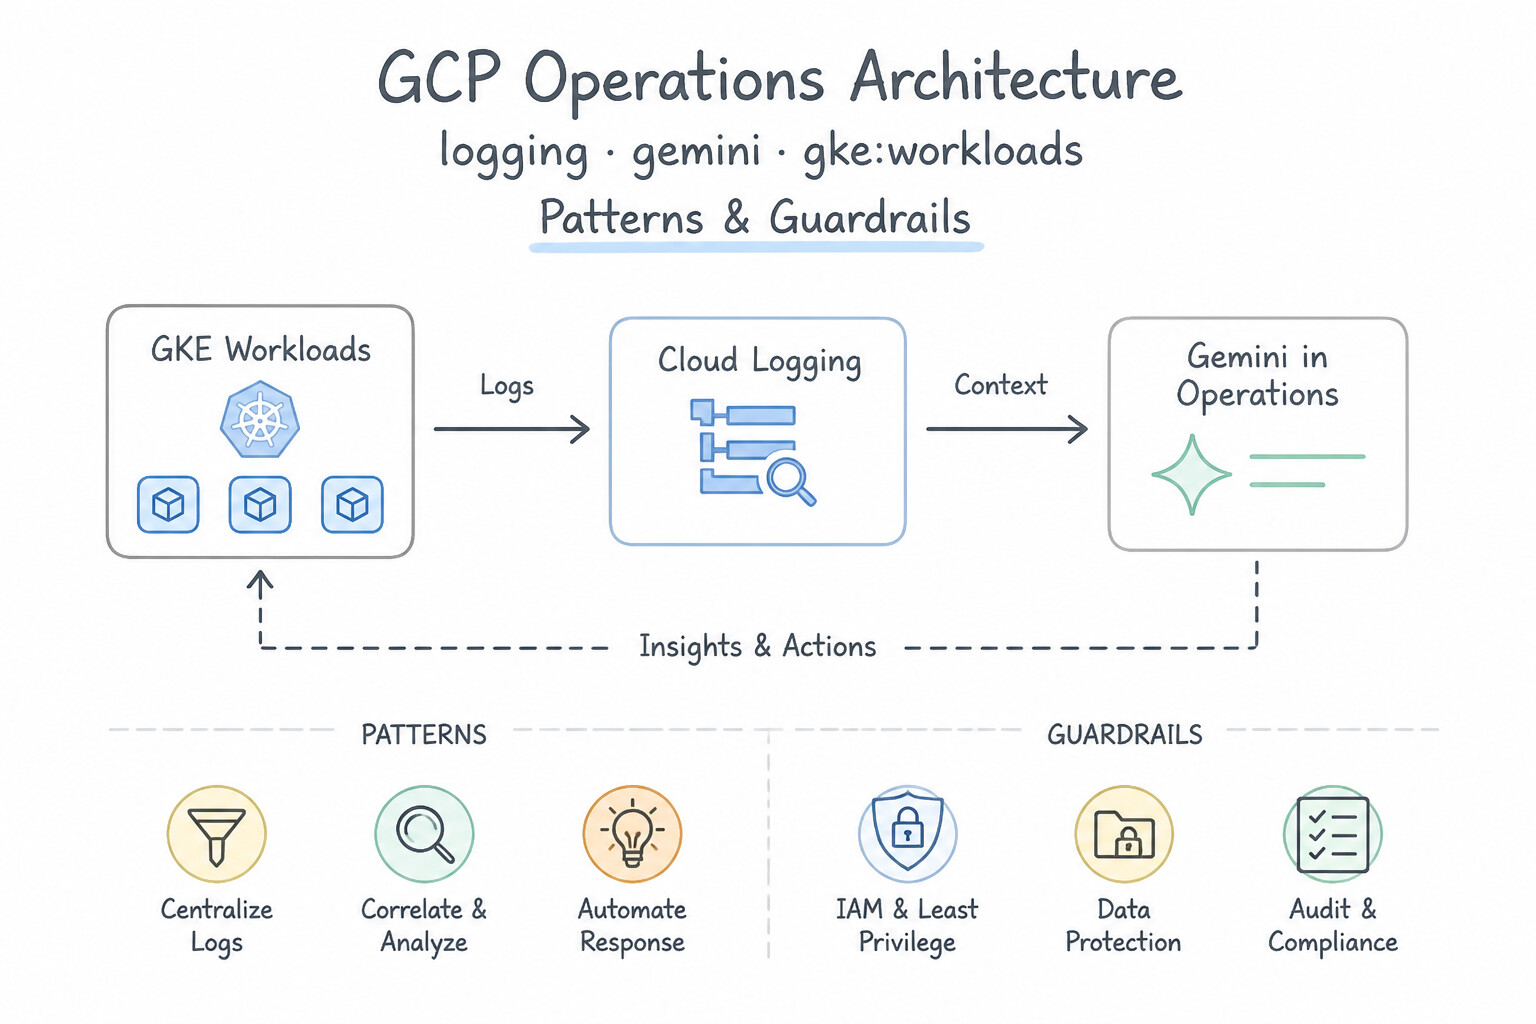
- Accelerating Incident Triage with Gemini Cloud Assist: Integrated directly into Logs Explorer, Cloud Monitoring, Cloud Trace, and Error Reporting, Gemini Cloud Assist provides four core developer capabilities:
- Log Entry & Stack Trace Summarization: Click "Explain this log entry" on a cryptic GKE, Cloud Run, or IAM audit log to get an immediate plain-English explanation of the root cause and exact remediation steps.
- Natural-Language Query Generation: Translate plain-English questions ("Show me all 5xx errors on the checkout service in the last 2 hours grouped by user region") into valid Logging query language, Log Analytics SQL, or PromQL.
- Cloud Assist Investigations (Root-Cause Correlation): Automatically correlates spikes in Cloud Monitoring error/latency metrics with recent Cloud Run revision / GKE deployment rollouts, Cloud Trace bottleneck spans, and Cloud Logging anomalies to pinpoint what changed when an incident started.
Key Implementation Patterns
- Log Entry Explanation: Use Select the log entry in the Logs Explorer and click "Explain this log entry" to generate an analysis. Gemini Cloud Assist provides an in-context 'Explain this log entry' feature to summarize errors and suggest fixes. (Avoid alternative: Searching external forums requires leaving the console and is less efficient than integrated tools.)
- Troubleshooting GKE Workloads: Use Use the Gemini Cloud Assist feature in the console to analyze the workload and explain the error. Gemini Cloud Assist provides AI-driven analysis and summarization of errors directly in the console. (Avoid alternative: Manual log inspection via CLI contradicts the requirement to avoid parsing raw logs.)
- Natural Language to Log Queries: Use Enter your request in natural language in the Gemini assistance pane within Logs Explorer to generate the query. Gemini in Logs Explorer translates natural language descriptions into valid Logging Query Language (LQL) syntax. (Avoid alternative: Error Reporting focuses on application crashes with stack traces, not necessarily standard HTTP 404 logs.)
Key Takeaways (4.3e)
- Gemini Cloud Assist is integrated into Logs Explorer to help interpret complex errors.
- The 'Explain this log entry' feature provides summaries and actionable fixes without leaving the console.
- Using integrated AI tools reduces context switching and accelerates troubleshooting compared to manual external searches.
- CrashLoopBackOff indicates a Pod is repeatedly failing to start.
Quick Decision Cheat Sheet (Subsection 4.3)
If the Scenario Requires... | Choose This Google Cloud Pattern | Avoid This Common Mistake |
|---|---|---|
"Filter Cloud Run logs in Logs Explorer by custom fields like order_id and customer_tier" | Write single-line structured JSON to stdout (parsed automatically into jsonPayload.order_id) | Writing unstructured plain text ( textPayload) and running slow regex searches |
"Waterfall graph in Cloud Trace shows 4 sequential 300ms database queries taking 1200ms total" | Refactor application code to execute the independent queries concurrently ( Promise.all / asyncio.gather / goroutines) or via a single batch/JOIN query | Adding more GKE nodes or increasing Cloud Run CPU (does not fix sequential network round-trip waits!) |
"See fine-grained timing of 3 internal helper functions inside a single microservice span in Cloud Trace" | Instrument the internal functions with custom child spans using the OpenTelemetry / Cloud Trace SDK | Adding time.sleep() or relying only on load-balancer HTTP logs |
"Alert the on-call team immediately whenever a public web application stops responding from external regions" | Configure a Cloud Monitoring Global Uptime Check + Alerting Policy | Checking only container CPU utilization (a deadlocked server can sit at 1% CPU while returning 502s!) |
"Quickly diagnose a complex multi-service incident and generate Log Analytics SQL queries using natural language" | Use Gemini Cloud Assist in Google Cloud Observability | Manually exporting gigabytes of logs to CSV for local spreadsheet inspection |
Further Reading (Subsection 4.3)
- Correlate log entries — This guide explains exactly how to create JSON-formatted logs with the correct trace field to enable correlation in Cloud Run.
- Structured logging — Provides an overview of how special fields in JSON payloads are interpreted by Cloud Logging.
- User-defined metrics overview — Provides the official definition of user-defined (custom) metrics, explaining that they are metrics you define and write time-series data for using the API.
- Creating custom metrics — A guide on how to programmatically create and write data to custom metrics using client libraries.
- Cloud Trace overview — Explains how Cloud Trace collects latency data from applications and displays it in the Google Cloud console, helping to find performance bottlenecks.
- Microservices Observability — A blog post detailing how distributed tracing is essential for identifying latency issues in microservices architectures.
Book TOC · Previous · Chapter 6 of 7 · Next
AwesomeGCP.com Learning
The approach taken is a question-led learning approach: you explore realistic project scenarios where you need to make decisions or take actions to achieve business goals within specific constraints. Instead of passive learning, you are challenged to think and work through the options to master the Professional Cloud Developer (PCD) certification!