Book TOC · Previous · Chapter 7 of 8 · Next
Chapter 7: Operational Excellence, Google Cloud Observability, Release Management & Production SRE
Chapter Focus: Cloud Logging, Cloud Monitoring, Cloud Trace, Cloud Profiler, SLI/SLO error budgets, incident management escalation, and Customer Care support integration.
Subsection 6.2: Understanding the operational excellence pillar (6.1) & Familiarity with Google Cloud Observability solutions (6.2)
The Big Picture
In Section 6, Chapters 17 and 18 cover all six official subsections (6.1 through 6.6). This chapter (Chapter 17) unites Subsection 6.1 (Principles and Recommendations of the Operational Excellence Pillar of the Google Cloud Well-Architected Framework) and Subsection 6.2 (Familiarity with Google Cloud Observability Solutions: Monitoring, Logging, Profiling, Benchmarking, and Alerting Strategies).
Naive operations teams drown in alert fatigue: they page on-call engineers at 3:00 AM whenever a single spot VM hits 85% CPU for 60 seconds, while completely missing a subtle memory leak in a payment microservice (Cloud Profiler) or a $1.8\text{-second}$ latency regression across 6 gRPC hops (Cloud Trace). Mature Google Cloud architects instrument the Four Golden Signals, route logs cost-effectively at the Log Router before ingestion, and alert on symptom-based SLO burn rates rather than noisy infrastructure fluctuations.
Consideration 6.2a: Monitoring and logging
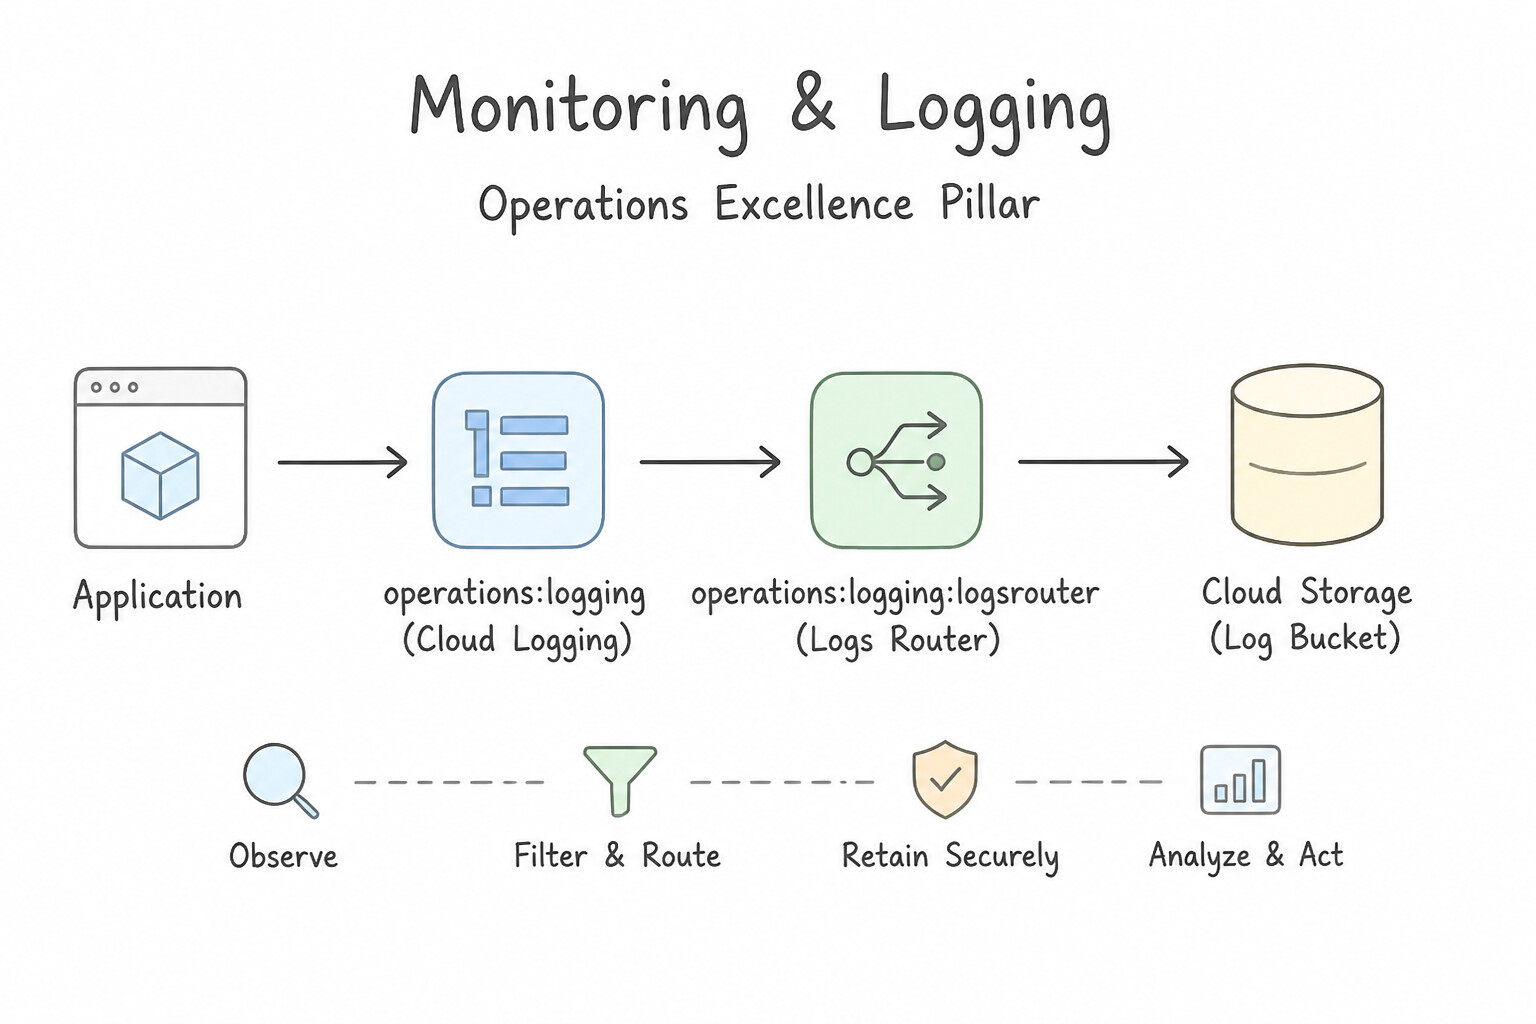
- Operational Excellence Pillar Principles (6.1):
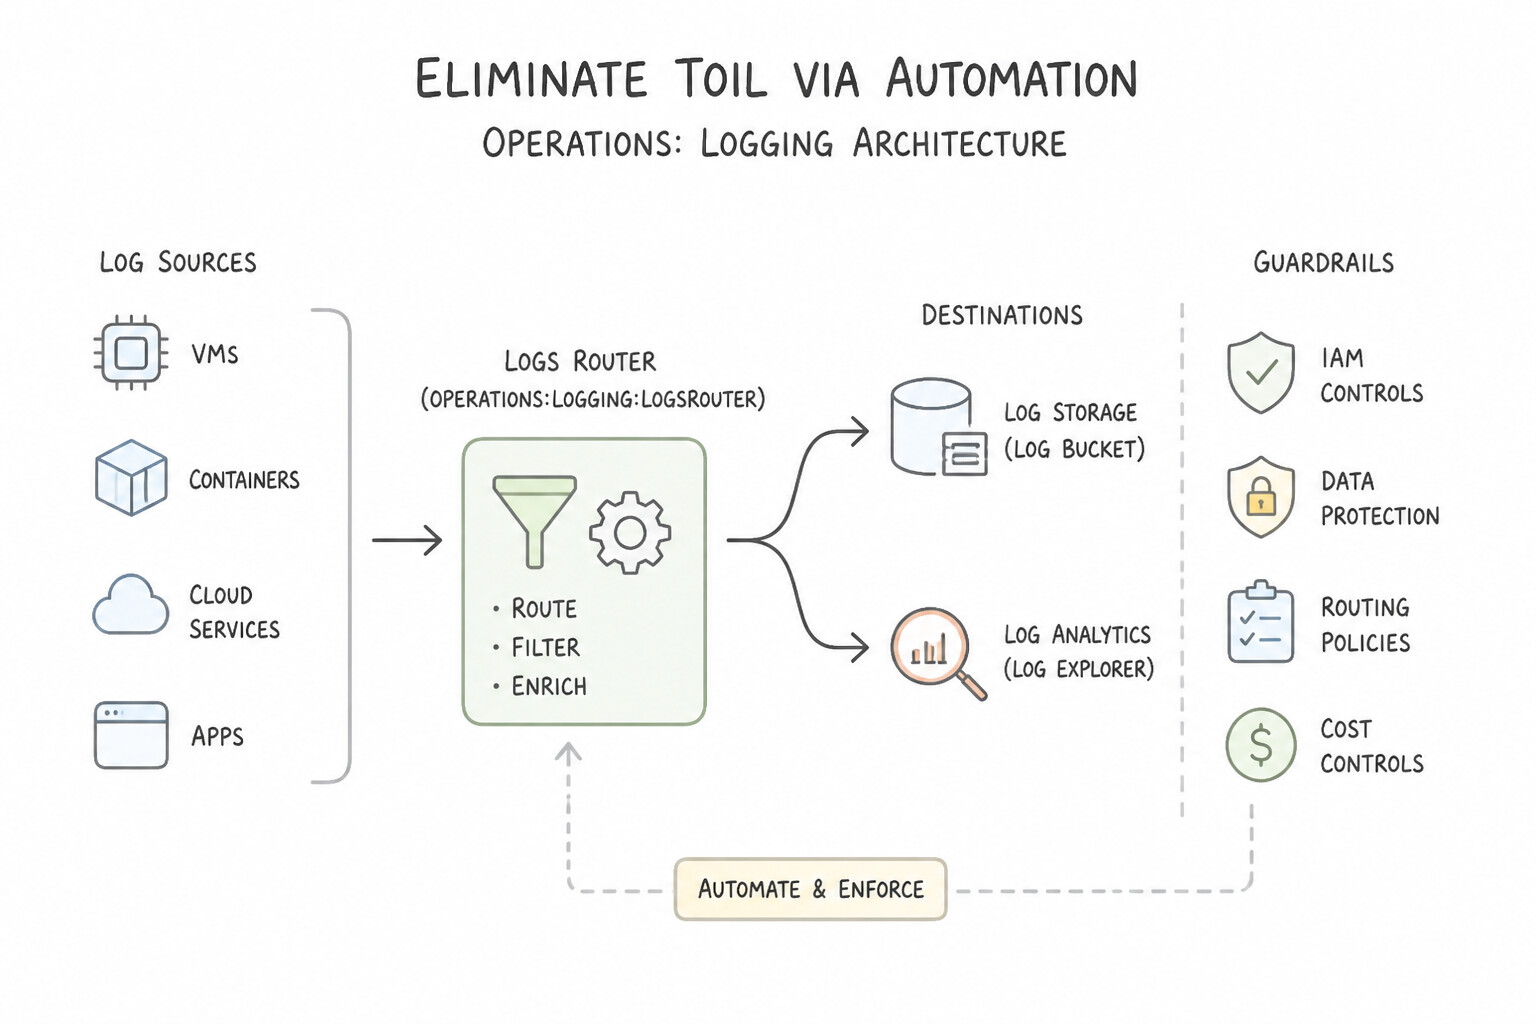
- Eliminate Toil via Automation: If a human operator performs a repetitive, manual, tactical task (like restarting hung processes, rotating certificates, or resizing disks), automate it via Autohealing, Cloud Scheduler + Cloud Run functions, or Terraform.
- Standardize and Document: Embed runbook URLs directly inside alerting notifications so on-call engineers have immediate remediation steps at 3:00 AM.
- Cloud Logging Architecture & Cost Control (6.2a):
- Unified
Ops Agent: On Compute Engine VMs, install the Google Cloud Ops Agent (replaces the legacy separate Monitoring and Logging agents) to collect system metrics (RAM, disk space, processes) and application logs. (Without the Ops Agent, Compute Engine only reports hypervisor-level metrics like CPU utilization and network/disk bytes—not guest OS RAM usage!). - Log Router Sinks & Exclusion Filters: Every log entry hits the Log Router first.
- To save ingestion costs on noisy debug or load-balancer health-check logs, configure an Exclusion Filter at the Log Router before logs are ingested into the
_Defaultbucket. - Note: Because Log Router evaluates all sinks in parallel, you can exclude noisy logs from the paid
_DefaultCloud Logging bucket while simultaneously routing them via an Inclusion Sink to a cheap Cloud StorageArchivebucket for compliance! - Log-Based Metrics: Extract a numeric Counter (count of matching log lines, e.g.,
PAYMENT_DECLINED) or Distribution (histogram of numeric values extracted via regex, e.g.,checkout_duration_ms) from logs to power Cloud Monitoring charts and alerts.
Key Implementation Patterns
- Long-Term Compliance Retention: Use Create a Cloud Logging sink to export logs to a Cloud Storage bucket with the Archive storage class. Archive storage provides the lowest cost for long-term retention of data that is rarely accessed. (Avoid alternative: BigQuery is optimized for analytics and is not the most cost-effective solution for long-term, rarely accessed storage.)
- Reducing Logging Costs: Use Create an exclusion filter on the _Default sink with the query severity="DEBUG". Exclusion filters drop logs at the router level before ingestion, preventing storage costs. (Avoid alternative: Retention settings affect storage duration, not the initial ingestion cost, which is charged upon entry.)
- Real-Time Security Analysis: Use Create a sink to export logs to a Cloud Pub/Sub topic. Create a subscription for the SIEM tool to pull messages from the topic. Pub/Sub provides the real-time message streaming required to export logs to external third-party tools. (Avoid alternative: Cloud Storage is for batch storage and archiving, not real-time streaming.)
Key Takeaways (6.2a)
- Use Cloud Logging Sinks to export logs for long-term retention.
- Select BigQuery for logs if you need to run analytics or SQL queries.
- Select Cloud Storage for logs if you need low-cost long-term retention or backup.
- Use the Archive storage class for data accessed less than once a year to minimize costs.
Consideration 6.2b: Profiling and benchmarking
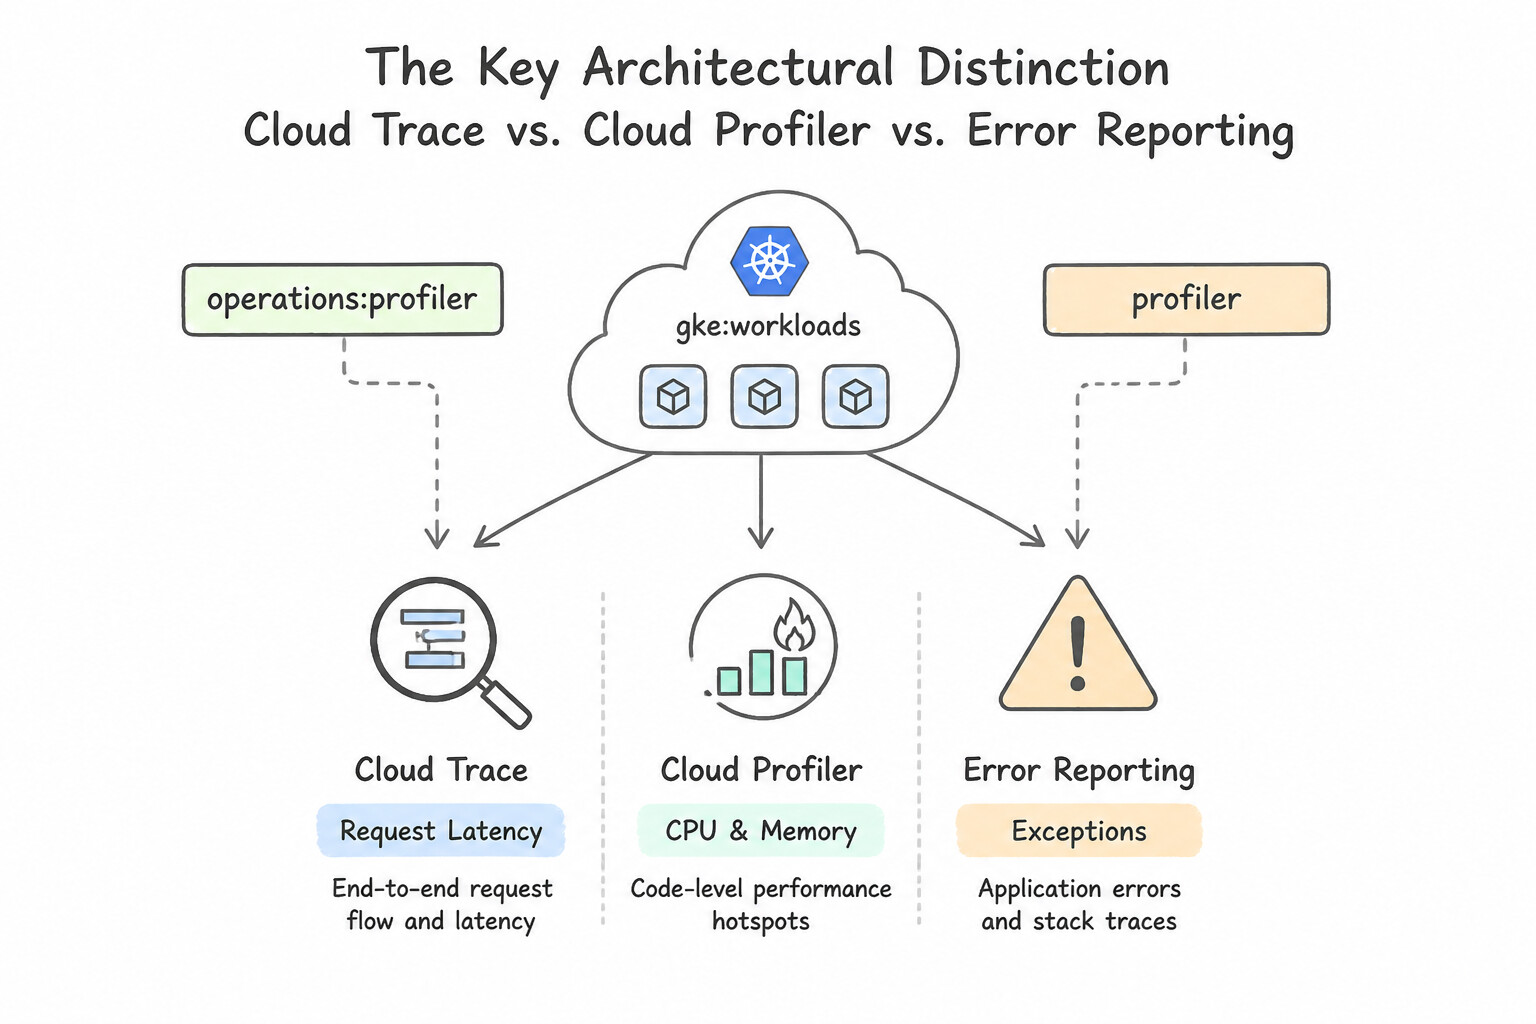
- The Key Architectural Distinction (
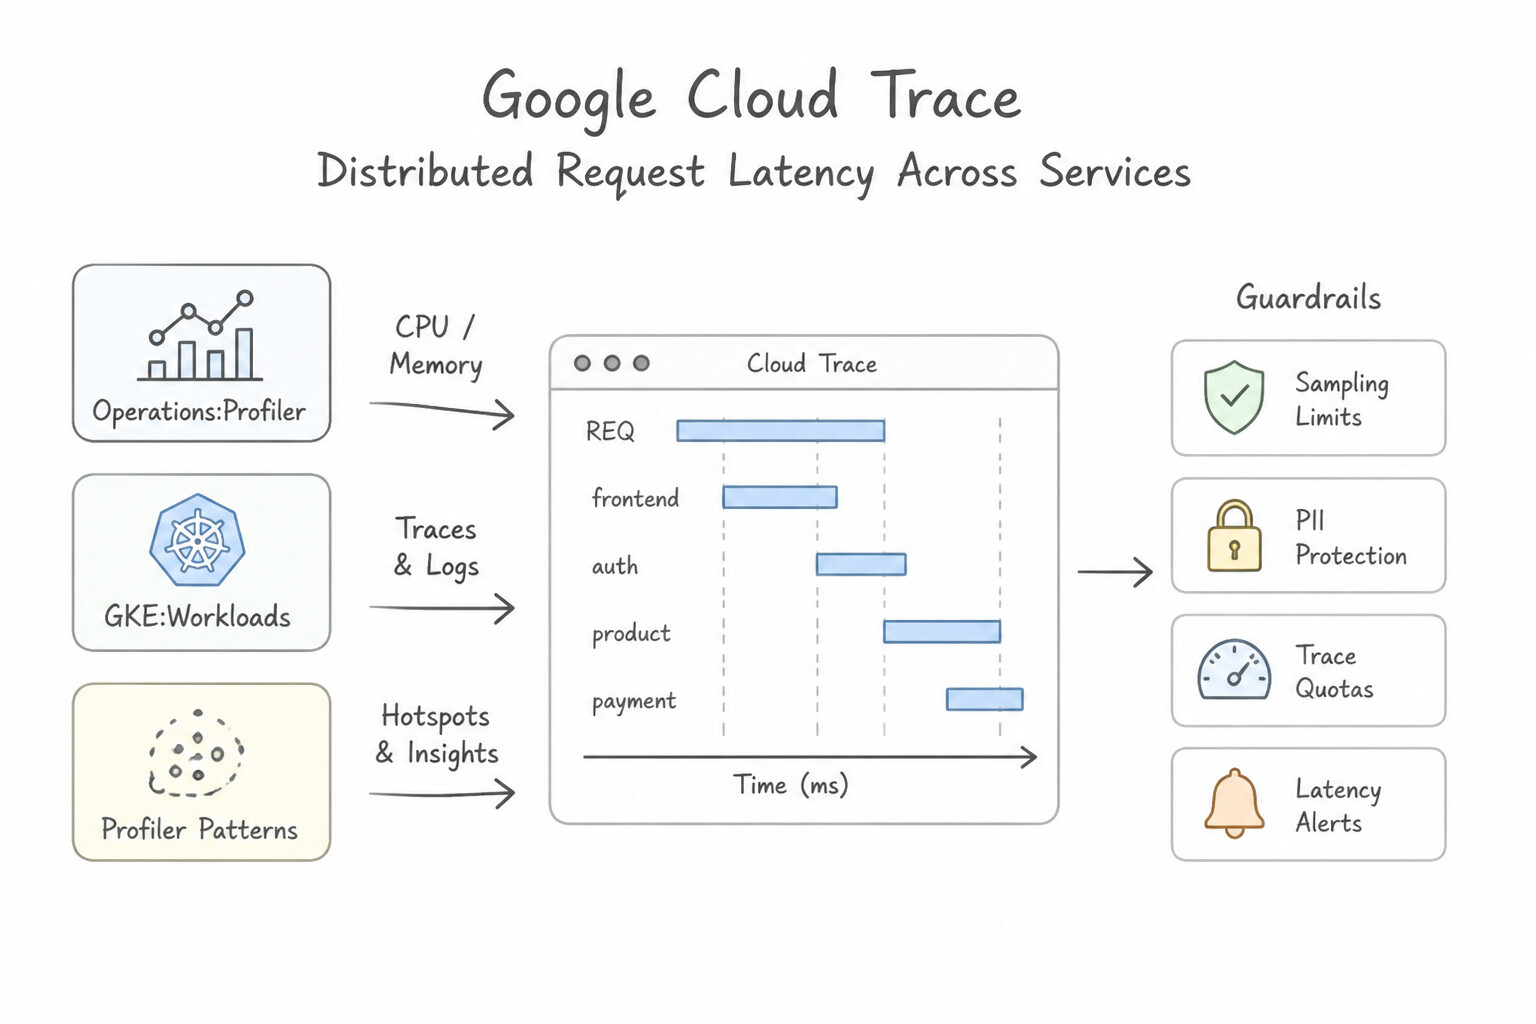
Cloud Tracevs.Cloud Profilervs.Error Reporting): - Cloud Trace (Distributed Request Latency Across Services): Answers "Why did an HTTP request take $2.4\text{ seconds}$, and which microservice or database call in the 8-service chain caused the delay?" Visualizes waterfall spans and latency distributions using W3C
traceparentheaders. - Cloud Profiler (Continuous Code-Level CPU & Memory Flame Graphs): Answers "Why is
order-serviceusing so much CPU or memory, and which exact function or method inside the code is the bottleneck?" Uses statistical sampling in production with < 0.5%–5% overhead, directly lowering Compute Engine/GKE bills when engineers optimize the hottest flame-graph functions! - Cloud Error Reporting: Automatically groups, deduplicates, and alerts on unhandled stack traces and runtime exceptions across Cloud Run, GKE, App Engine, and VMs.
Key Implementation Patterns
- Optimizing CPU-Intensive GKE Workloads: Use Install the Cloud Profiler agent on the application. Analyze the CPU time profile to identify the function consuming the most resources. Cloud Profiler allows you to analyze code-level performance, specifically identifying which functions consume the most CPU time via flame graphs.
- Diagnosing Memory Leaks in Compute Engine: Use Analyze the Heap profiles in the Cloud Profiler interface. Heap profiling specifically analyzes memory allocation and helps identify objects causing leaks. (Avoid alternative: CPU profiles track processing time, not memory usage.)
Key Takeaways (6.2b)
- Cloud Profiler is used for continuous profiling of CPU and Heap usage in production with low overhead.
- Use Profiler when you need to identify why a resource (like CPU or RAM) is being consumed at the code level.
- Cloud Monitoring provides high-level metrics (infrastructure saturation), while Profiler provides deep-dive code analysis.
- Cloud Trace helps with latency (slowness), whereas Profiler helps with resource efficiency (cost/load).
Consideration 6.2c: Alerting strategies
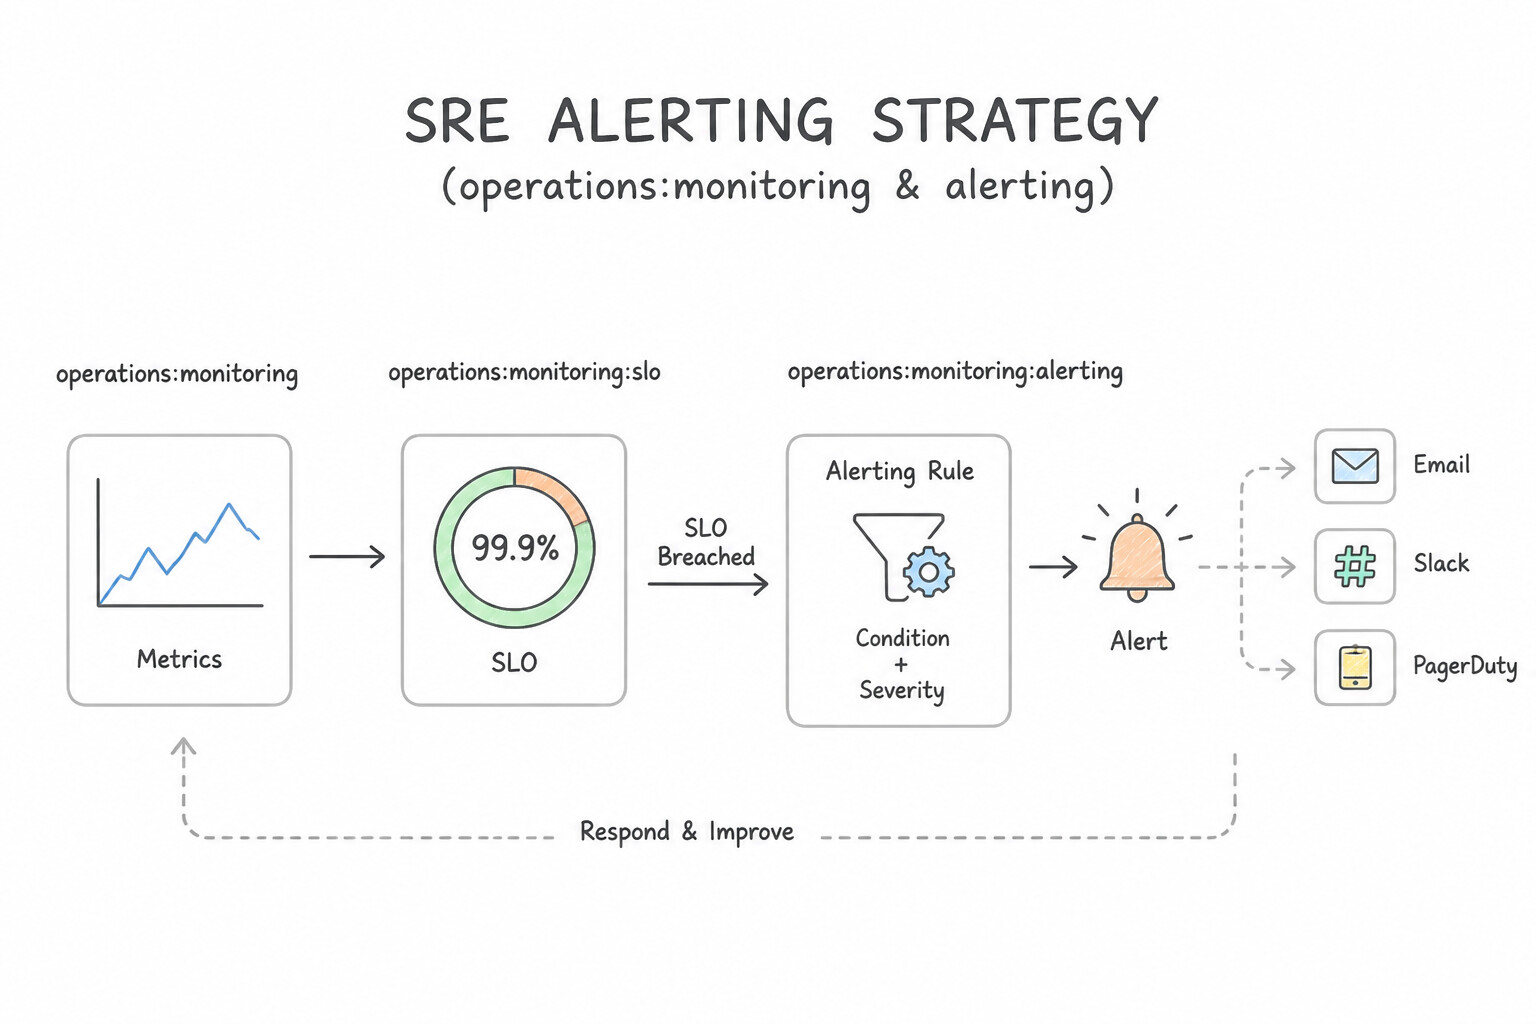
- SRE Alerting Rules in production:
- Page on Symptoms (User Pain), Not Causes: Page a human on-call engineer when the SLO Burn Rate spikes, when Global Uptime Checks fail from multiple regions, or when Load Balancer HTTP
5xxerror rates exceed threshold. Send low-urgency infrastructure warnings (like a single preempted Spot VM or disk at 75%) to a ticket queue or Slack channel, not a 3:00 AM pager! - Use Duration Windows & Multi-Condition Policies: Require a metric to breach the threshold continuously for an alignment window (e.g.,
duration: 5m) so transient 5-second CPU spikes do not trigger flapping alerts. - SLO Burn-Rate Alerting: Instead of alerting on every brief dip below 99.9%, alert when the burn rate (how fast the service is consuming its 30-day Error Budget, e.g., $10\times$ normal rate over a 1-hour window) threatens to exhaust the budget before the end of the compliance window.
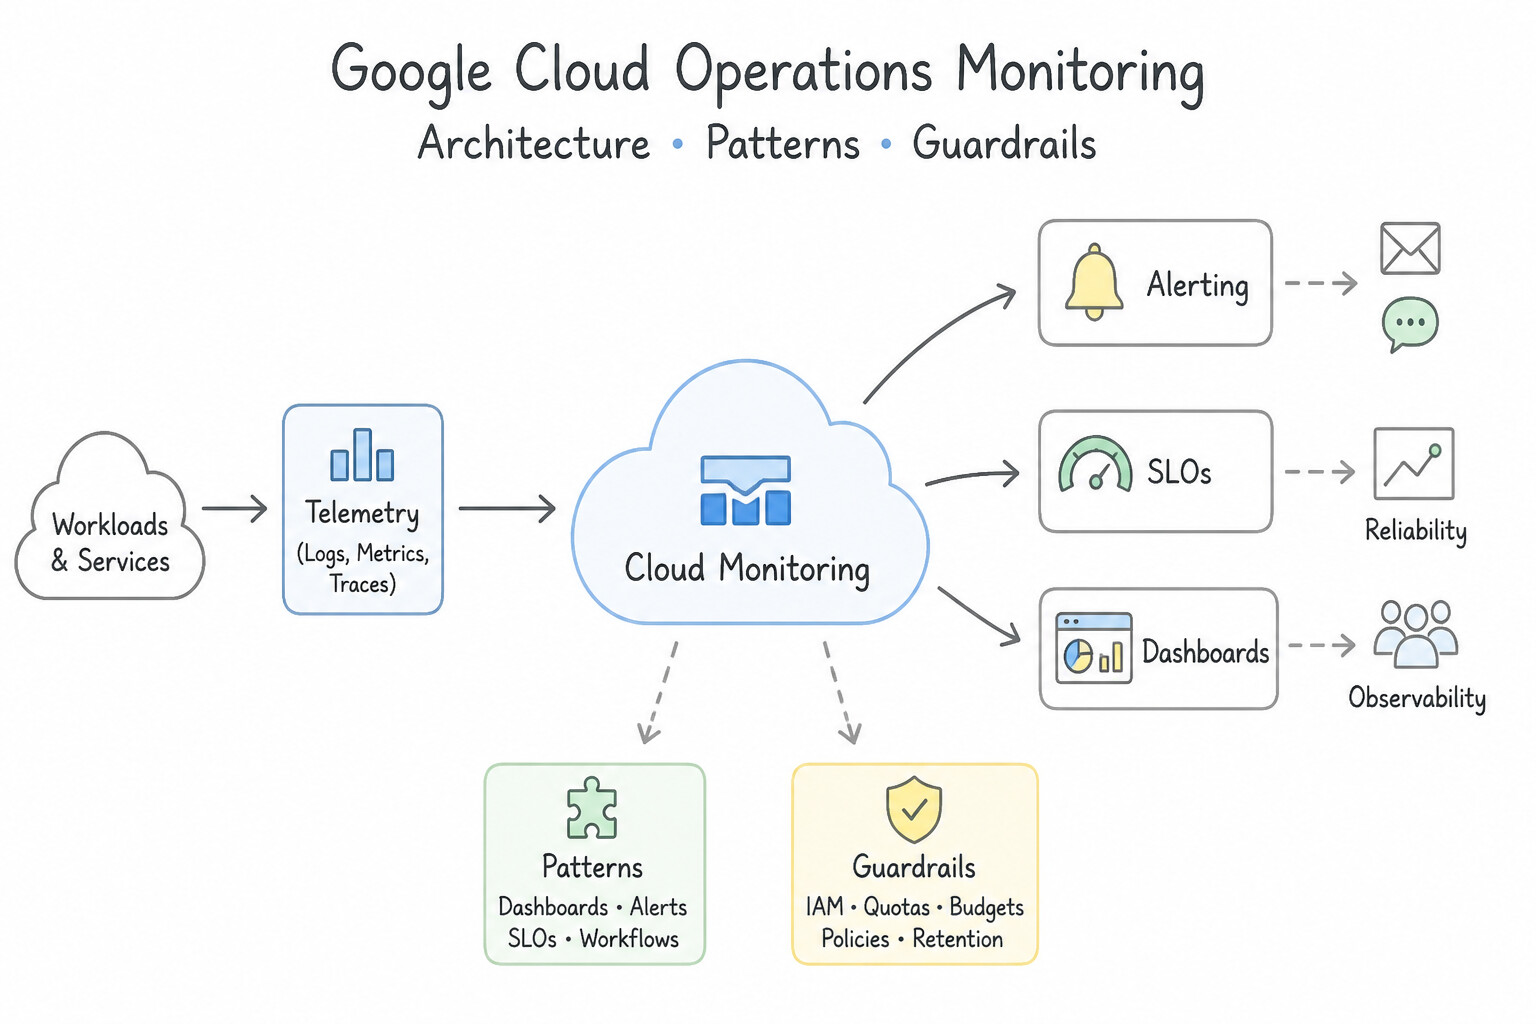
Key Implementation Patterns
- SLO-Based Alerting for High-Traffic Services: Use Configure an alert policy based on the SLO burn rate. Burn rate alerting measures the speed of error budget consumption, alerting only when the SLO is threatened. (Avoid alternative: Alerting on every error causes alert fatigue and ignores the allowed error budget.)
- Automated Remediation via Pub/Sub: Use Add a Pub/Sub notification channel to the alert policy. Configure the Cloud Function to trigger from the Pub/Sub topic. Pub/Sub allows you to decouple the alert from the action and natively triggers Cloud Functions for automated remediation.
- Legacy Application Error Detection: Use Create a counter log-based metric that matches the specific error string. Create an alert policy based on this metric with a threshold of five per minute. Log-based metrics allow you to count specific log entries over time and alert on that count using Cloud Monitoring.
Key Takeaways (6.2c)
- SLOs define reliability targets: They set user expectations for availability and performance.
- Error Budgets allow failure: The gap between 100% and the SLO is a budget that can be used for maintenance or accepted minor errors.
- Burn Rate reduces noise: Alerting on the speed of budget consumption is superior to raw error counts for high-traffic services.
- Avoid static thresholds: Static numbers do not adapt to traffic volume changes in dynamic cloud environments.
Quick Decision Cheat Sheet (Subsection 6.2)
If the Scenario Requires... | Choose This Google Cloud Pattern | Avoid This Common Mistake |
|---|---|---|
"Find which microservice hop in a distributed request chain is causing high latency" | Cloud Trace | Cloud Profiler or Cloud Audit Logs |
"Find which function/method in production code is consuming excessive CPU or leaking memory" | Cloud Profiler | Cloud Trace or SSHing into production VMs to run top |
"Monitor guest OS RAM utilization and disk space on Compute Engine VMs" | Install the Google Cloud Ops Agent | Relying on default Compute Engine hypervisor metrics |
"Count occurrences of a specific application log pattern and trigger a Cloud Monitoring alert" | Log-Based Metric (Counter or Distribution) + Cloud Monitoring Alerting Policy | Writing a custom cron job to query BigQuery every minute |
"Test external availability of a public web endpoint from multiple global locations" | Cloud Monitoring Uptime Checks + Alerting Policy | Internal VPC ping scripts |
"Reduce alert fatigue while protecting customer SLAs" | Alert on SLO Burn Rate and user-facing Golden Signals with a sustained duration window | Paging on-call engineers on every single-instance CPU spike |
Further Reading (Subsection 6.2)
- Route logs to supported destinations — Documentation on how to use Sinks to export logs to Cloud Storage, BigQuery, and Pub/Sub.
- Storage classes — Detailed comparison of Standard, Nearline, Coldline, and Archive storage classes including pricing and use cases.
- Log exclusions — This page explains how to configure exclusion filters to exclude matching log entries from ingestion, which reduces costs.
- Cloud Logging pricing — Details the pricing model, highlighting that costs are based on the volume of log data ingested.
- Exporting logs with the Logs Router — Refer to the 'Supported destinations' section to understand the use cases for Storage, BigQuery, and Pub/Sub.
- Stream logs from Google Cloud to Splunk — This reference architecture confirms the pattern of using Pub/Sub to push logs to external SIEMs.
Subsection 6.6: Deployment and release management (6.3), Support (6.4), Quality control (6.5) & Production reliability (6.6)
The Big Picture
The final domain chapter of this book unites Subsections 6.3 through 6.6 of Section 6:
6.3Deployment and release management: Governing how code moves safely through production using automated canary/blue-green gates, feature flags, and instant rollbacks.6.4Assisting with the support of deployed solutions: Escalating effectively through Google Cloud Customer Care, Service Health Dashboard, Error Reporting, and Active Assist.6.5Evaluating quality control measures: Enforcing automated quality gates (SONAR/SAST, Binary Authorization, SLO error budgets, and DORA metrics).6.6Ensuring the reliability of solutions in production: Proactively verifying system resilience through Chaos Engineering (6.6a), Penetration Testing (6.6b), and Load / Stress Testing (6.6c).
Why wait for a malicious attacker, a Black Friday traffic tsunami, or a zonal fiber cut to discover how your architecture behaves under stress? Principal Cloud Architects inject controlled failures (Chaos Engineering), simulate real-world attacks (Penetration Testing), and drive synthetic traffic spikes (Load Testing) continuously so production surprises are eliminated by design.
Consideration 6.6a: Chaos engineering
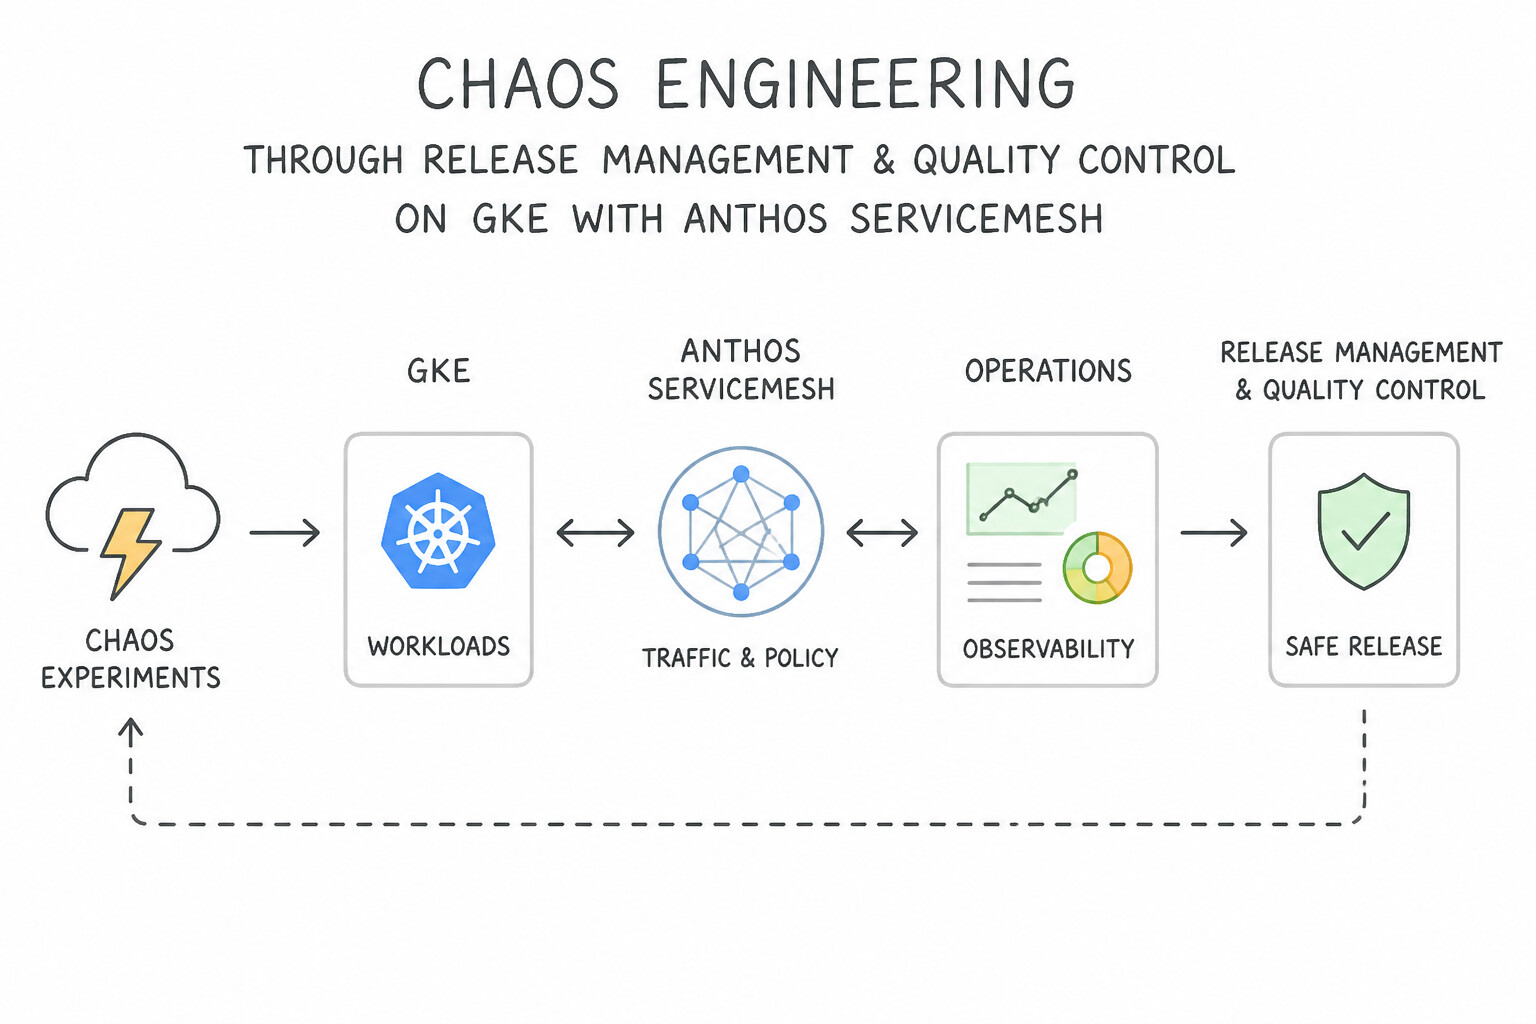
- Release Management (6.3) & Quality Control (6.5):
- Decouple Deployment from Release: Deploy new container revisions dark (
0%traffic tag on Cloud Run or behind a Feature Flag) and gradually enable the feature for internal testers → $1\%canary → @@ESCAPEDDOLLAR@@100% production, with automated rollback if error-rate SLIs spike. - Assisting with Support of Deployed Solutions (6.4):
- When a sudden regional degradation occurs, check Personalized Service Health first to verify whether a Google Cloud infrastructure event is underway before tearing down your own architecture. Use Cloud Error Reporting to triage new crash signatures and attach Cloud Trace IDs and Support Bundle diagnostics when escalating to Google Cloud Customer Care.
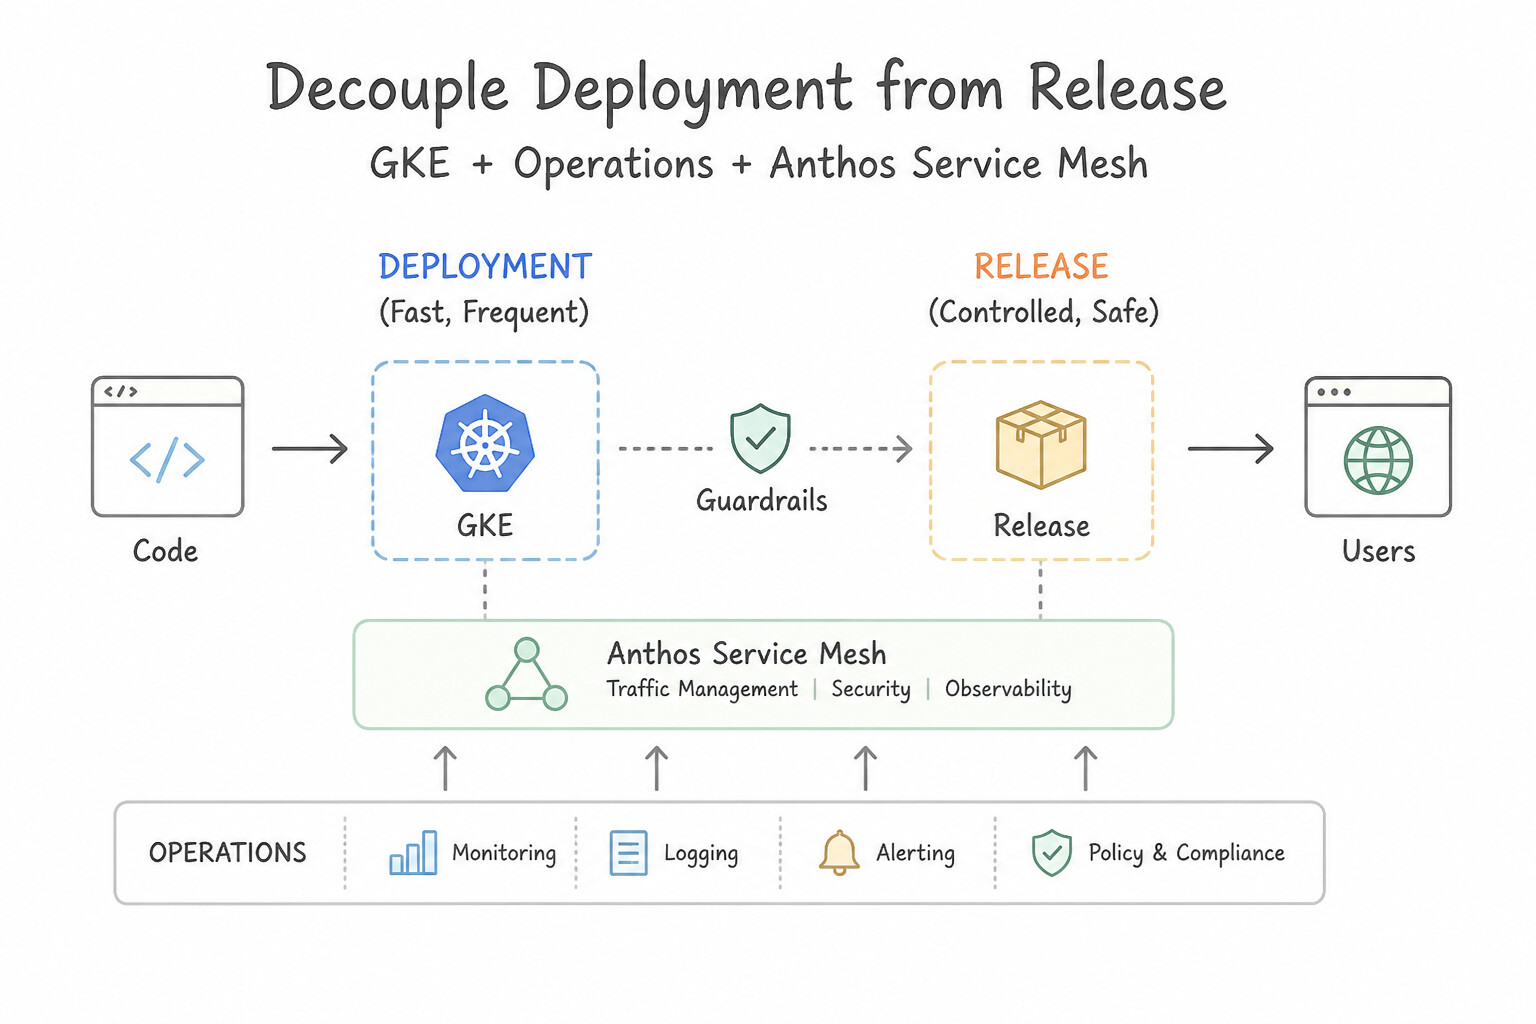
- Chaos Engineering Principles (6.6a):
- Define the Steady-State Hypothesis using measurable business SLIs (e.g., "Checkout success rate remains > 99.9% and
$p99$ latency $< 400\text{ ms}$"). - Inject Realistic Faults (terminate a GKE node pool in Zone A, trigger a Cloud SQL HA failover, inject $200\text{ ms}$ network latency via Istio/Cloud Service Mesh fault injection, or blackhole a downstream dependency).
- Minimize Blast Radius (start in staging, progress to small canary slices in production with an emergency abort/stop button).
- Verify Automated Recovery: Confirm that MIG/GKE autohealing, circuit breakers, retries with backoff, and alerts fire as designed—without human intervention!
Key Implementation Patterns
- GKE Microservices Pod Failure: Use Install Chaos Mesh on the GKE cluster and configure a PodChaos experiment to randomly kill Inventory pods. Chaos Mesh is the standard tool for injecting faults like pod failures into Kubernetes clusters. (Avoid alternative: Changing application code to crash is risky and hard to manage; use platform-level tools instead.)
- Service Mesh Latency Injection: Use Create a VirtualService configuration that includes a fault injection rule with a fixed delay. Anthos Service Mesh uses VirtualServices to inject faults like latency directly into the traffic flow without code changes. (Avoid alternative: Modifying source code violates the requirement to perform the test without code changes.)
- Cloud SQL High Availability Failover: Use Initiate a manual failover for the instance using the Google Cloud console. Manual failover is the standard, safe method provided by Google Cloud to test High Availability configurations. (Avoid alternative: Stopping an instance shuts down the service entirely rather than transferring control to the standby.)
Key Takeaways (6.6a)
- Chaos Engineering proactively tests system resilience by injecting faults.
- In Kubernetes, pods are expected to be ephemeral; testing pod failure helps ensure services are stateless or handle recovery correctly.
- Chaos Mesh is a standard Cloud Native Computing Foundation (CNCF) tool often used with GKE for these experiments.
- Never modify application code solely for the purpose of introducing random crashes in production.
Consideration 6.6b: Penetration testing
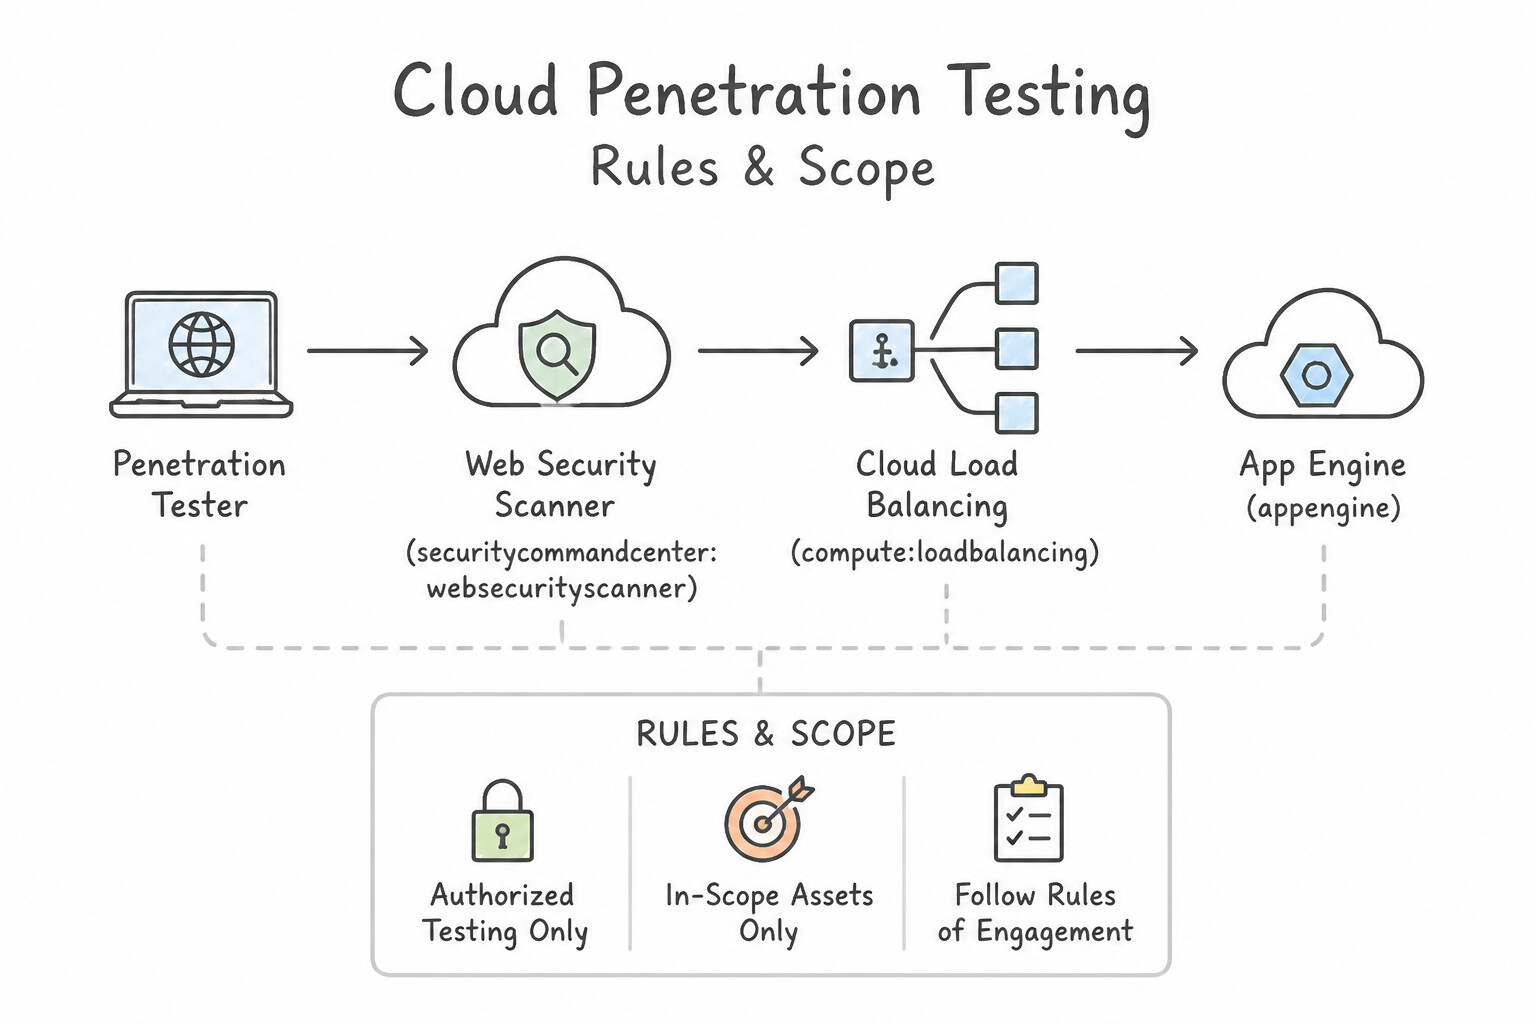
- Rules & Scope of Cloud Penetration Testing:
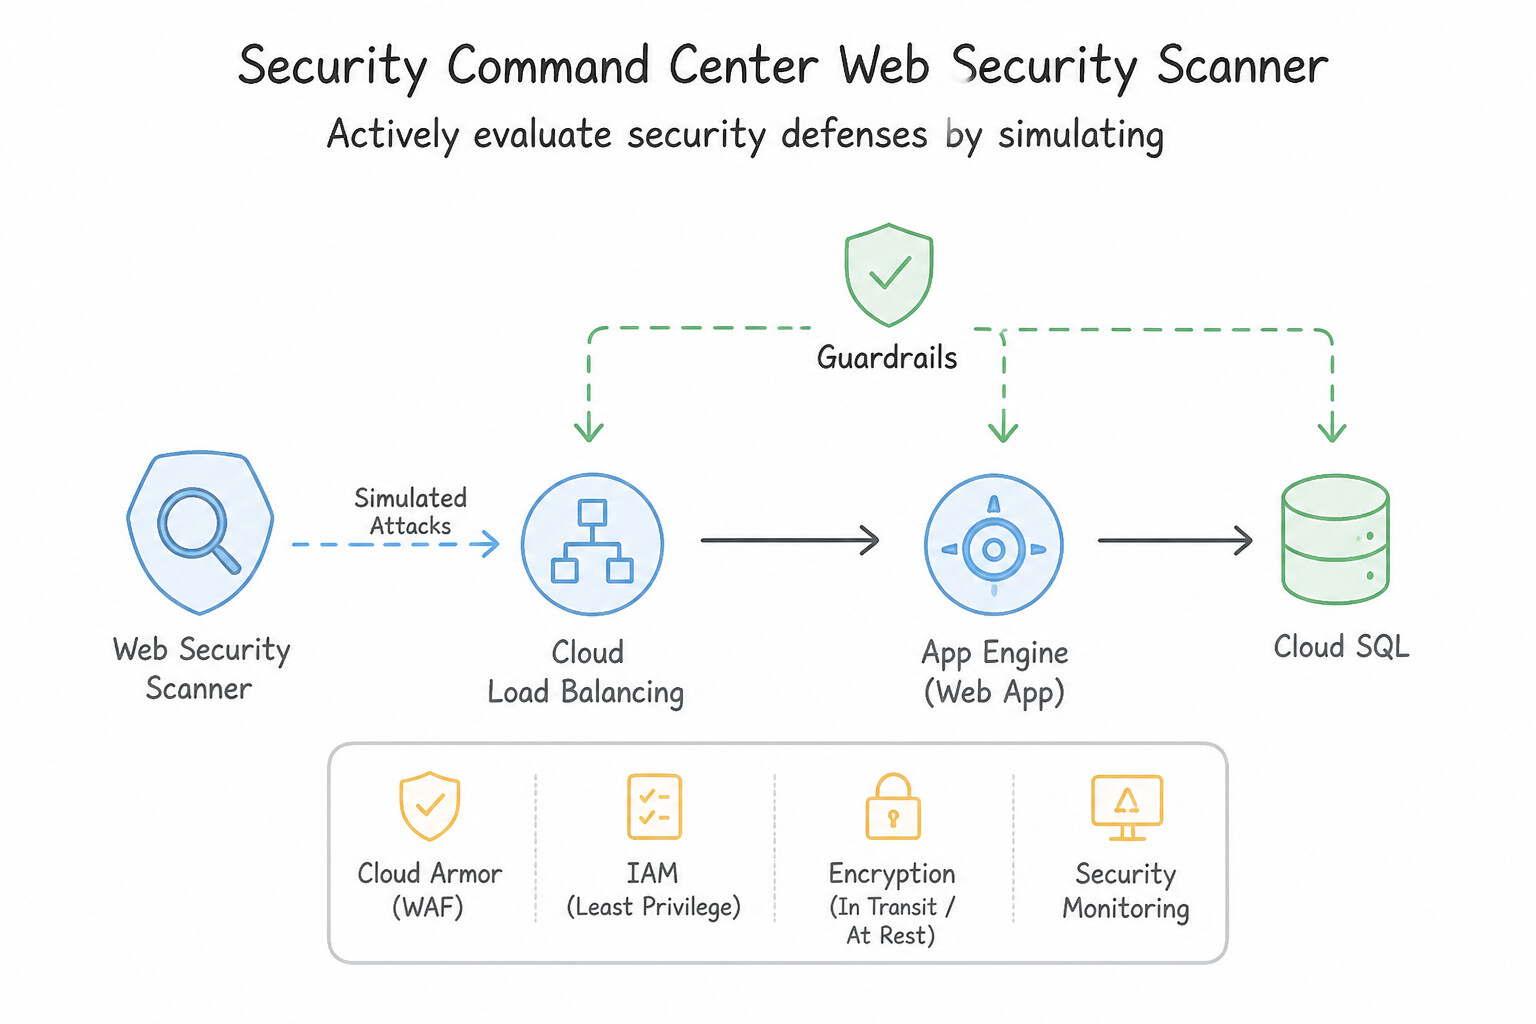
- Purpose: Actively evaluate security defenses by simulating real-world adversarial attacks (SQL injection, XSS, SSRF, IAM privilege escalation, metadata server token theft, misconfigured storage buckets) to uncover exploitable chains that passive scanners miss.
- Google Cloud Penetration Testing Policy: You do NOT need to ask Google Cloud for prior permission to conduct penetration testing against your own Google Cloud resources, provided you strictly abide by the Google Cloud Acceptable Use Policy (
AUP) and Terms of Service: - Strictly Prohibited: Testing other customers' resources, attacking Google Cloud's underlying physical/hypervisor infrastructure, or launching volumetric DoS attacks that impact shared multi-tenant Google infrastructure.
- Combine Active Pen Testing with Continuous Posture Management: Pair periodic red-team penetration tests with continuous automated scanning via Security Command Center (
SCC) (including Web Security Scanner and Attack Path Simulation).
Key Implementation Patterns
- Cloud Security Scanner for App Engine: Use Configure Web Security Scanner to perform a weekly scan of the application URL. Web Security Scanner is the native tool for automated vulnerability scanning (DAST) on App Engine applications. (Avoid alternative: Cloud Armor blocks attacks (WAF) but does not scan applications for existing vulnerabilities.)
- Prohibited Testing Activities: Use Prohibit the test because volumetric DDoS attacks against Google's infrastructure violate the Acceptable Use Policy. Volumetric DDoS attacks against Google's infrastructure are strictly prohibited by the Acceptable Use Policy. (Avoid alternative: Google Cloud does not permit all types of testing; attacking shared infrastructure is prohibited.)
- Penetration Testing Authorization Policy: Use Proceed with the penetration test without notifying Google, provided the test adheres to the Acceptable Use Policy. You do not need to notify Google for penetration testing as long as you follow the Acceptable Use Policy. (Avoid alternative: Google Cloud no longer requires a formal request or prior notification for penetration testing.)
Key Takeaways (6.6b)
- Web Security Scanner is the primary native tool for discovering vulnerabilities (XSS, mixed content) in running web applications on Google Cloud.
- Cloud Armor is a WAF used for blocking attacks, not for scanning applications for vulnerabilities.
- Artifact Analysis is used for scanning container images for package vulnerabilities, not for web application testing.
- Managed services are generally preferred over self-managed VMs for standard operational tasks to reduce overhead.
Consideration 6.6c: Load testing
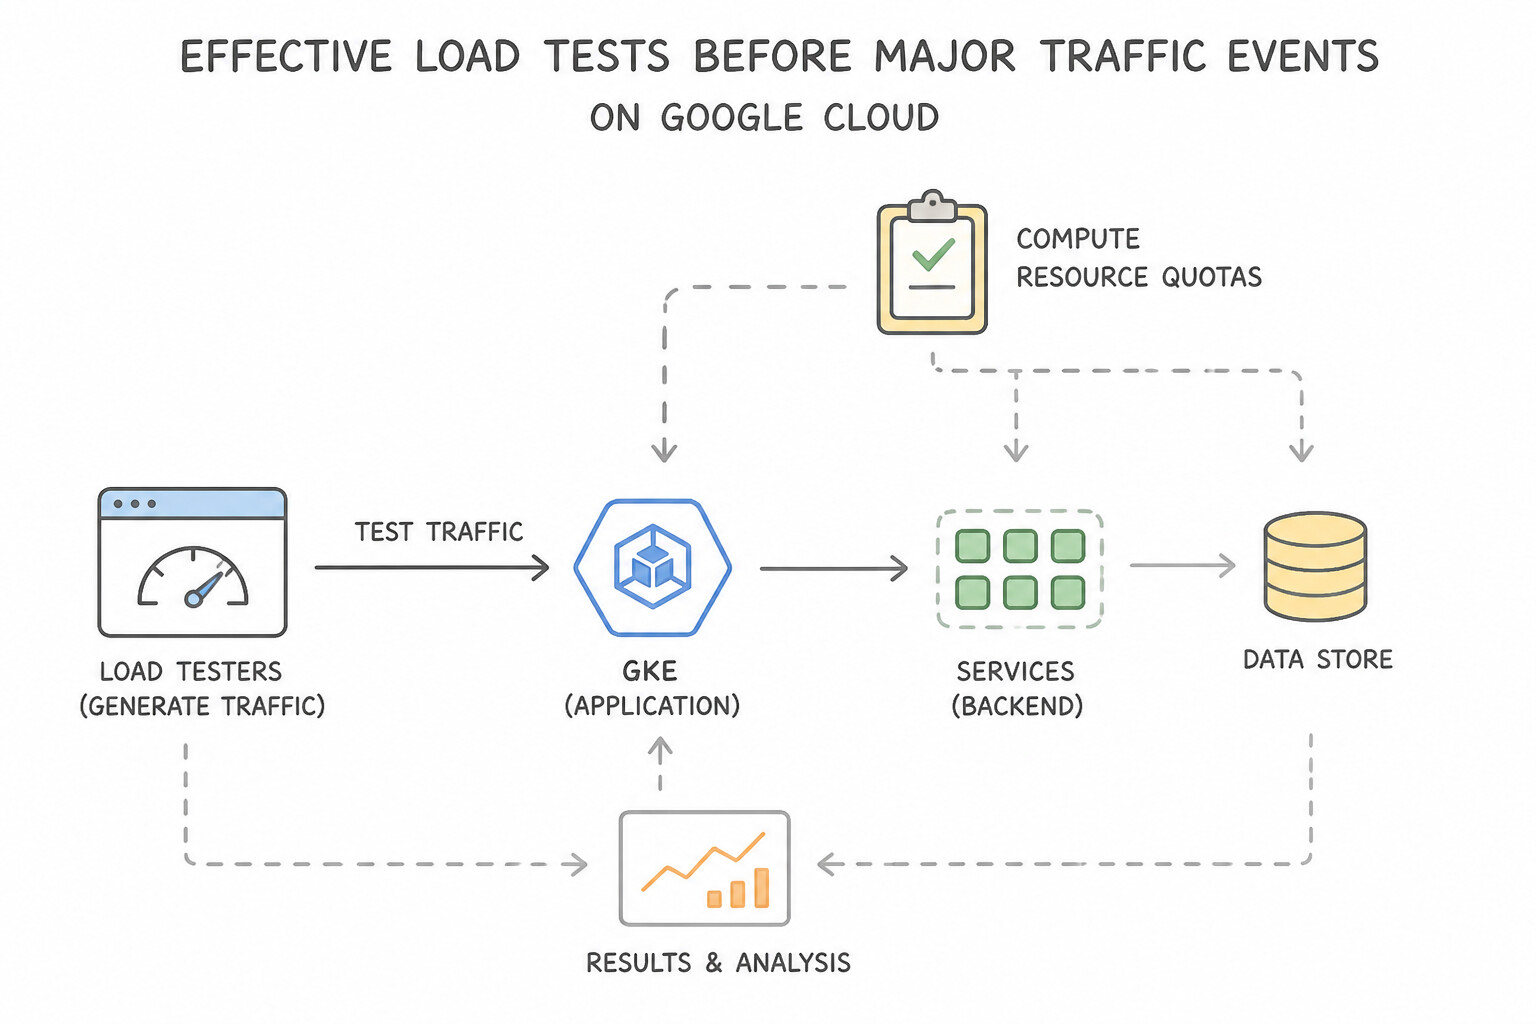
- How to Architect Effective Load Tests Before Major Traffic Events:
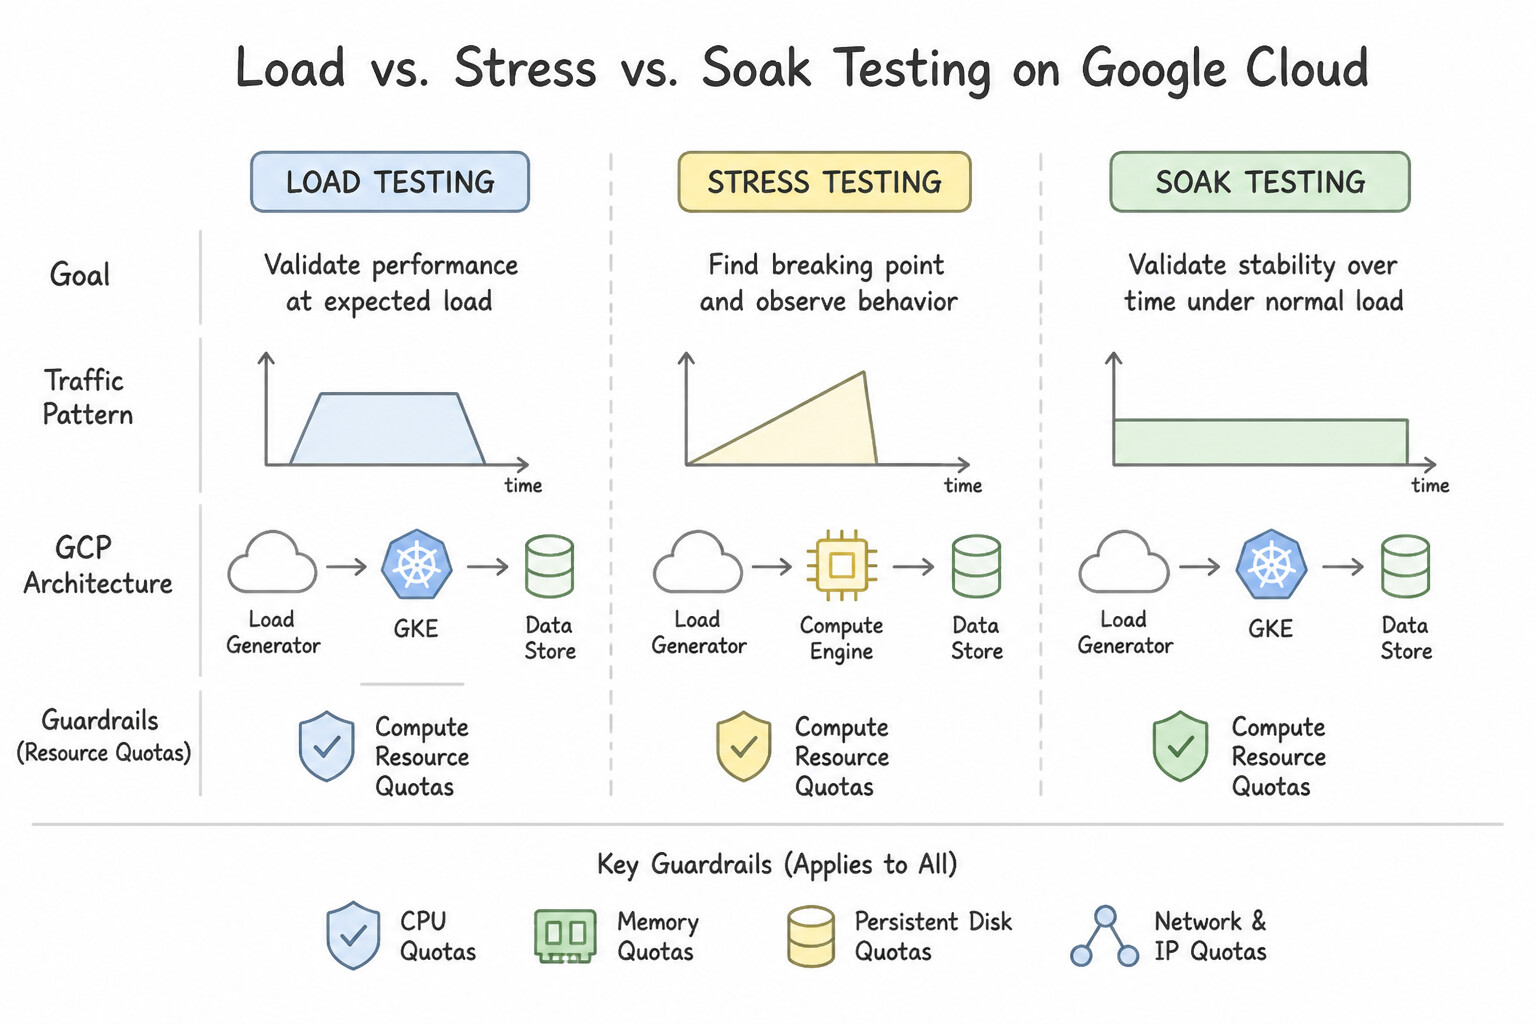
- Load Testing vs. Stress Testing vs. Soak Testing:
- Load Testing: Simulates expected normal and peak traffic (e.g., Black Friday $50,000\text{ RPS}$) to verify that SLIs/SLOs hold and autoscalers scale up fast enough.
- Stress / Breakpoint Testing: Ramps traffic beyond expected peak until the system breaks to identify the first bottleneck (e.g., Cloud SQL
max_connectionsexhaustion, Cloud NAT port exhaustion, or regional vCPU quota limits). - Soak / Endurance Testing: Runs sustained high traffic for 24–72 hours to catch slow memory leaks, disk log exhaustion, or connection pool leaks.
- Avoid Test-Rig Bottlenecks: Run distributed load generators (Locust or JMeter worker pods on GKE or Cloud Run) across multiple zones/regions so the load generator itself does not bottleneck on a single VM's NIC or ephemeral port limit!
Key Implementation Patterns
- Migrating Legacy Load Tests to Managed Services: Use Deploy the Distributed Load Testing on Google Cloud solution. This solution automates the deployment of infrastructure and supports existing JMeter scripts, minimizing manual work. (Avoid alternative: Using VMs requires manual setup and management of the operating system and software, which contradicts the goal of minimal operational overhead.)
- Resource Quota Constraints During Stress Tests: Use Check if the project has exceeded its Compute Engine resource quotas. A 10x load increase likely hit the project's resource quotas (e.g., vCPUs), preventing the creation of new instances. (Avoid alternative: The autoscaler limit stops scaling gracefully, whereas failing to create instances usually implies a platform-level rejection like a quota.)
- Identifying Autoscaling Latency via Spike Testing: Use Enable Predictive Autoscaling to scale resources before the event starts. Predictive Autoscaling scales out resources ahead of expected traffic spikes, eliminating the latency caused by VM boot times. (Avoid alternative: Max instances limits total capacity but does not improve the speed at which new instances are added during a spike.)
Key Takeaways (6.6c)
- Distributed Load Testing allows you to scale test traffic beyond the limits of a single machine.
- Using pre-packaged solutions on Google Cloud reduces operational overhead compared to manual infrastructure setup.
- JMeter is a standard tool for load testing that can be orchestrated on Google Cloud using Google Kubernetes Engine (GKE).
- Avoid rewriting legacy test assets if a platform solution exists to host them.
Quick Decision Cheat Sheet (Subsection 6.6)
If the Scenario Requires... | Choose This Google Cloud Pattern | Avoid This Common Mistake |
|---|---|---|
"Intentionally inject controlled failures (kill pods, add network latency, fail a zone) to verify resilience" | Chaos Engineering (with a steady-state hypothesis and blast-radius controls) | Load testing or static code analysis |
"Actively simulate adversarial cyberattacks to find exploitable vulnerabilities in your deployed app" | Penetration Testing (permitted on your own GCP resources under the AUP without prior Google approval) | Relying solely on passive IAM role reviews |
"Simulate heavy synthetic web traffic spikes to validate autoscaling and find bottlenecks before launch" | Load Testing (using distributed Locust/JMeter on GKE) | Chaos engineering or unit testing |
"MIG rolling update must NEVER drop below 100% serving capacity during a critical rollout" | Set maxUnavailable = 0 and maxSurge > 0 | Setting maxSurge = 0 and maxUnavailable = 20% |
"MIG rolling update must NEVER exceed the current target instance count (zero extra VM cost)" | Set maxSurge = 0 and maxUnavailable > 0 | Blue/Green deployment (requires 100% extra VMs) or maxSurge > 0 |
Further Reading (Subsection 6.6)
- Chaos Engineering with Chaos Mesh — A Google Cloud blog post discussing how to use Chaos Mesh on GKE to perform chaos engineering experiments, including pod killing scenarios.
- Well-Architected Framework: Reliability pillar — Part of the Google Cloud Architecture Framework explaining the importance of fault injection and chaos engineering for reliability.
- Fault Injection - Istio Documentation — The official Istio documentation explains how to configure a VirtualService to inject delays and aborts to test application resiliency.
- Anthos Service Mesh Overview — Provides a high-level overview of Anthos Service Mesh capabilities, including traffic management and observability.
- Cloud SQL High Availability — Overview of how High Availability works in Cloud SQL, including the primary and standby instance architecture.
- Test failover — Instructions on how to initiate a manual failover to test the configuration.
Book TOC · Previous · Chapter 7 of 8 · Next
AwesomeGCP.com Learning
The approach taken is a question-led learning approach: you explore realistic project scenarios where you need to make decisions or take actions to achieve business goals within specific constraints. Instead of passive learning, you are challenged to think and work through the options to master the Professional Cloud Architect (PCA) certification!